| Param | Original file | Final file |
|---|---|---|
| Filename | modeM0/AS1A07_027T01_9000003862_26774cztM0_level2.evt | modeM0/AS1A07_027T01_9000003862_26774cztM0_level2_quad_clean.evt |
| Size (bytes) | 569,165,760 | 41,806,080 |
| Size | 542.8 MB | 39.9 MB |
| Events in quadrant A | 2,108,112 | 276,487 |
| Events in quadrant B | 7,845,238 | 195,383 |
| Events in quadrant C | 2,104,149 | 279,839 |
| Events in quadrant D | 4,920,793 | 243,141 |
| Mode M0 | |||
|---|---|---|---|
| Quadrant | BADHDUFLAG | Total packets | Discarded packets |
| A | 0 | 8569 | 0 |
| B | 0 | 25863 | 0 |
| C | 0 | 8488 | 0 |
| D | 0 | 17265 | 0 |
| Mode M9 | |||
|---|---|---|---|
| Quadrant | BADHDUFLAG | Total packets | Discarded packets |
| A | 0 | 11 | 0 |
| B | 0 | 11 | 0 |
| C | 0 | 11 | 0 |
| D | 0 | 11 | 0 |
| Quadrant | Total seconds | Saturated seconds | Saturation percentage |
|---|---|---|---|
| A | 3813 | 25 | 0.655652% |
| B | 3813 | 2845 | 74.613165% |
| C | 3813 | 80 | 2.098085% |
| D | 3813 | 999 | 26.199843% |
Noise dominated data is calculated using 1-second bins in cleaned event files. If a bin has >2000 counts, and if more than 50% of those come from <1% of pixels, then it is considered to be noise-dominated and hence unusable.
| Quadrant | # 1 sec bins | Bins with >0 counts | Bins with >2000 counts | High rate bins dominated by noise | Noise dominated (total time) | Noise dominated (detector-on time) | Marked lightcurve |
|---|---|---|---|---|---|---|---|
| A | 4913 | 3814 | 0 | 0 | 0.00% | 0.00% | 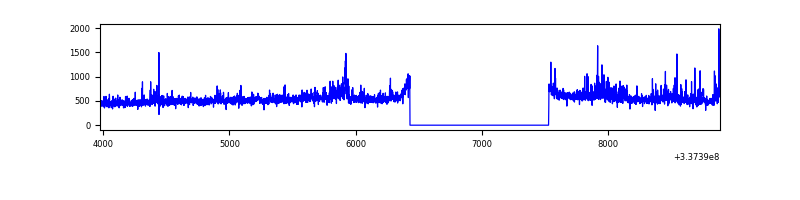 |
| B | 4913 | 3813 | 2500 | 2500 | 50.89% | 65.57% | 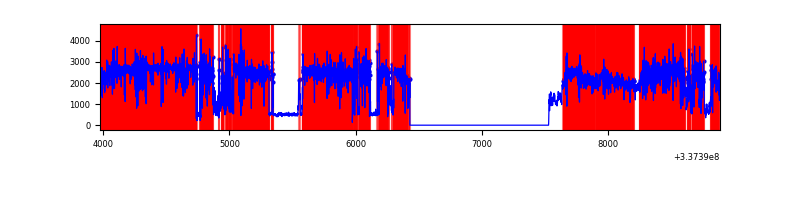 |
| C | 4913 | 3814 | 18 | 18 | 0.37% | 0.47% | 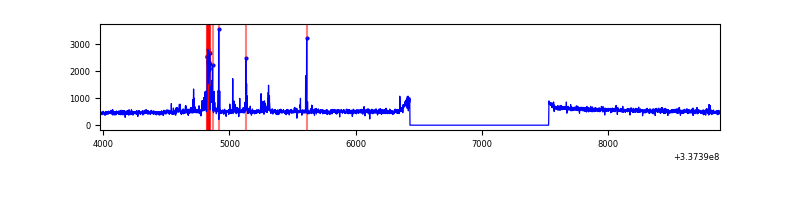 |
| D | 4913 | 3814 | 657 | 657 | 13.37% | 17.23% | 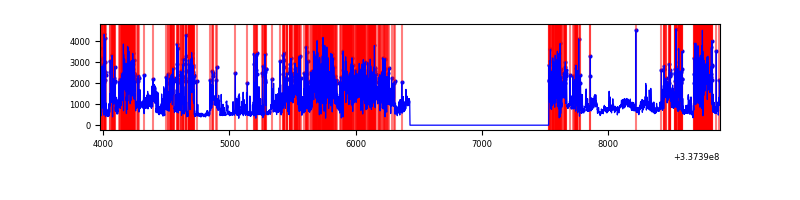 |
Top three noisy pixels from each quadrant. If the there are fewer than three noisy pixels in the level2.evt file, extra rows are filled as -1
| Pixel properties | Quadrant properties | ||||||
|---|---|---|---|---|---|---|---|
| Quadrant | DetID | PixID | Counts | Sigma | Mean | Median | Sigma |
| A | 0 | 13 | 189567 | 1872.72 | 496 | 486 | 101.0 |
| A | 13 | 254 | 6411 | 58.68 | 496 | 486 | 101.0 |
| A | 3 | 137 | 4687 | 41.61 | 496 | 486 | 101.0 |
| B | 0 | 189 | 6562465 | 105285.73 | 326 | 319 | 62.3 |
| B | 0 | 190 | 9010 | 139.44 | 326 | 319 | 62.3 |
| B | 12 | 111 | 7368 | 113.1 | 326 | 319 | 62.3 |
| C | 2 | 16 | 139893 | 1232.97 | 484 | 487 | 113.1 |
| C | 14 | 238 | 76411 | 671.51 | 484 | 487 | 113.1 |
| C | 13 | 61 | 3235 | 24.3 | 484 | 487 | 113.1 |
| D | 7 | 80 | 2341806 | 21785.01 | 444 | 433 | 107.5 |
| D | 1 | 52 | 602572 | 5602.53 | 444 | 433 | 107.5 |
| D | 15 | 21 | 247430 | 2298.15 | 444 | 433 | 107.5 |
Histogram calculated using DETX and DETY for each event in the final _common_clean file
| Quadrant A | 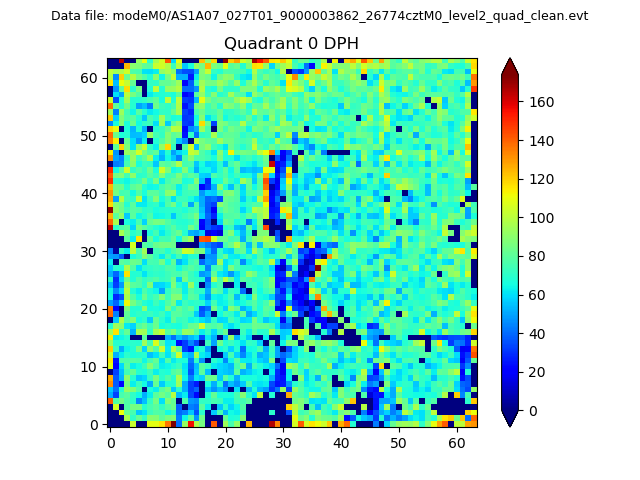 |
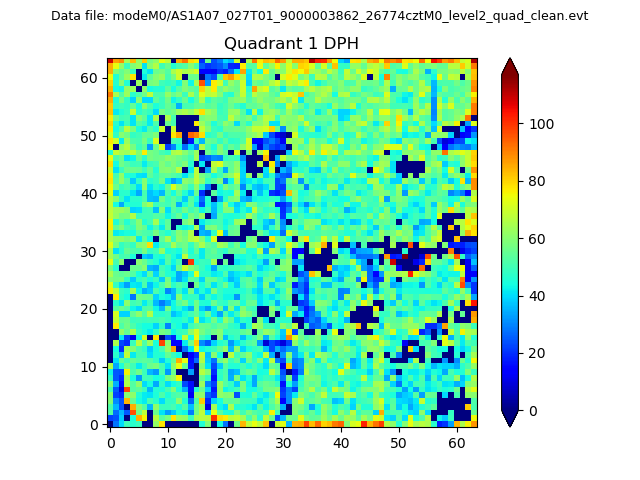 |
Quadrant B |
|---|---|---|---|
| Quadrant D | 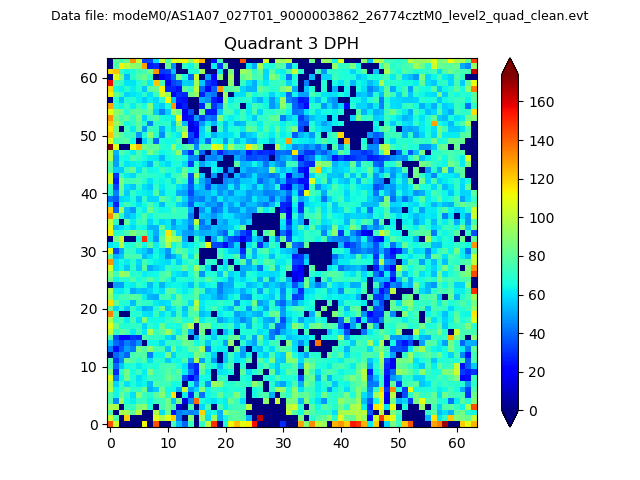 |
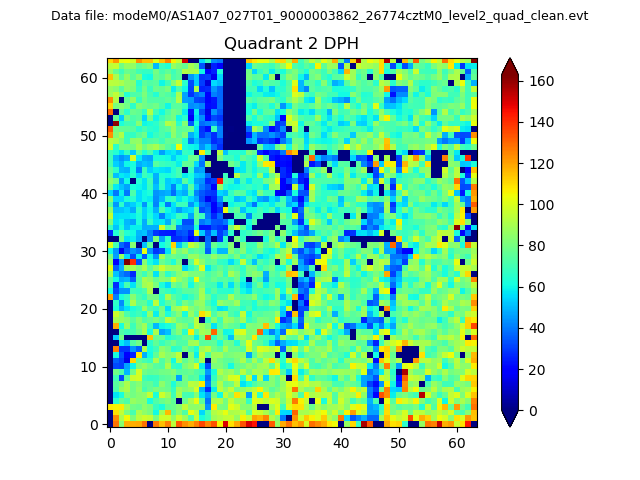 |
Quadrant C |
| Plot type | Count rate plots | Images |
|---|---|---|
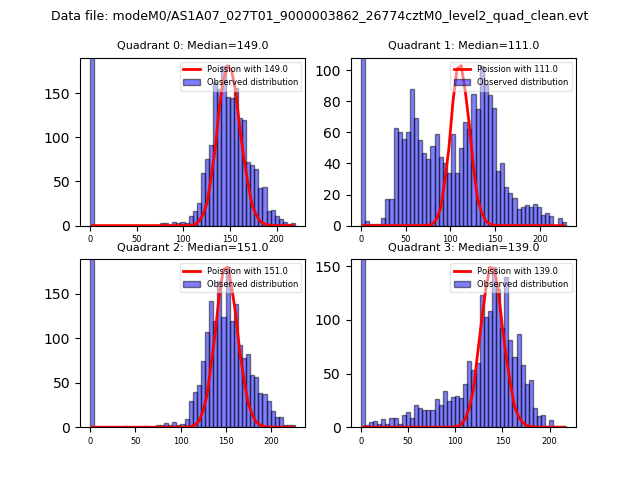
| Comparison with Poisson distribution Blue bars denote a histogram of data divided into 1 sec bins. Red curve is a Poisson curve with rate = median count rate of data. |
 |
 |
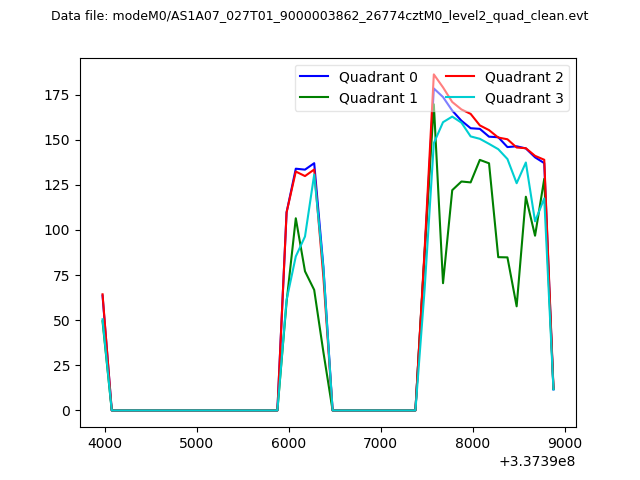
| Quadrant-wise count rates Data is divided into 100 sec bins |
 |
|
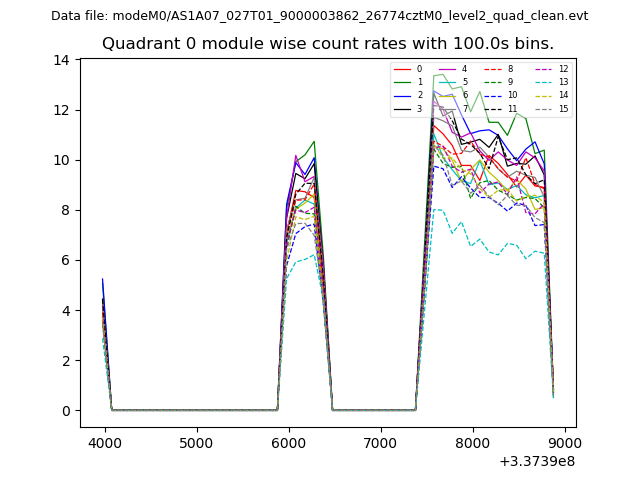
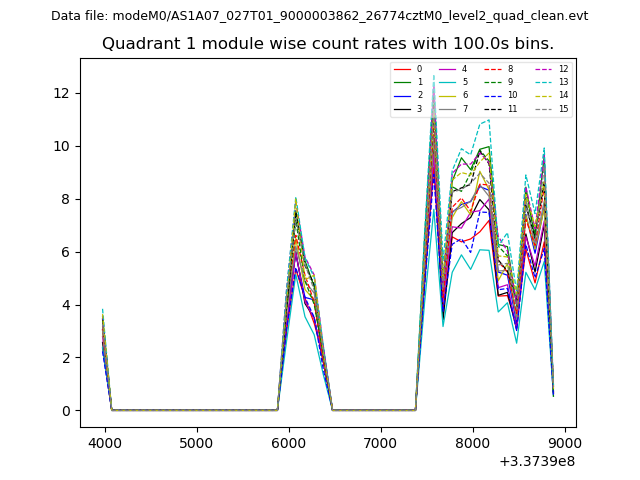
| Module-wise count rates for Quadrant A Data is divided into 100 sec bins |
 |
 |
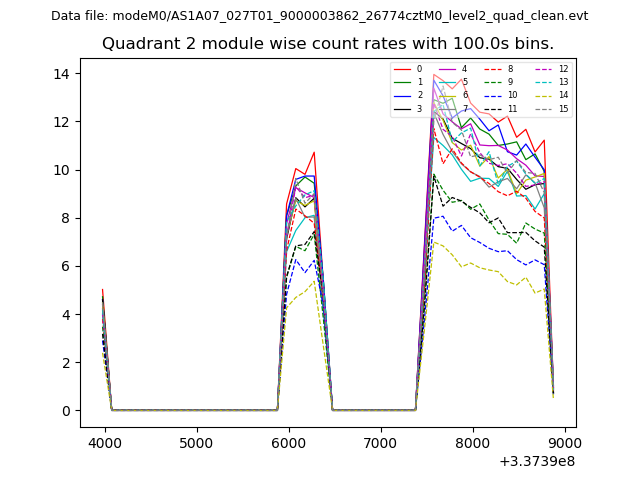
| Module-wise count rates for Quadrant B Data is divided into 100 sec bins |
 |
 |
| Module-wise count rates for Quadrant C Data is divided into 100 sec bins |
 |
 |
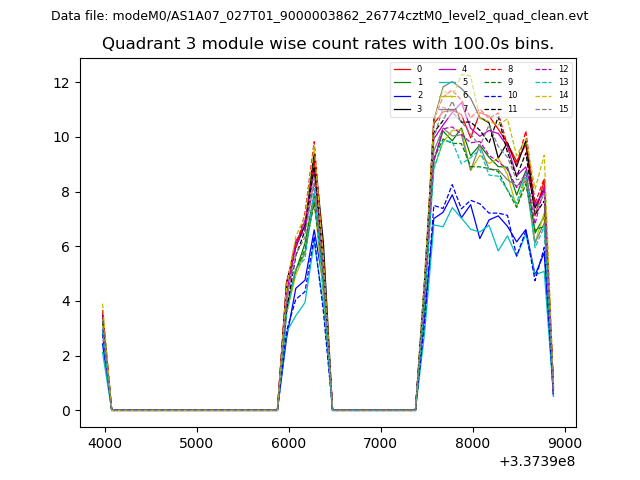
| Module-wise count rates for Quadrant D Data is divided into 100 sec bins |
 |
 |
| Parameter | Plot |
|---|---|
| CZT HV Monitor | 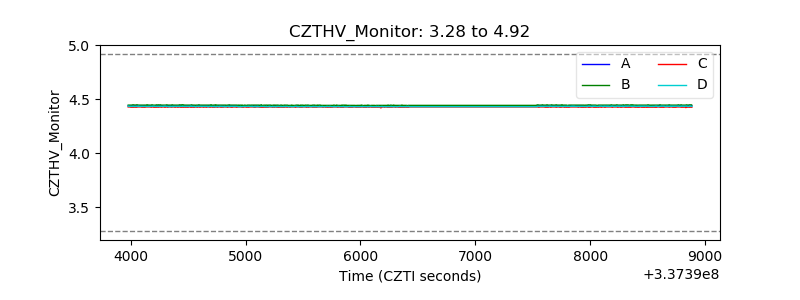 |
| D_VDD | 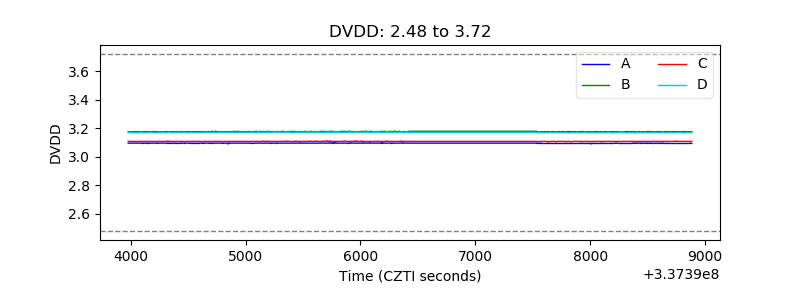 |
| Temperature 1 |  |
| Veto HV Monitor | 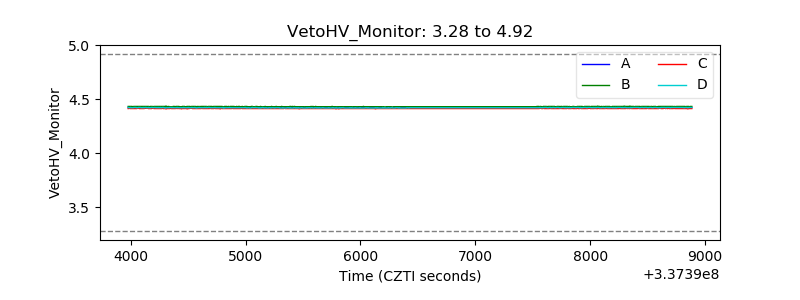 |
| Veto LLD | 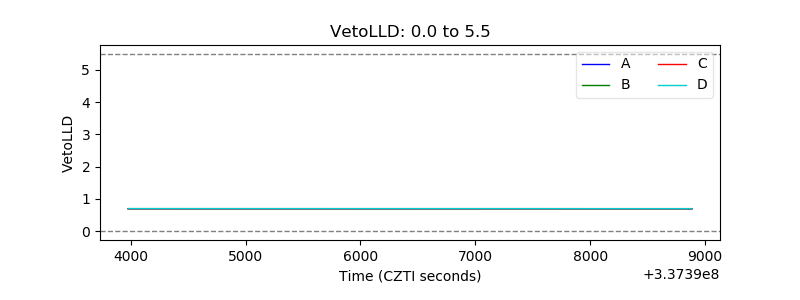 |
| Alpha Counter | 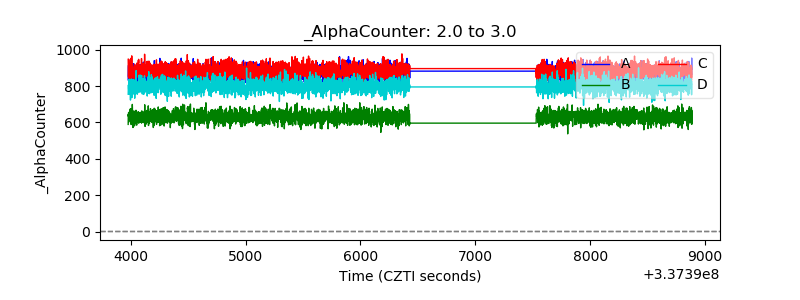 |
| _CPM_Rate | 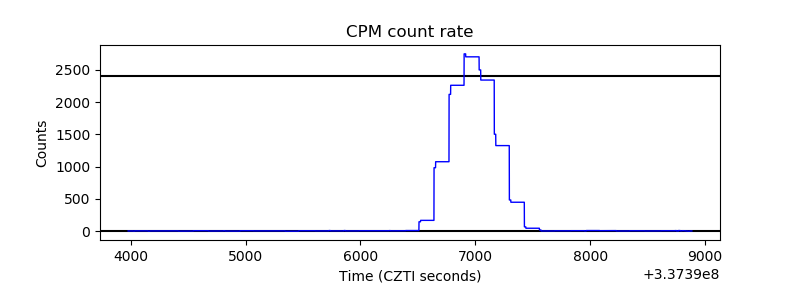 |
| CZT Counter |  |
| +2.5 Volts monitor |  |
| +5 Volts monitor |  |
| _ROLL_ROT | 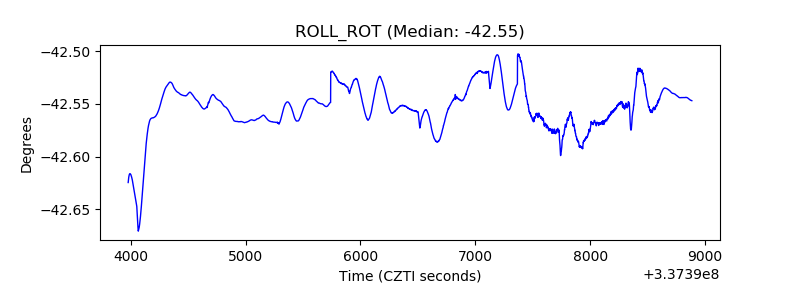 |
| _Roll_DEC | 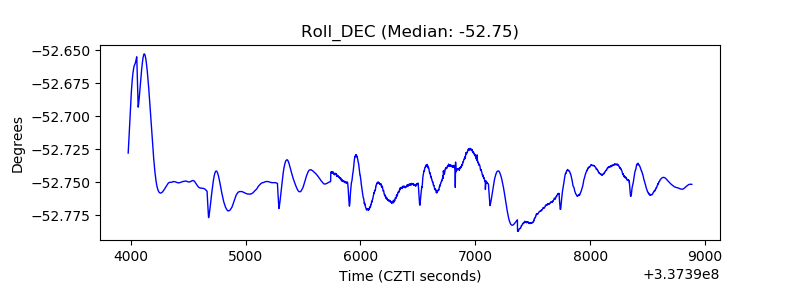 |
| _Roll_RA |  |
| Veto Counter | 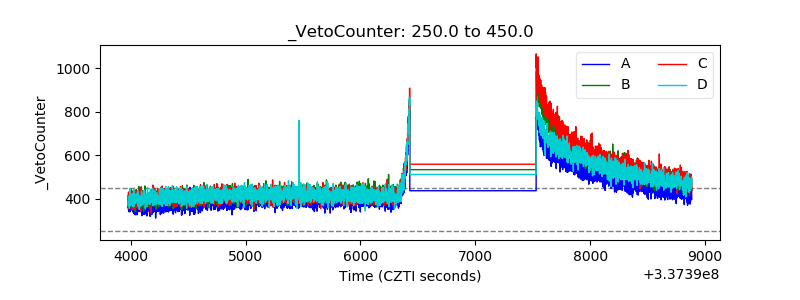 |