| Param | Original file | Final file |
|---|---|---|
| Filename | modeM0/AS1A07_027T01_9000003862_26776cztM0_level2.evt | modeM0/AS1A07_027T01_9000003862_26776cztM0_level2_quad_clean.evt |
| Size (bytes) | 797,794,560 | 97,585,920 |
| Size | 760.8 MB | 93.1 MB |
| Events in quadrant A | 4,646,153 | 659,186 |
| Events in quadrant B | 9,046,693 | 571,832 |
| Events in quadrant C | 3,429,710 | 669,323 |
| Events in quadrant D | 6,612,895 | 613,309 |
| Mode M0 | |||
|---|---|---|---|
| Quadrant | BADHDUFLAG | Total packets | Discarded packets |
| A | 0 | 18151 | 0 |
| B | 0 | 30921 | 0 |
| C | 0 | 13970 | 0 |
| D | 0 | 23999 | 0 |
| Mode M9 | |||
|---|---|---|---|
| Quadrant | BADHDUFLAG | Total packets | Discarded packets |
| A | 0 | 13 | 0 |
| B | 0 | 13 | 0 |
| C | 0 | 13 | 0 |
| D | 0 | 13 | 0 |
| Quadrant | Total seconds | Saturated seconds | Saturation percentage |
|---|---|---|---|
| A | 6313 | 75 | 1.188025% |
| B | 6314 | 2691 | 42.619576% |
| C | 6314 | 76 | 1.203674% |
| D | 6313 | 750 | 11.880247% |
Noise dominated data is calculated using 1-second bins in cleaned event files. If a bin has >2000 counts, and if more than 50% of those come from <1% of pixels, then it is considered to be noise-dominated and hence unusable.
| Quadrant | # 1 sec bins | Bins with >0 counts | Bins with >2000 counts | High rate bins dominated by noise | Noise dominated (total time) | Noise dominated (detector-on time) | Marked lightcurve |
|---|---|---|---|---|---|---|---|
| A | 7538 | 6314 | 28 | 28 | 0.37% | 0.44% | 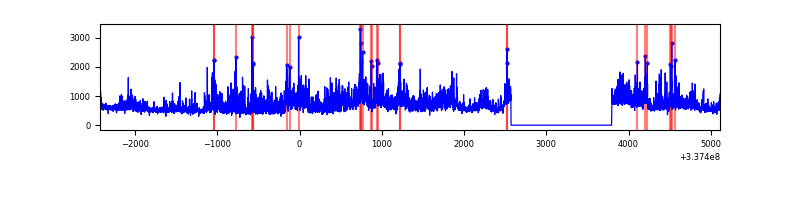 |
| B | 7539 | 6315 | 2403 | 2403 | 31.87% | 38.05% | 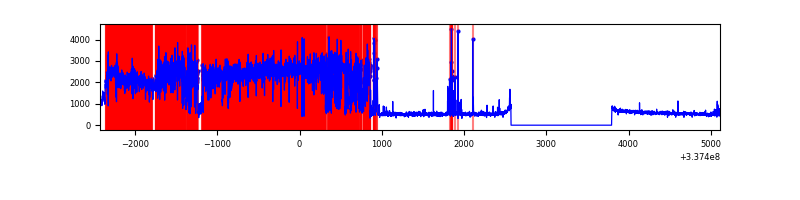 |
| C | 7539 | 6315 | 3 | 3 | 0.04% | 0.05% | 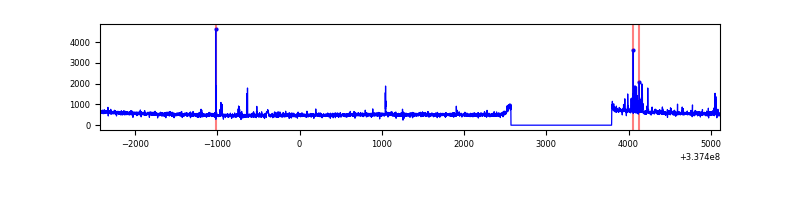 |
| D | 7538 | 6314 | 628 | 628 | 8.33% | 9.95% | 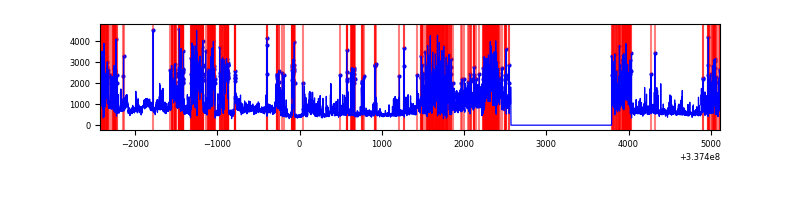 |
Top three noisy pixels from each quadrant. If the there are fewer than three noisy pixels in the level2.evt file, extra rows are filled as -1
| Pixel properties | Quadrant properties | ||||||
|---|---|---|---|---|---|---|---|
| Quadrant | DetID | PixID | Counts | Sigma | Mean | Median | Sigma |
| A | 0 | 13 | 1473612 | 9047.35 | 816 | 801 | 162.8 |
| A | 12 | 96 | 21929 | 129.79 | 816 | 801 | 162.8 |
| A | 13 | 254 | 10457 | 59.32 | 816 | 801 | 162.8 |
| B | 0 | 189 | 6304675 | 48493.01 | 698 | 683 | 130.0 |
| B | 12 | 111 | 15412 | 113.3 | 698 | 683 | 130.0 |
| B | 0 | 190 | 13811 | 100.99 | 698 | 683 | 130.0 |
| C | 14 | 238 | 129709 | 679.4 | 816 | 822 | 189.7 |
| C | 2 | 16 | 101091 | 528.55 | 816 | 822 | 189.7 |
| C | 7 | 235 | 11520 | 56.39 | 816 | 822 | 189.7 |
| D | 7 | 80 | 3090267 | 16783.93 | 785 | 768 | 184.1 |
| D | 15 | 21 | 300328 | 1627.38 | 785 | 768 | 184.1 |
| D | 1 | 52 | 193437 | 1046.69 | 785 | 768 | 184.1 |
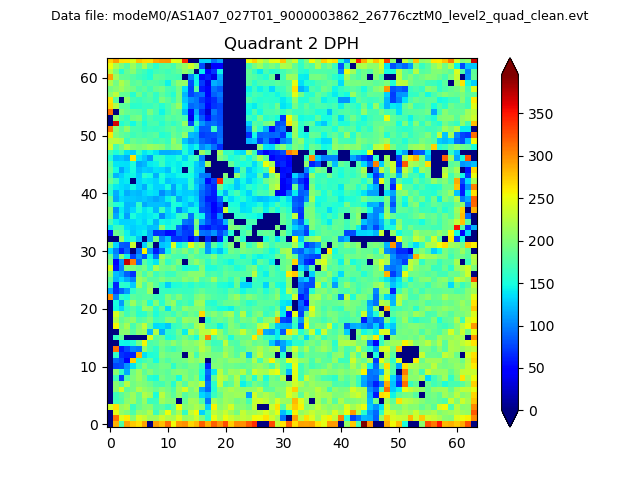
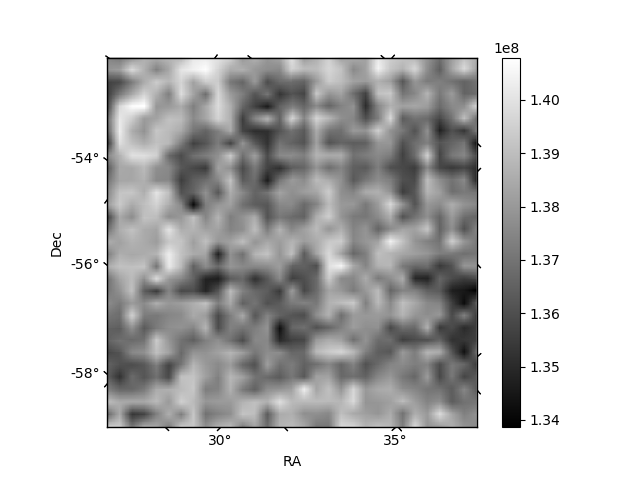
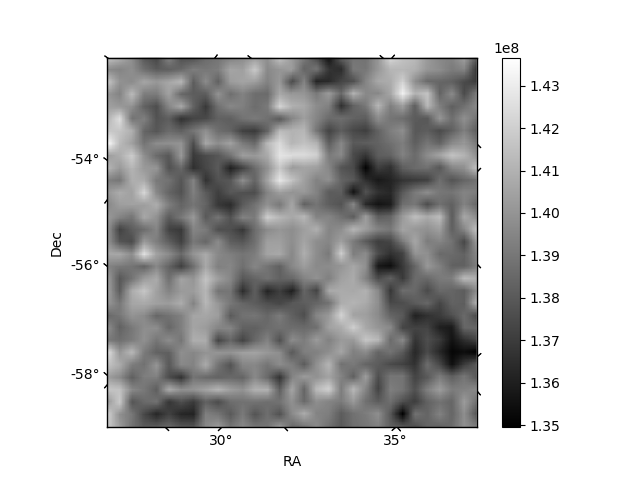
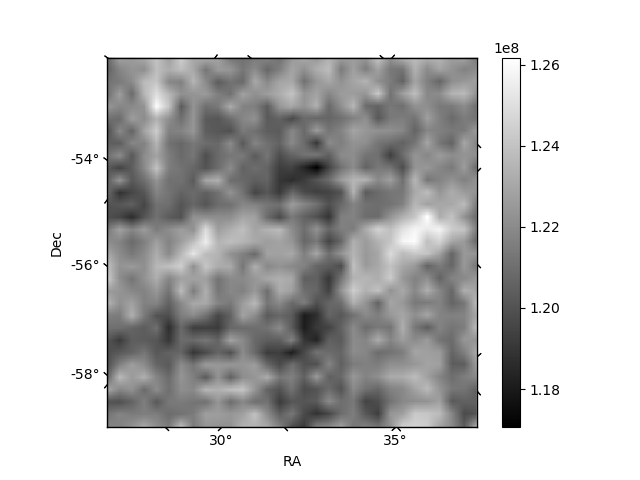
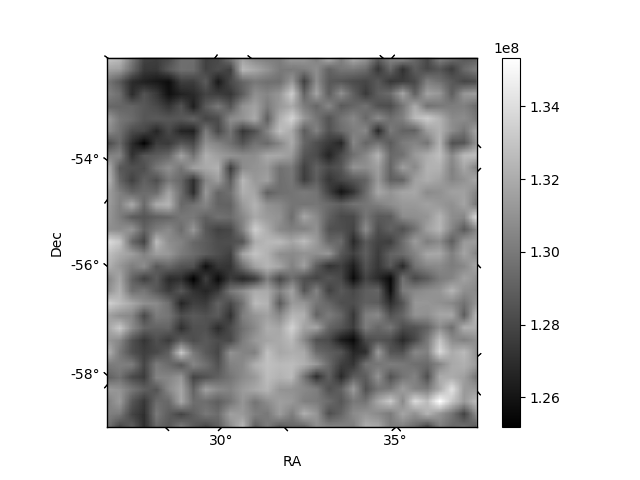
Histogram calculated using DETX and DETY for each event in the final _common_clean file
| Quadrant A | 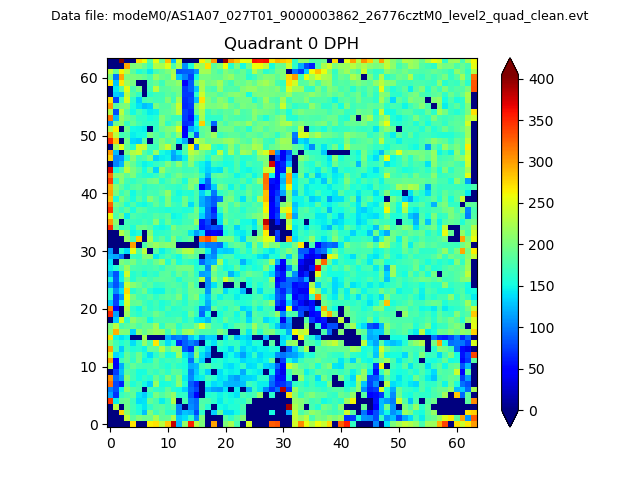 |
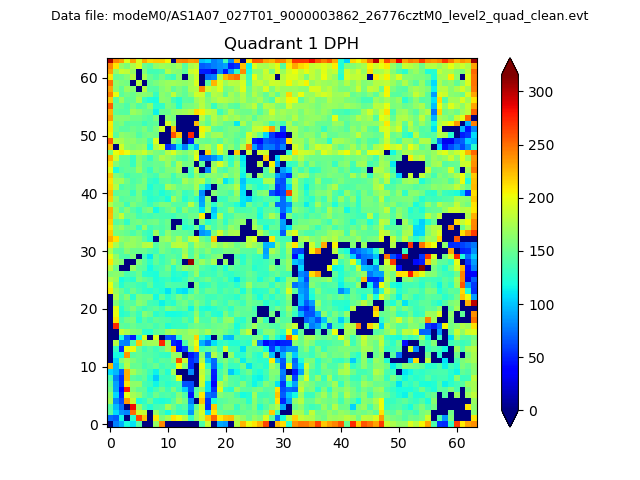 |
Quadrant B |
|---|---|---|---|
| Quadrant D | 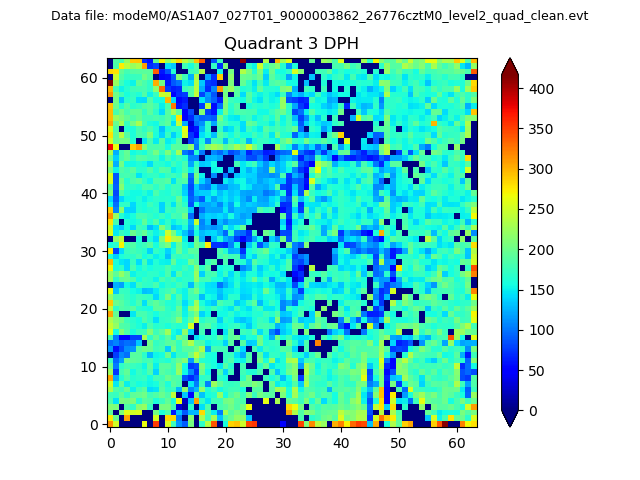 |
 |
Quadrant C |
| Plot type | Count rate plots | Images |
|---|---|---|
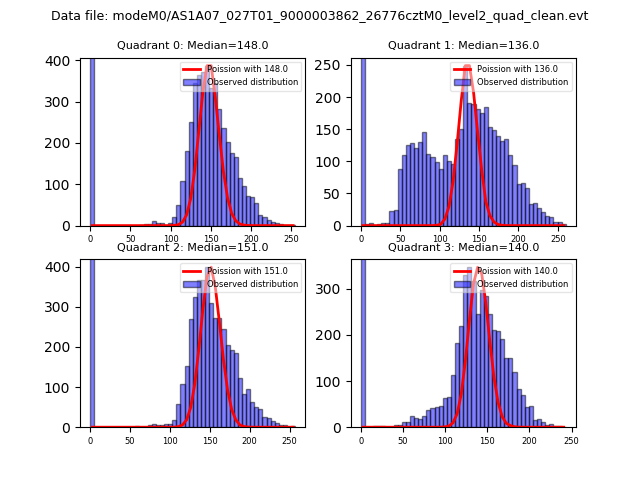
| Comparison with Poisson distribution Blue bars denote a histogram of data divided into 1 sec bins. Red curve is a Poisson curve with rate = median count rate of data. |
 |
 |
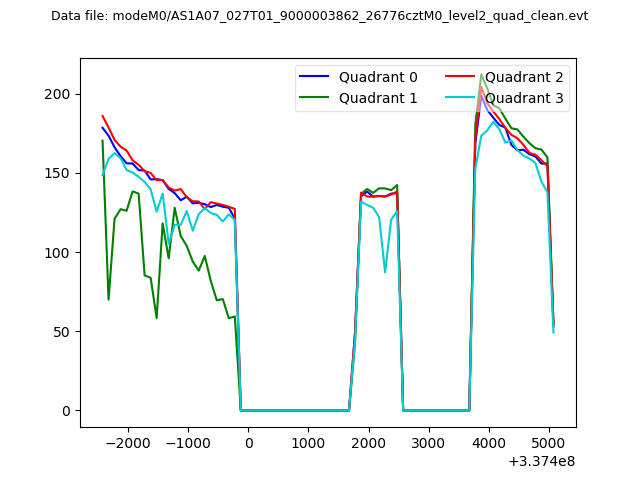
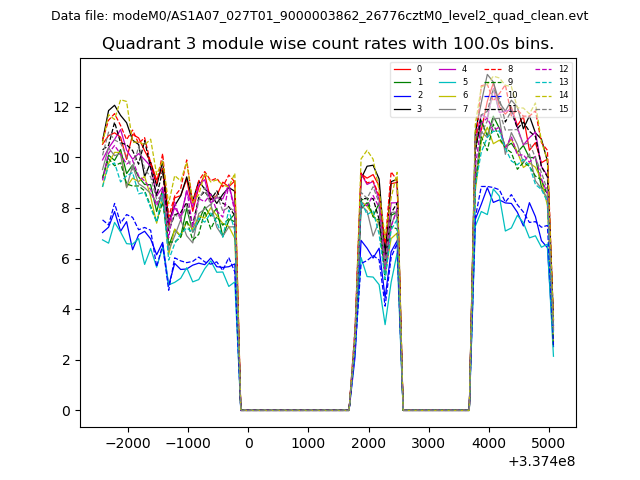
| Quadrant-wise count rates Data is divided into 100 sec bins |
 |
|
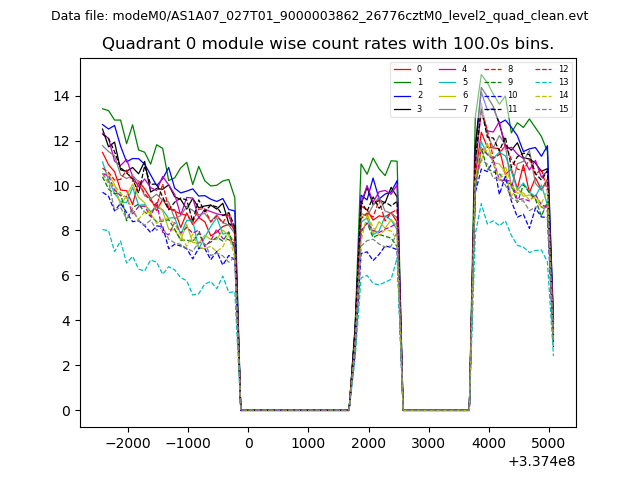
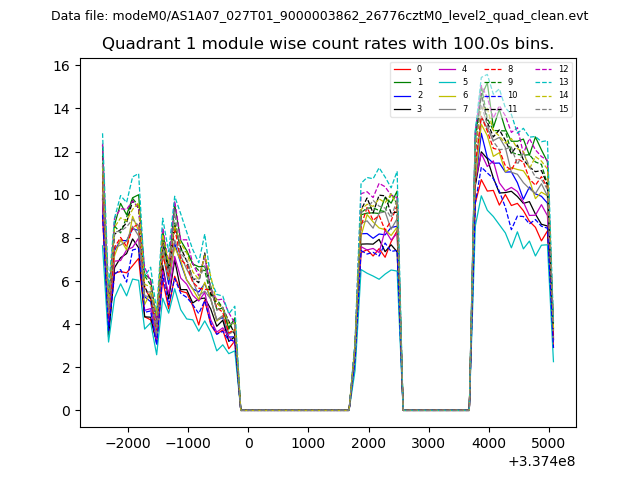
| Module-wise count rates for Quadrant A Data is divided into 100 sec bins |
 |
 |
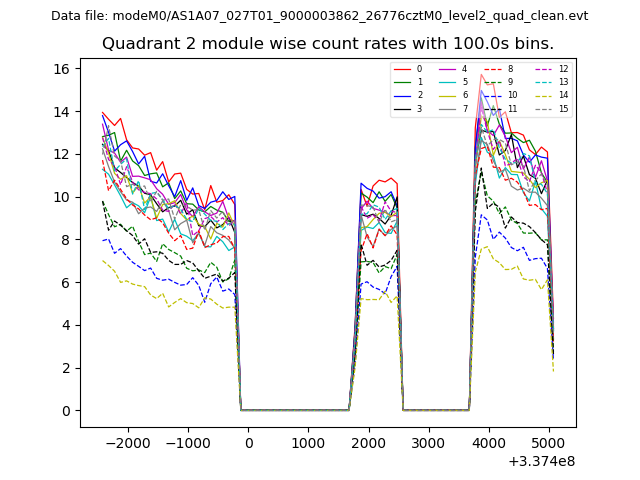
| Module-wise count rates for Quadrant B Data is divided into 100 sec bins |
 |
 |
| Module-wise count rates for Quadrant C Data is divided into 100 sec bins |
 |
 |
| Module-wise count rates for Quadrant D Data is divided into 100 sec bins |
 |
 |
| Parameter | Plot |
|---|---|
| CZT HV Monitor | 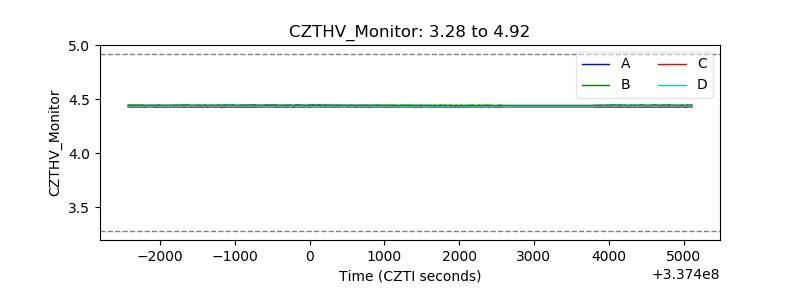 |
| D_VDD | 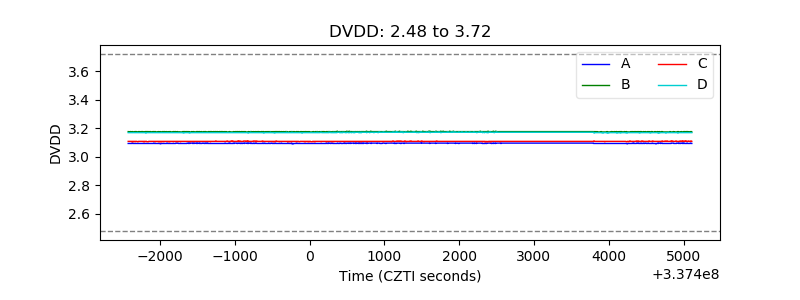 |
| Temperature 1 | 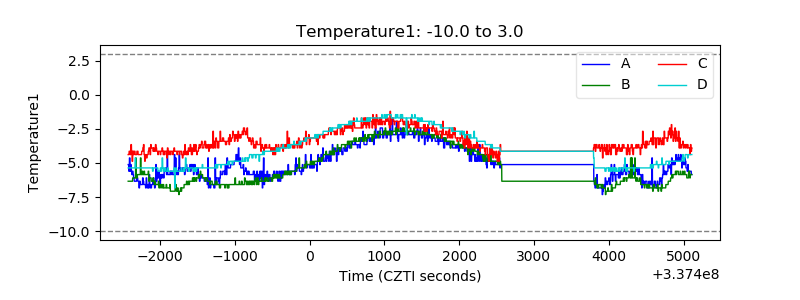 |
| Veto HV Monitor | 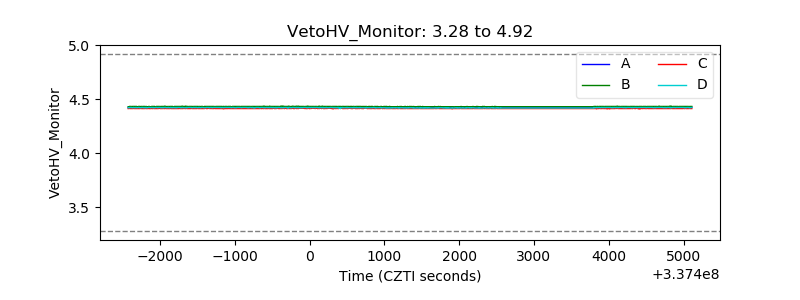 |
| Veto LLD | 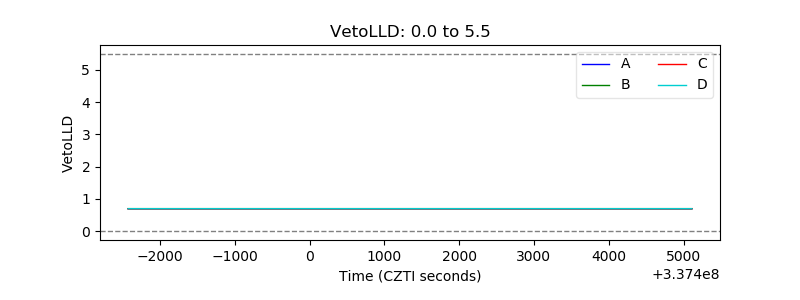 |
| Alpha Counter | 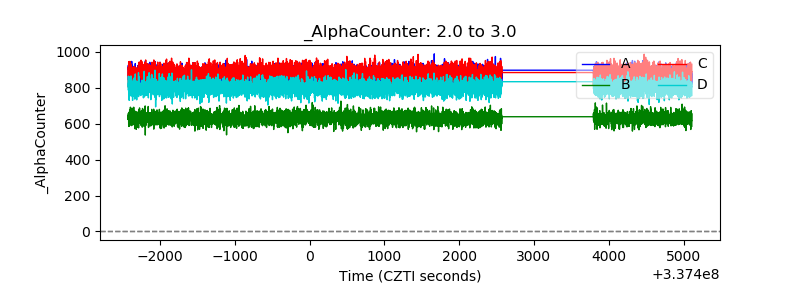 |
| _CPM_Rate | 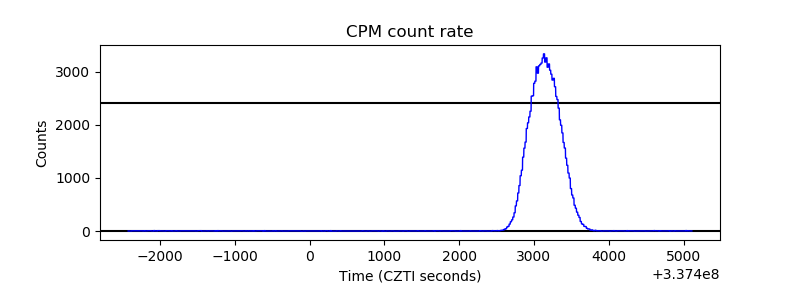 |
| CZT Counter | 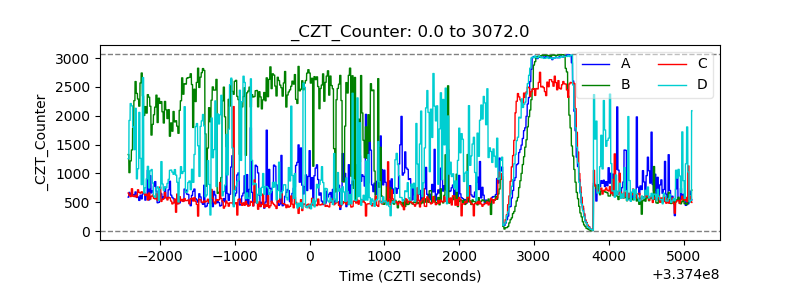 |
| +2.5 Volts monitor |  |
| +5 Volts monitor |  |
| _ROLL_ROT | 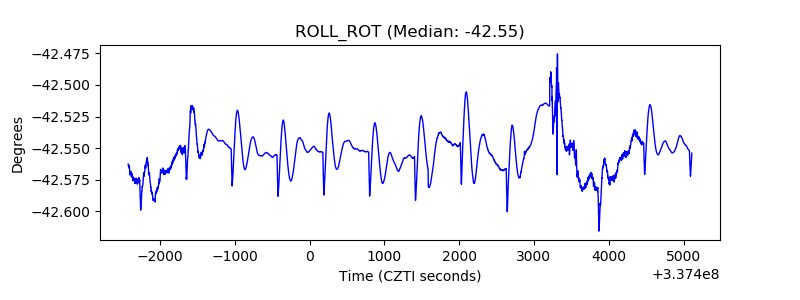 |
| _Roll_DEC | 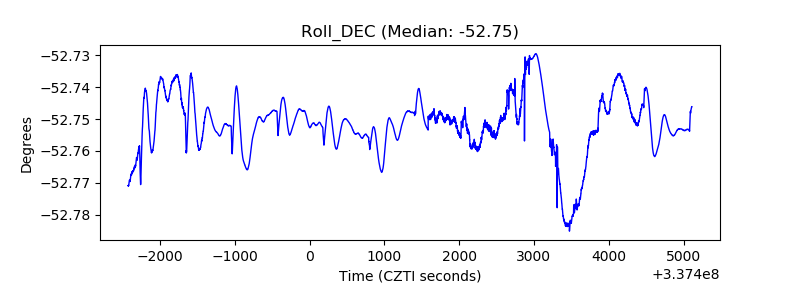 |
| _Roll_RA | 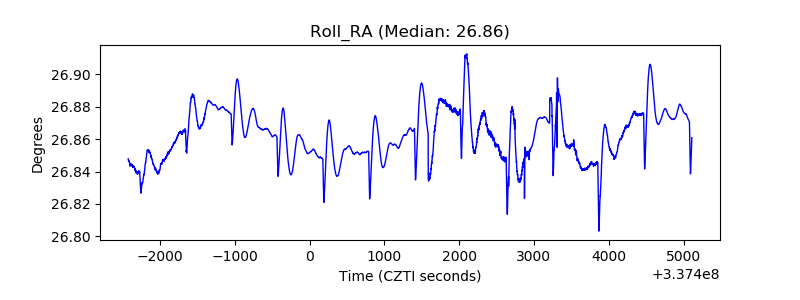 |
| Veto Counter | 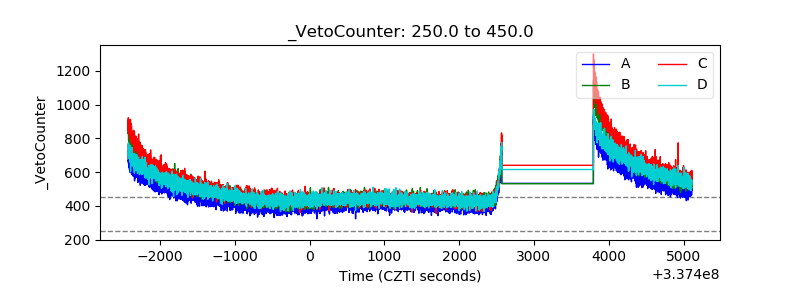 |