| Param | Original file | Final file |
|---|---|---|
| Filename | modeM0/AS1A07_027T01_9000003862_26777cztM0_level2.evt | modeM0/AS1A07_027T01_9000003862_26777cztM0_level2_quad_clean.evt |
| Size (bytes) | 644,100,480 | 107,328,960 |
| Size | 614.3 MB | 102.4 MB |
| Events in quadrant A | 4,155,958 | 708,620 |
| Events in quadrant B | 4,294,263 | 734,099 |
| Events in quadrant C | 4,310,736 | 712,135 |
| Events in quadrant D | 6,325,304 | 661,184 |
| Mode M0 | |||
|---|---|---|---|
| Quadrant | BADHDUFLAG | Total packets | Discarded packets |
| A | 0 | 16630 | 0 |
| B | 0 | 16676 | 0 |
| C | 0 | 16804 | 0 |
| D | 0 | 22939 | 0 |
| Mode M9 | |||
|---|---|---|---|
| Quadrant | BADHDUFLAG | Total packets | Discarded packets |
| A | 0 | 18 | 0 |
| B | 0 | 19 | 0 |
| C | 0 | 19 | 0 |
| D | 0 | 19 | 0 |
| Quadrant | Total seconds | Saturated seconds | Saturation percentage |
|---|---|---|---|
| A | 6225 | 40 | 0.642570% |
| B | 6225 | 391 | 6.281124% |
| C | 6225 | 371 | 5.959839% |
| D | 6225 | 650 | 10.441767% |
Noise dominated data is calculated using 1-second bins in cleaned event files. If a bin has >2000 counts, and if more than 50% of those come from <1% of pixels, then it is considered to be noise-dominated and hence unusable.
| Quadrant | # 1 sec bins | Bins with >0 counts | Bins with >2000 counts | High rate bins dominated by noise | Noise dominated (total time) | Noise dominated (detector-on time) | Marked lightcurve |
|---|---|---|---|---|---|---|---|
| A | 7525 | 6226 | 8 | 8 | 0.11% | 0.13% | 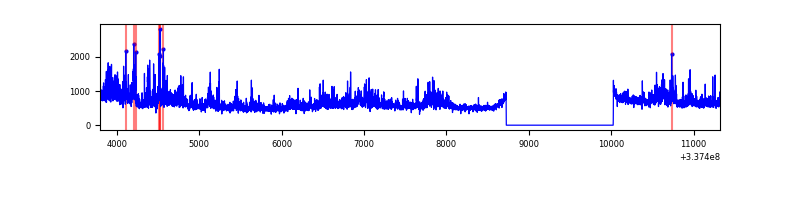 |
| B | 7525 | 6226 | 276 | 276 | 3.67% | 4.43% | 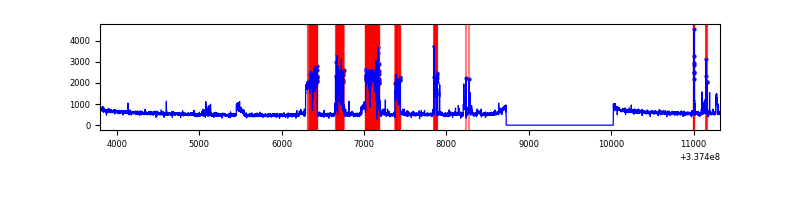 |
| C | 7525 | 6226 | 202 | 202 | 2.68% | 3.24% | 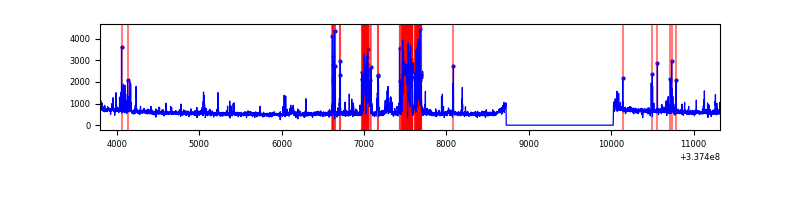 |
| D | 7525 | 6226 | 544 | 544 | 7.23% | 8.74% | 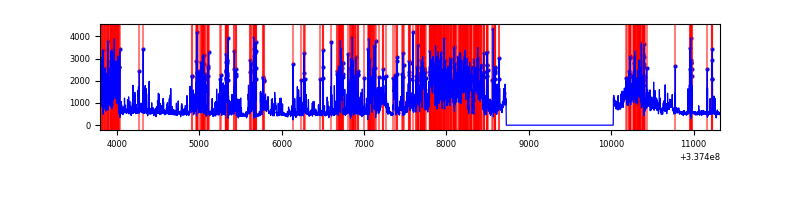 |
Top three noisy pixels from each quadrant. If the there are fewer than three noisy pixels in the level2.evt file, extra rows are filled as -1
| Pixel properties | Quadrant properties | ||||||
|---|---|---|---|---|---|---|---|
| Quadrant | DetID | PixID | Counts | Sigma | Mean | Median | Sigma |
| A | 0 | 13 | 860064 | 5086.98 | 854 | 839 | 168.9 |
| A | 13 | 254 | 10695 | 58.35 | 854 | 839 | 168.9 |
| A | 0 | 226 | 7408 | 38.89 | 854 | 839 | 168.9 |
| B | 0 | 189 | 977733 | 6282.43 | 842 | 820 | 155.5 |
| B | 0 | 190 | 27385 | 170.83 | 842 | 820 | 155.5 |
| B | 12 | 111 | 18184 | 111.66 | 842 | 820 | 155.5 |
| C | 2 | 16 | 884710 | 4577.9 | 835 | 842 | 193.1 |
| C | 14 | 238 | 134082 | 690.1 | 835 | 842 | 193.1 |
| C | 10 | 22 | 17153 | 84.48 | 835 | 842 | 193.1 |
| D | 7 | 80 | 1787555 | 9163.88 | 829 | 809 | 195.0 |
| D | 1 | 52 | 940211 | 4818.01 | 829 | 809 | 195.0 |
| D | 15 | 21 | 330808 | 1692.5 | 829 | 809 | 195.0 |
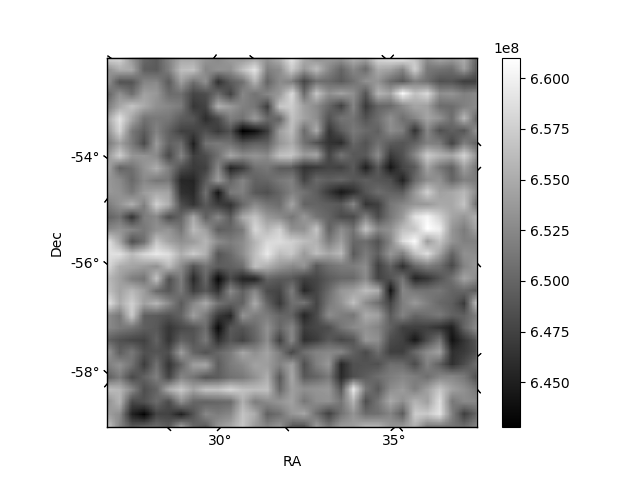
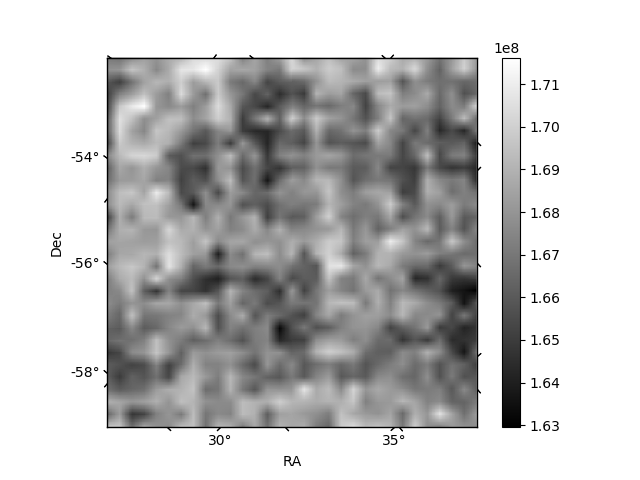
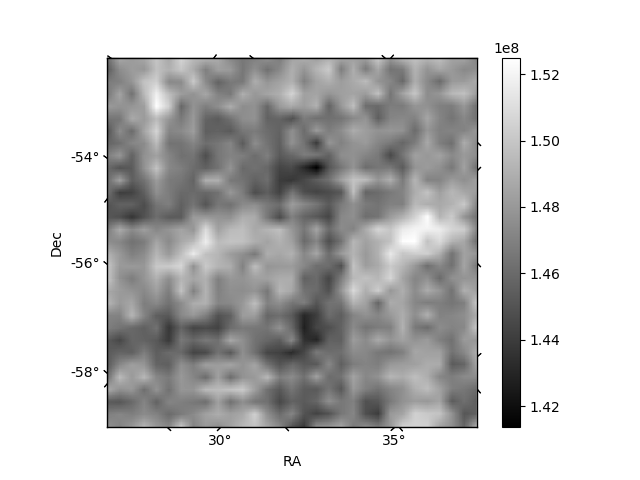
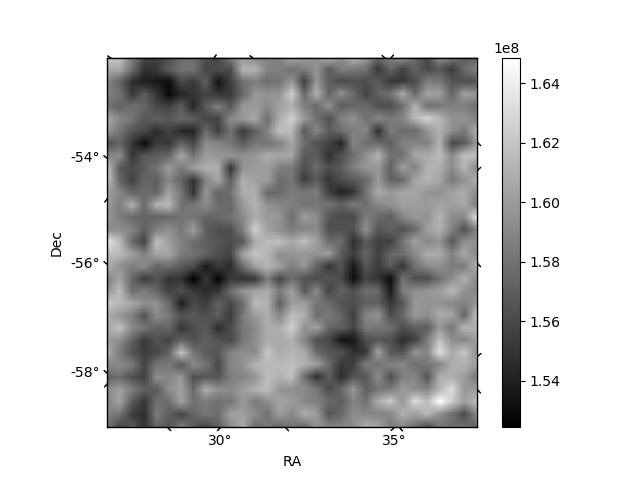
Histogram calculated using DETX and DETY for each event in the final _common_clean file
| Quadrant A | 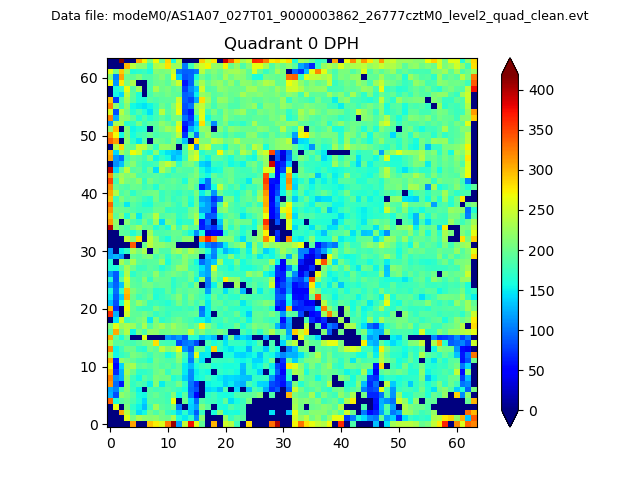 |
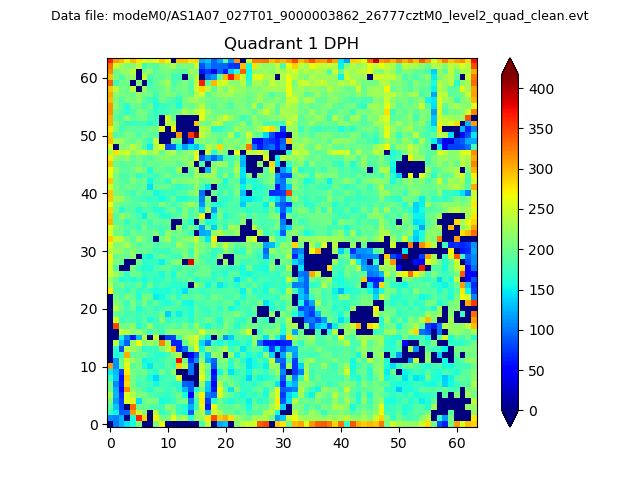 |
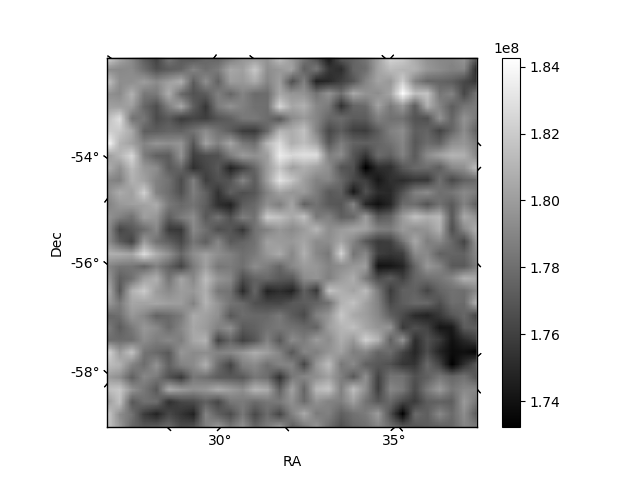
Quadrant B |
|---|---|---|---|
| Quadrant D | 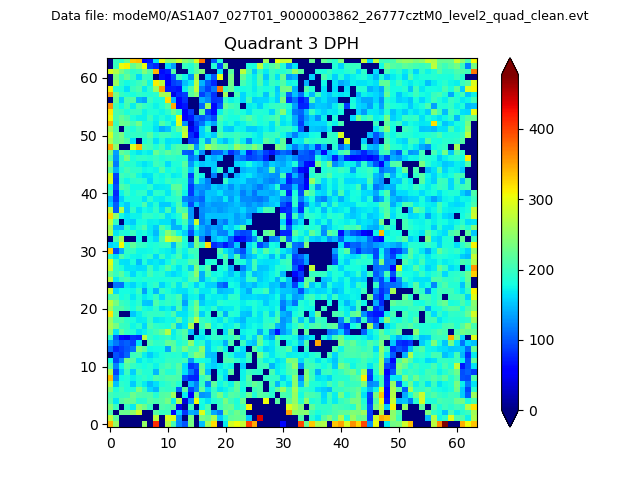 |
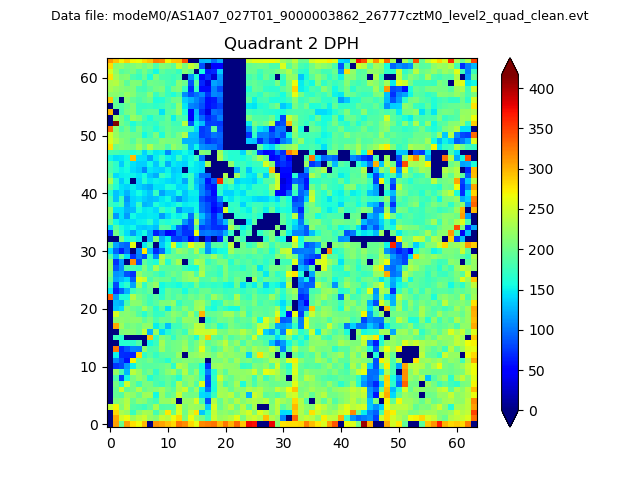 |
Quadrant C |
| Plot type | Count rate plots | Images |
|---|---|---|
| Comparison with Poisson distribution Blue bars denote a histogram of data divided into 1 sec bins. Red curve is a Poisson curve with rate = median count rate of data. |
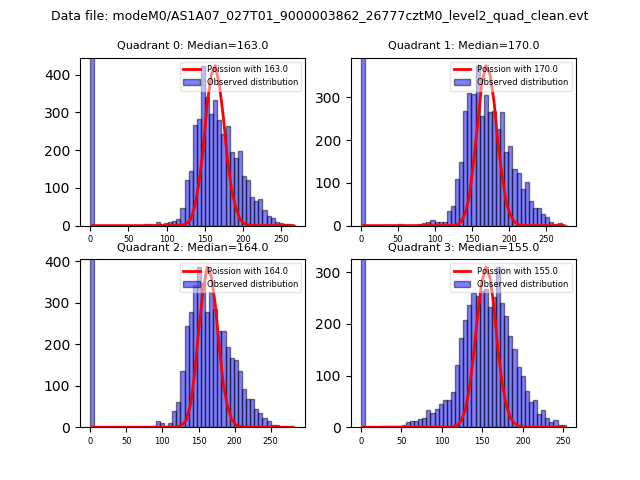 |
 |
| Quadrant-wise count rates Data is divided into 100 sec bins |
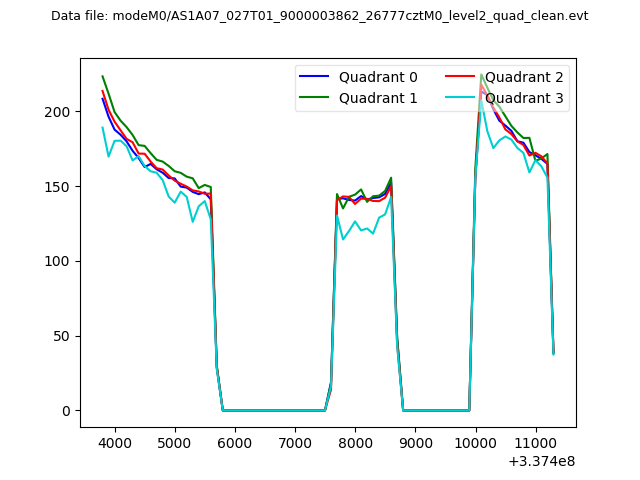 |
|
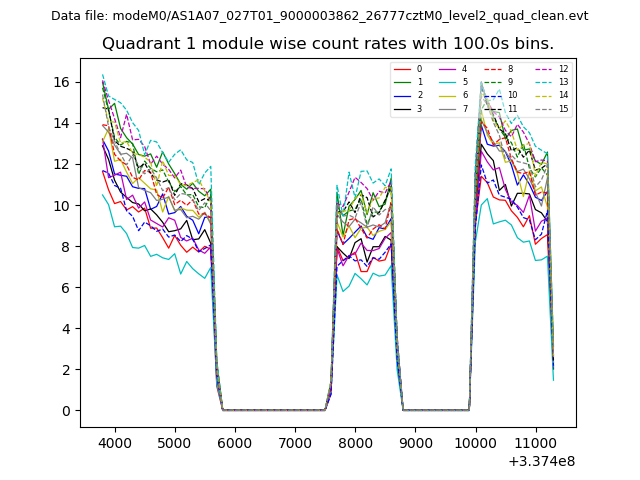
| Module-wise count rates for Quadrant A Data is divided into 100 sec bins |
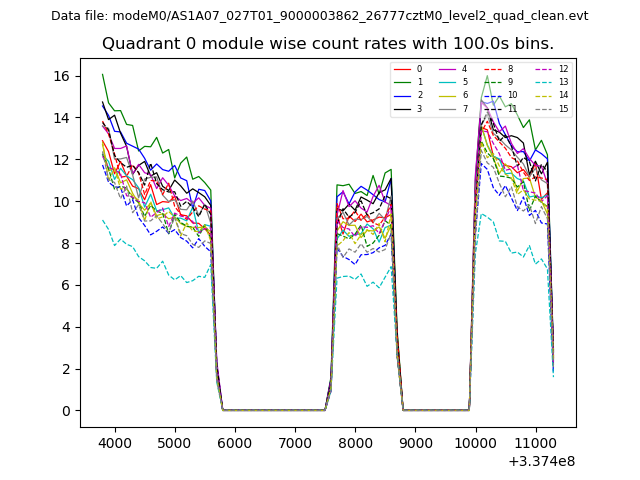 |
 |
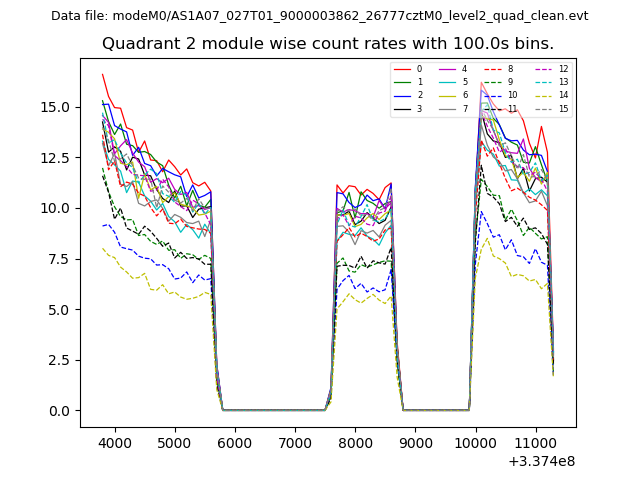
| Module-wise count rates for Quadrant B Data is divided into 100 sec bins |
 |
 |
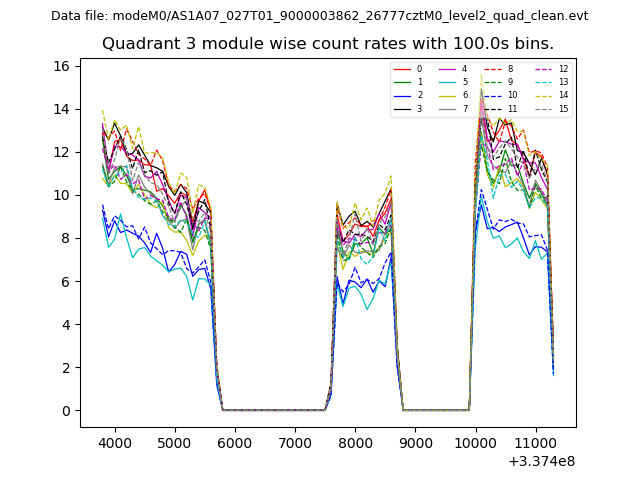
| Module-wise count rates for Quadrant C Data is divided into 100 sec bins |
 |
 |
| Module-wise count rates for Quadrant D Data is divided into 100 sec bins |
 |
 |
| Parameter | Plot |
|---|---|
| CZT HV Monitor | 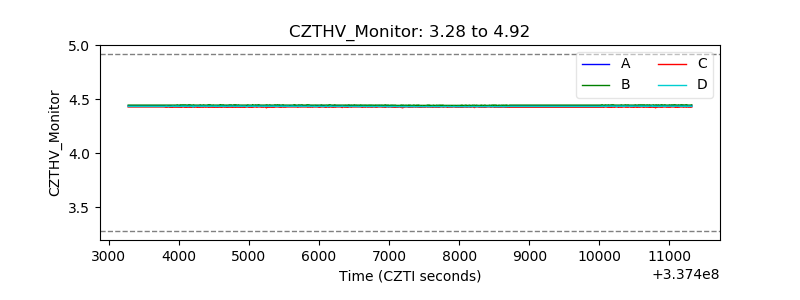 |
| D_VDD | 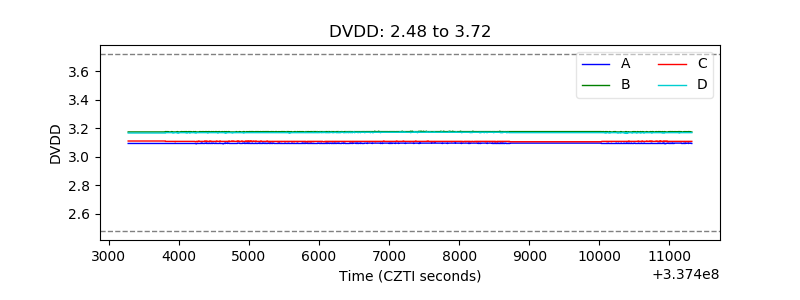 |
| Temperature 1 | 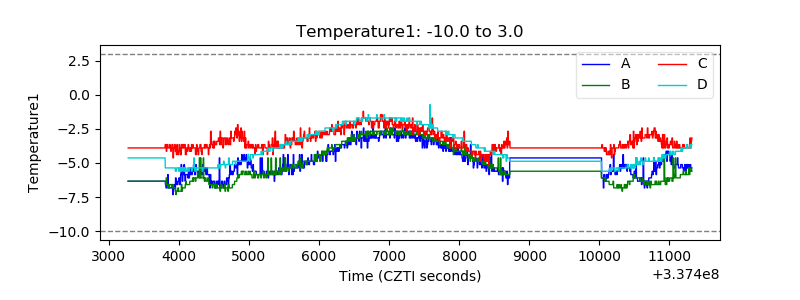 |
| Veto HV Monitor | 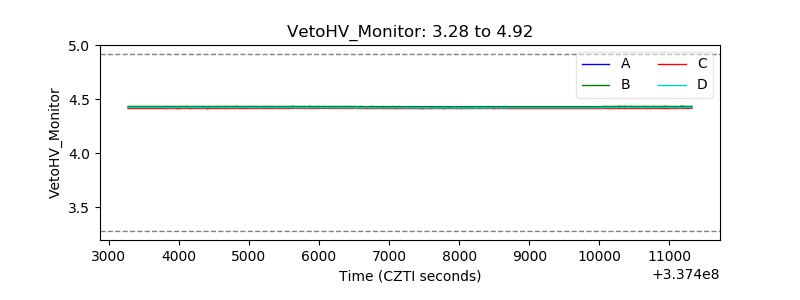 |
| Veto LLD | 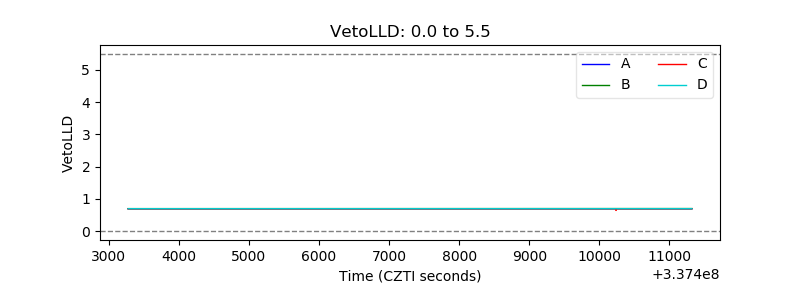 |
| Alpha Counter | 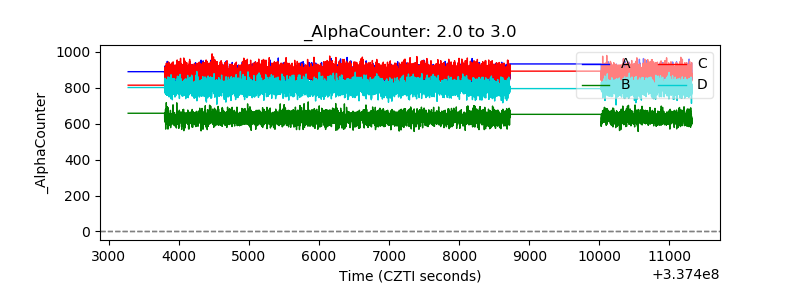 |
| _CPM_Rate | 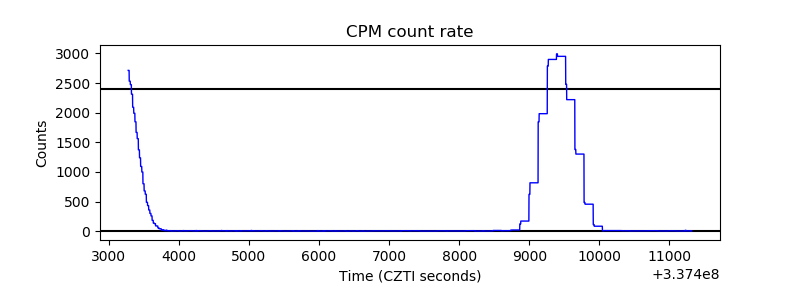 |
| CZT Counter | 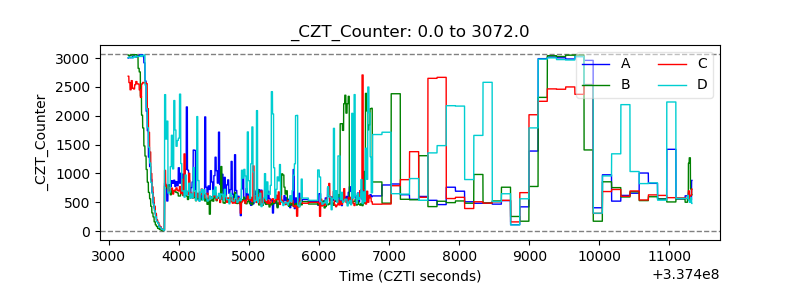 |
| +2.5 Volts monitor | 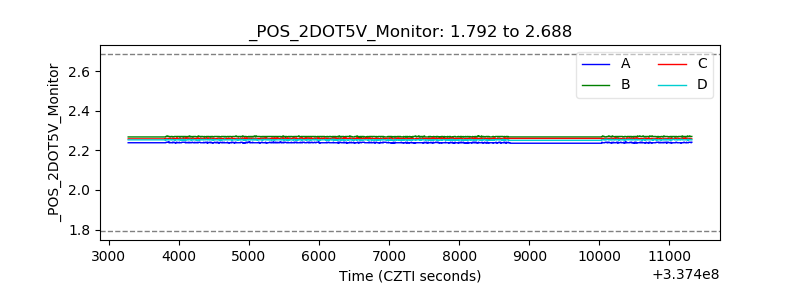 |
| +5 Volts monitor | 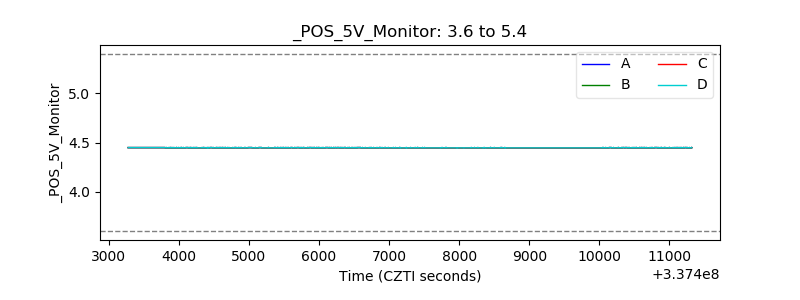 |
| _ROLL_ROT | 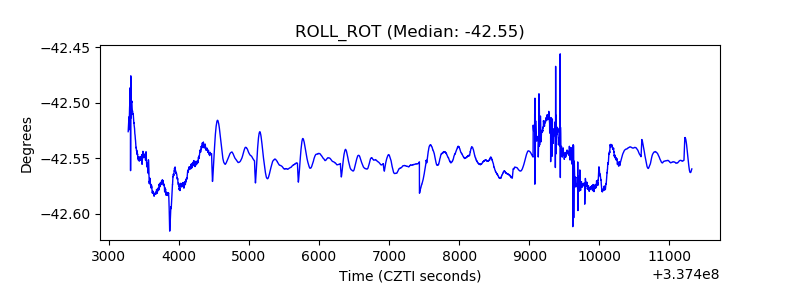 |
| _Roll_DEC | 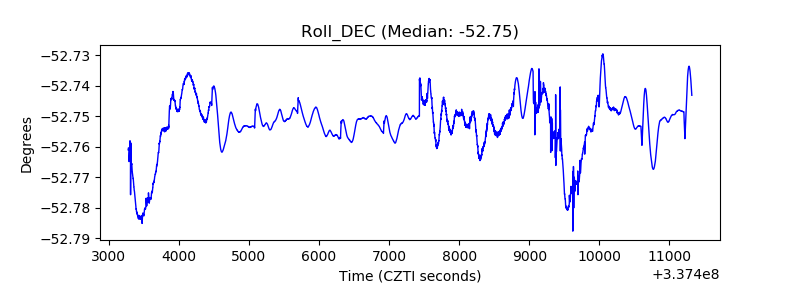 |
| _Roll_RA | 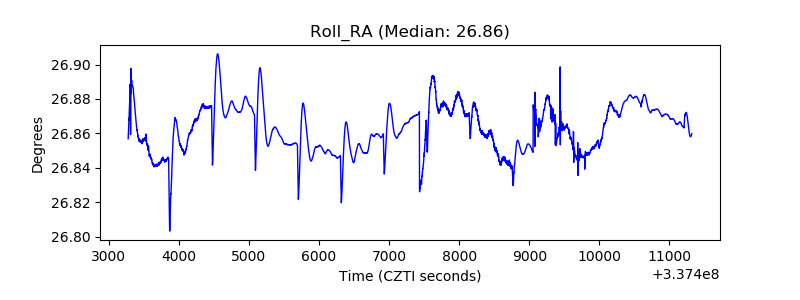 |
| Veto Counter | 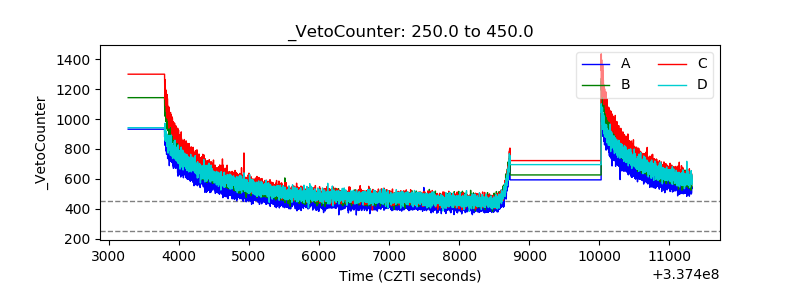 |