| Param | Original file | Final file |
|---|---|---|
| Filename | modeM0/AS1A07_027T01_9000003862_26778cztM0_level2.evt | modeM0/AS1A07_027T01_9000003862_26778cztM0_level2_quad_clean.evt |
| Size (bytes) | 670,386,240 | 104,996,160 |
| Size | 639.3 MB | 100.1 MB |
| Events in quadrant A | 4,320,906 | 698,890 |
| Events in quadrant B | 4,439,557 | 706,437 |
| Events in quadrant C | 3,830,035 | 696,608 |
| Events in quadrant D | 7,293,674 | 644,730 |
| Mode M0 | |||
|---|---|---|---|
| Quadrant | BADHDUFLAG | Total packets | Discarded packets |
| A | 0 | 17218 | 0 |
| B | 0 | 17117 | 0 |
| C | 0 | 15358 | 0 |
| D | 0 | 25897 | 0 |
| Mode M9 | |||
|---|---|---|---|
| Quadrant | BADHDUFLAG | Total packets | Discarded packets |
| A | 0 | 14 | 0 |
| B | 0 | 15 | 0 |
| C | 0 | 15 | 0 |
| D | 0 | 15 | 0 |
| Quadrant | Total seconds | Saturated seconds | Saturation percentage |
|---|---|---|---|
| A | 6202 | 85 | 1.370526% |
| B | 6202 | 398 | 6.417285% |
| C | 6202 | 178 | 2.870042% |
| D | 6202 | 985 | 15.881974% |
Noise dominated data is calculated using 1-second bins in cleaned event files. If a bin has >2000 counts, and if more than 50% of those come from <1% of pixels, then it is considered to be noise-dominated and hence unusable.
| Quadrant | # 1 sec bins | Bins with >0 counts | Bins with >2000 counts | High rate bins dominated by noise | Noise dominated (total time) | Noise dominated (detector-on time) | Marked lightcurve |
|---|---|---|---|---|---|---|---|
| A | 7547 | 6204 | 8 | 8 | 0.11% | 0.13% | 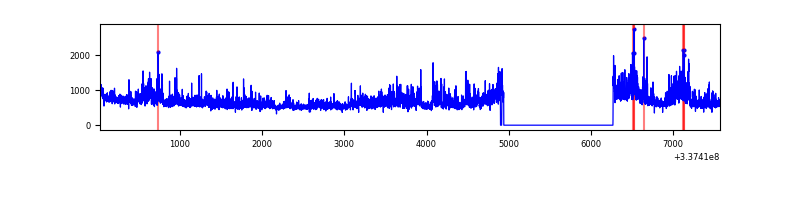 |
| B | 7547 | 6204 | 258 | 258 | 3.42% | 4.16% | 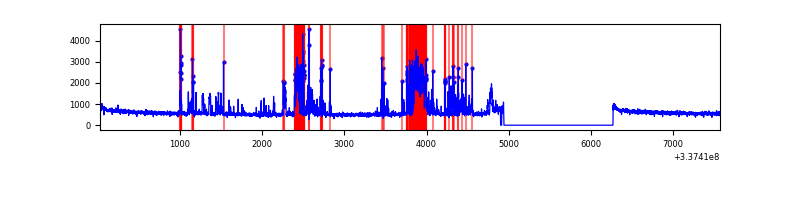 |
| C | 7547 | 6204 | 31 | 31 | 0.41% | 0.50% | 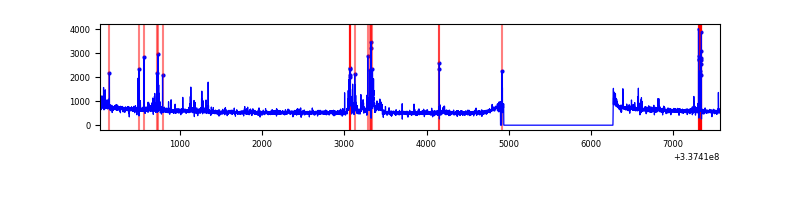 |
| D | 7547 | 6204 | 778 | 778 | 10.31% | 12.54% | 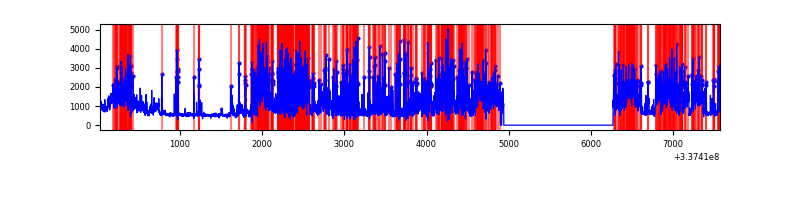 |
Top three noisy pixels from each quadrant. If the there are fewer than three noisy pixels in the level2.evt file, extra rows are filled as -1
| Pixel properties | Quadrant properties | ||||||
|---|---|---|---|---|---|---|---|
| Quadrant | DetID | PixID | Counts | Sigma | Mean | Median | Sigma |
| A | 0 | 13 | 931910 | 5448.34 | 878 | 864 | 170.9 |
| A | 13 | 254 | 10161 | 54.4 | 878 | 864 | 170.9 |
| A | 0 | 226 | 7467 | 38.64 | 878 | 864 | 170.9 |
| B | 0 | 189 | 1074045 | 6893.67 | 854 | 835 | 155.7 |
| B | 0 | 190 | 22171 | 137.05 | 854 | 835 | 155.7 |
| B | 12 | 111 | 17938 | 109.86 | 854 | 835 | 155.7 |
| C | 15 | 208 | 152913 | 768.99 | 866 | 875 | 197.7 |
| C | 14 | 238 | 140709 | 707.26 | 866 | 875 | 197.7 |
| C | 2 | 16 | 132558 | 666.03 | 866 | 875 | 197.7 |
| D | 7 | 80 | 3281529 | 16846.7 | 829 | 813 | 194.7 |
| D | 15 | 21 | 378464 | 1939.26 | 829 | 813 | 194.7 |
| D | 1 | 52 | 314999 | 1613.36 | 829 | 813 | 194.7 |
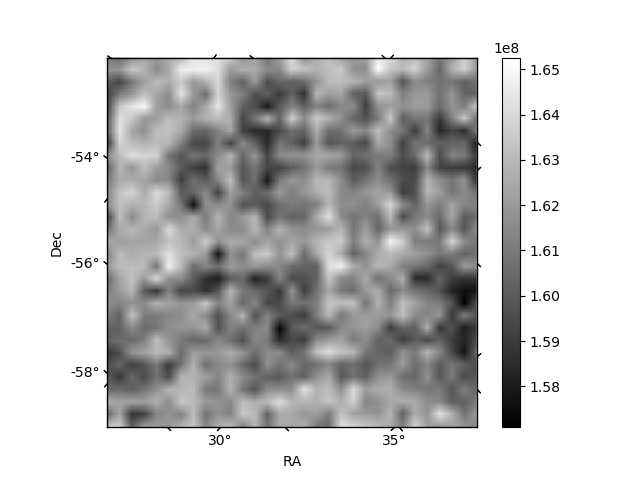
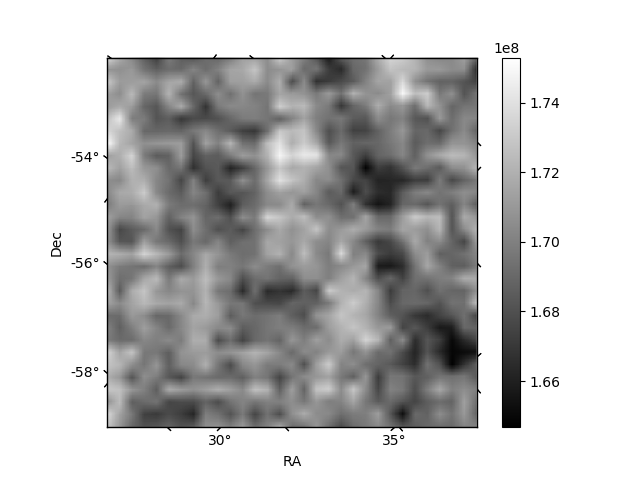
Histogram calculated using DETX and DETY for each event in the final _common_clean file
| Quadrant A | 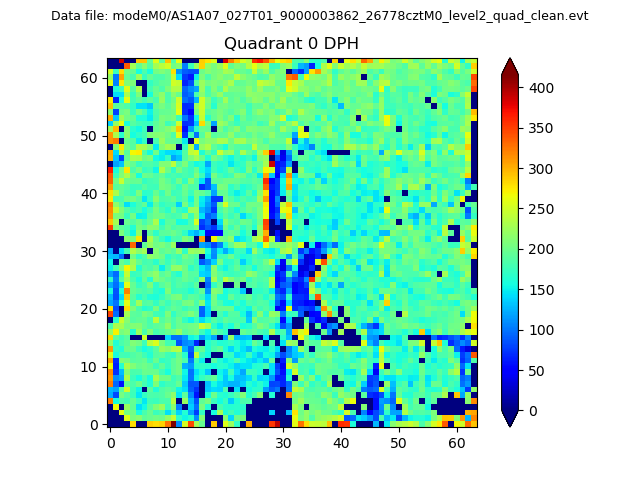 |
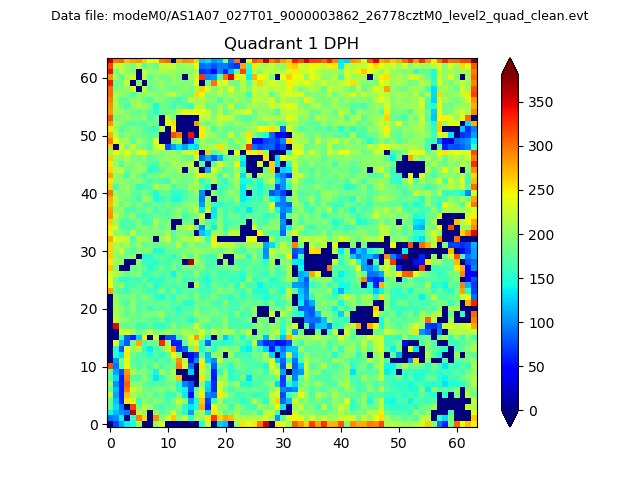 |
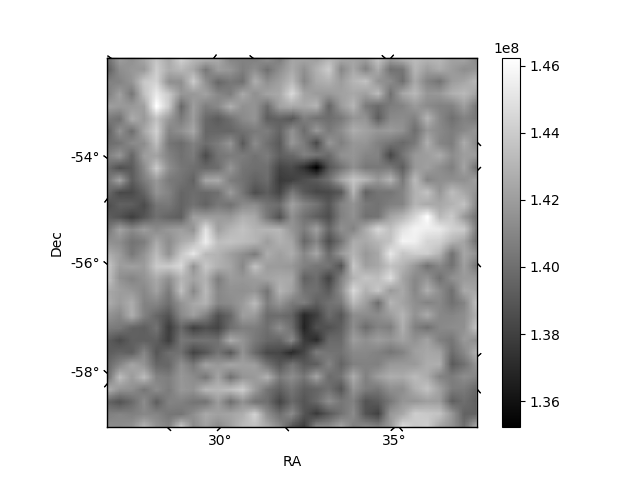
Quadrant B |
|---|---|---|---|
| Quadrant D | 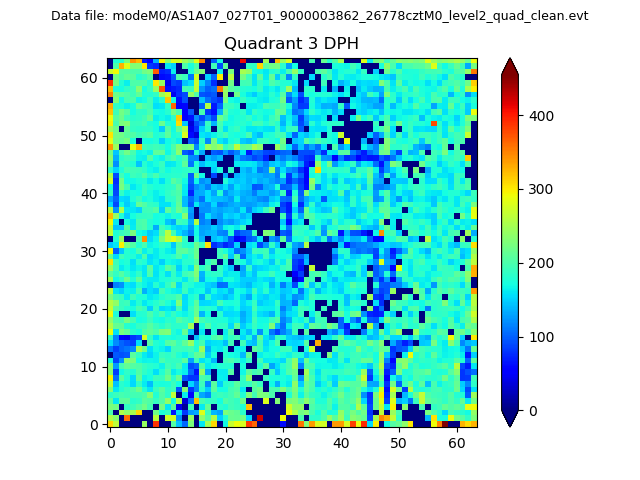 |
 |
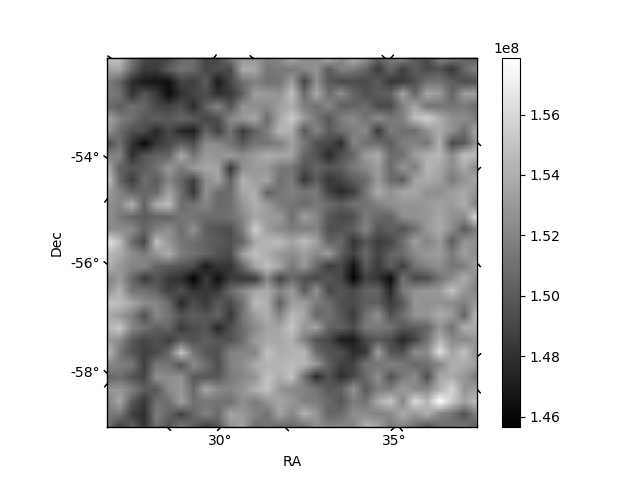
Quadrant C |
| Plot type | Count rate plots | Images |
|---|---|---|
| Comparison with Poisson distribution Blue bars denote a histogram of data divided into 1 sec bins. Red curve is a Poisson curve with rate = median count rate of data. |
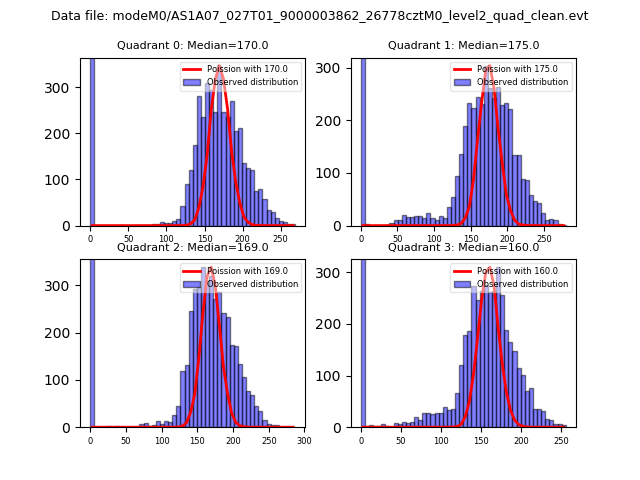 |
 |
| Quadrant-wise count rates Data is divided into 100 sec bins |
 |
|
| Module-wise count rates for Quadrant A Data is divided into 100 sec bins |
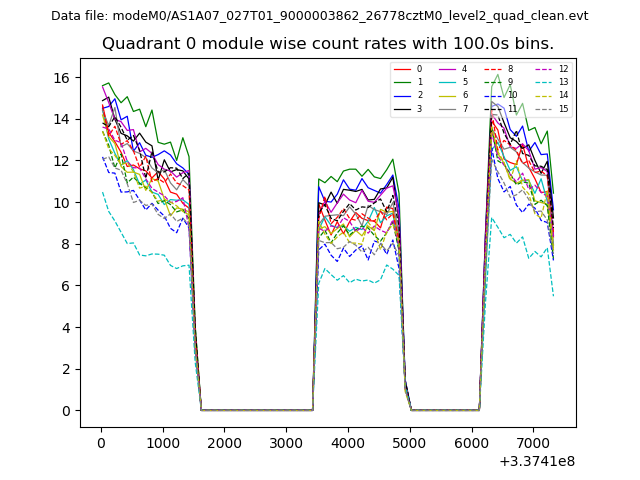 |
 |
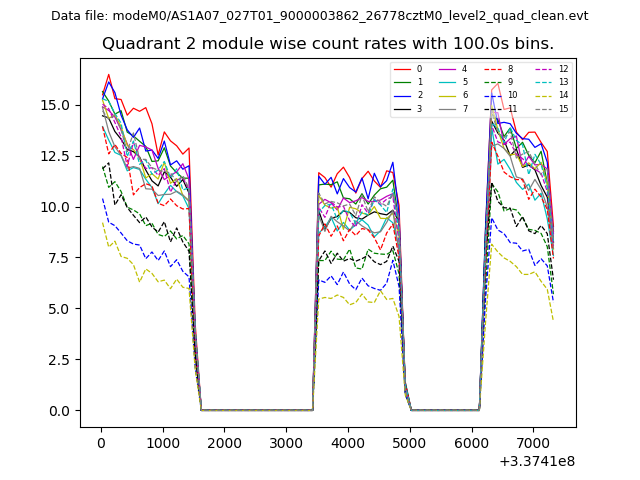
| Module-wise count rates for Quadrant B Data is divided into 100 sec bins |
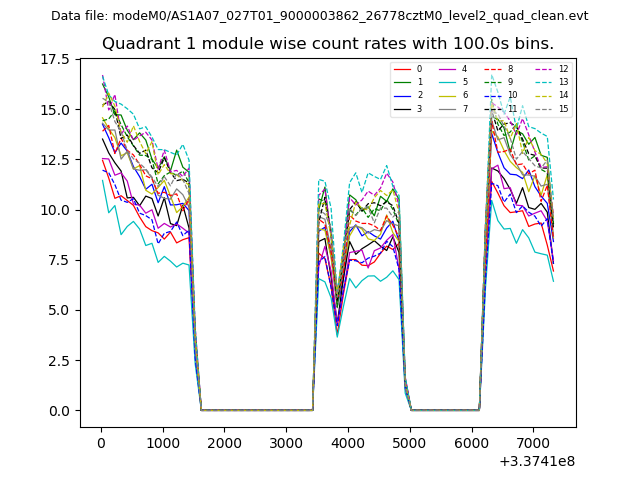 |
 |
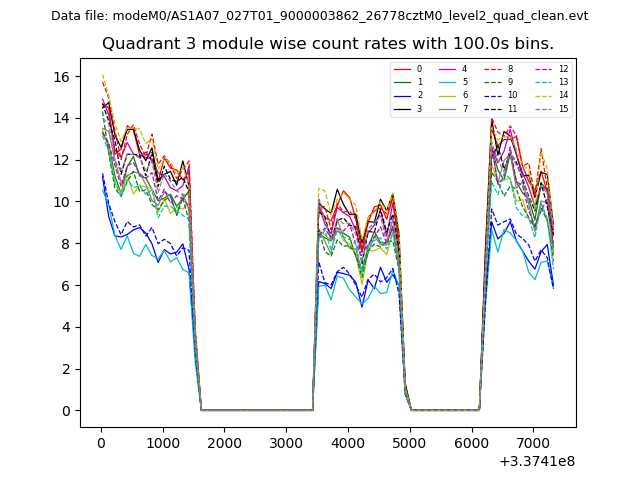
| Module-wise count rates for Quadrant C Data is divided into 100 sec bins |
 |
 |
| Module-wise count rates for Quadrant D Data is divided into 100 sec bins |
 |
 |
| Parameter | Plot |
|---|---|
| CZT HV Monitor | 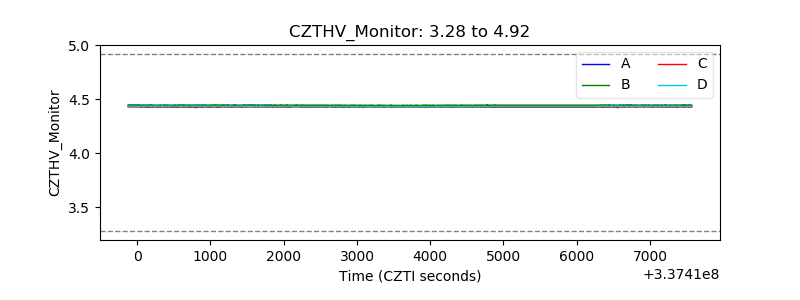 |
| D_VDD | 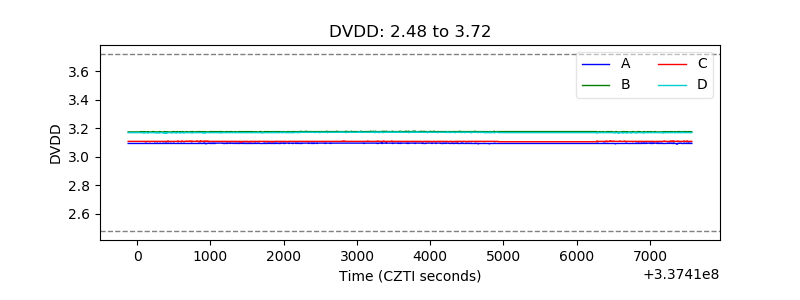 |
| Temperature 1 | 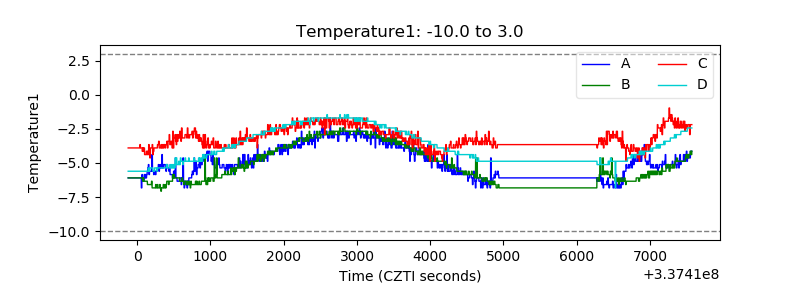 |
| Veto HV Monitor | 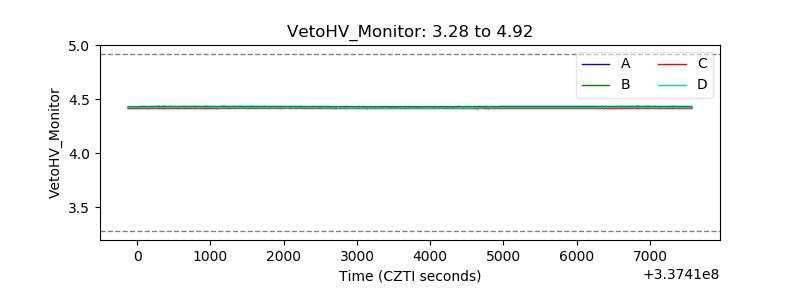 |
| Veto LLD | 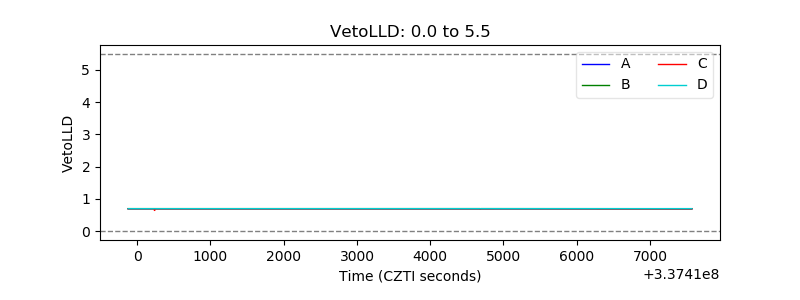 |
| Alpha Counter | 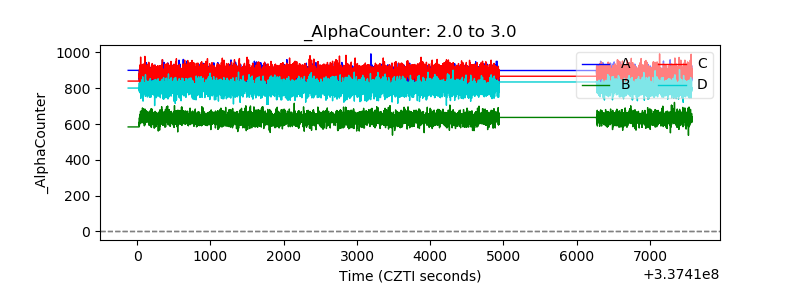 |
| _CPM_Rate | 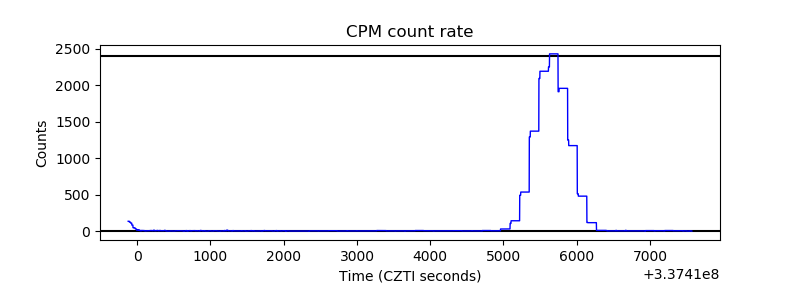 |
| CZT Counter | 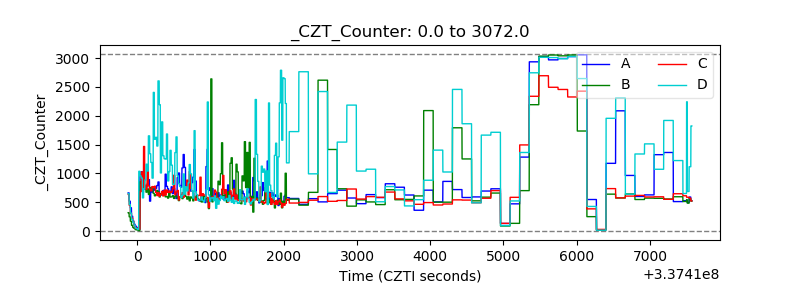 |
| +2.5 Volts monitor |  |
| +5 Volts monitor |  |
| _ROLL_ROT | 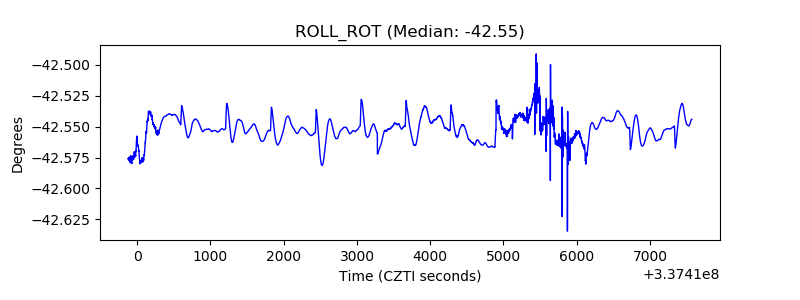 |
| _Roll_DEC | 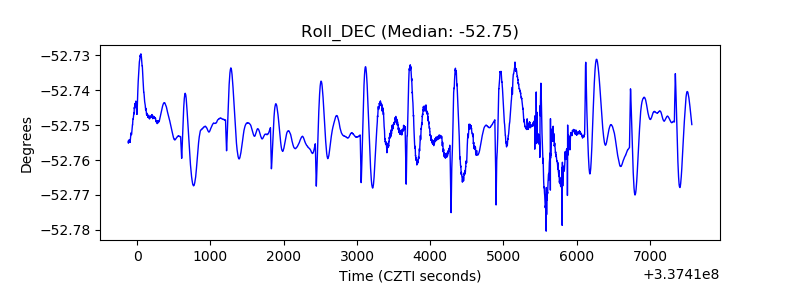 |
| _Roll_RA |  |
| Veto Counter | 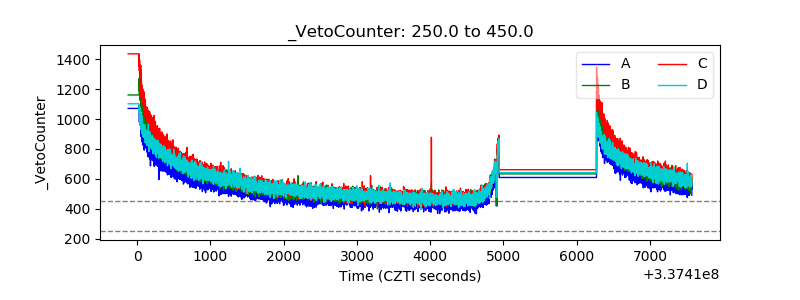 |