| Param | Original file | Final file |
|---|---|---|
| Filename | modeM0/AS1A07_027T01_9000003862_26779cztM0_level2.evt | modeM0/AS1A07_027T01_9000003862_26779cztM0_level2_quad_clean.evt |
| Size (bytes) | 1,093,561,920 | 146,027,520 |
| Size | 1.0 GB | 139.3 MB |
| Events in quadrant A | 6,795,390 | 947,559 |
| Events in quadrant B | 7,344,018 | 953,331 |
| Events in quadrant C | 6,002,116 | 939,281 |
| Events in quadrant D | 12,277,621 | 862,231 |
| Mode M0 | |||
|---|---|---|---|
| Quadrant | BADHDUFLAG | Total packets | Discarded packets |
| A | 0 | 27233 | 0 |
| B | 0 | 28054 | 0 |
| C | 0 | 23987 | 0 |
| D | 0 | 43634 | 0 |
| Mode M9 | |||
|---|---|---|---|
| Quadrant | BADHDUFLAG | Total packets | Discarded packets |
| A | 0 | 26 | 0 |
| B | 0 | 26 | 0 |
| C | 0 | 26 | 0 |
| D | 0 | 26 | 0 |
| Quadrant | Total seconds | Saturated seconds | Saturation percentage |
|---|---|---|---|
| A | 10389 | 165 | 1.588218% |
| B | 10389 | 727 | 6.997786% |
| C | 10389 | 269 | 2.589277% |
| D | 10389 | 1706 | 16.421215% |
Noise dominated data is calculated using 1-second bins in cleaned event files. If a bin has >2000 counts, and if more than 50% of those come from <1% of pixels, then it is considered to be noise-dominated and hence unusable.
| Quadrant | # 1 sec bins | Bins with >0 counts | Bins with >2000 counts | High rate bins dominated by noise | Noise dominated (total time) | Noise dominated (detector-on time) | Marked lightcurve |
|---|---|---|---|---|---|---|---|
| A | 13034 | 10392 | 7 | 7 | 0.05% | 0.07% | 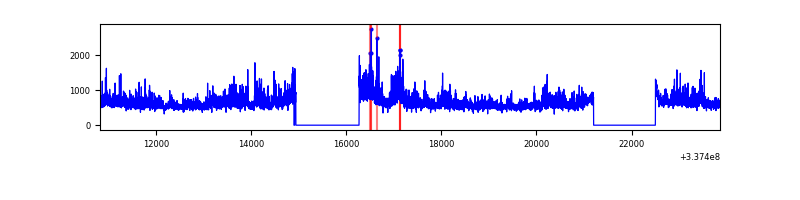 |
| B | 13034 | 10392 | 464 | 464 | 3.56% | 4.46% | 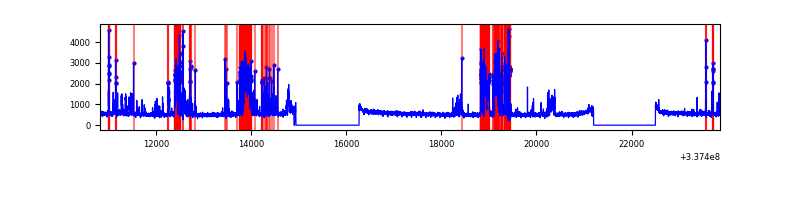 |
| C | 13034 | 10392 | 26 | 26 | 0.20% | 0.25% | 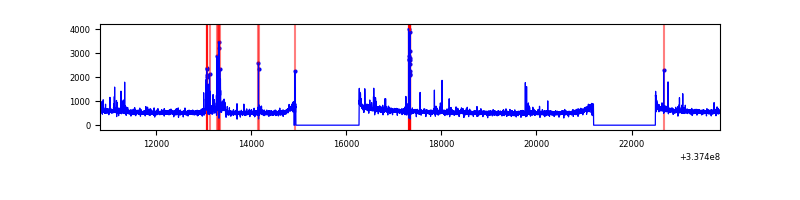 |
| D | 13034 | 10392 | 1286 | 1286 | 9.87% | 12.37% | 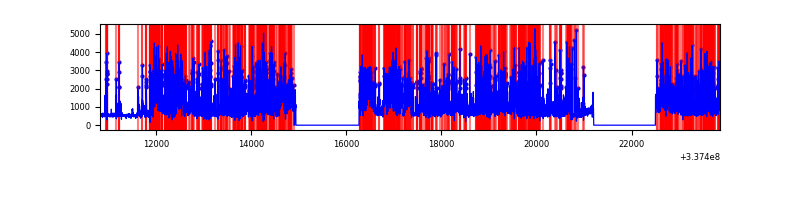 |
Top three noisy pixels from each quadrant. If the there are fewer than three noisy pixels in the level2.evt file, extra rows are filled as -1
| Pixel properties | Quadrant properties | ||||||
|---|---|---|---|---|---|---|---|
| Quadrant | DetID | PixID | Counts | Sigma | Mean | Median | Sigma |
| A | 0 | 13 | 1267160 | 4483.89 | 1434 | 1408 | 282.3 |
| A | 13 | 254 | 16796 | 54.51 | 1434 | 1408 | 282.3 |
| A | 0 | 226 | 12277 | 38.5 | 1434 | 1408 | 282.3 |
| B | 0 | 189 | 1873635 | 7375.42 | 1385 | 1352 | 253.9 |
| B | 0 | 190 | 33024 | 124.76 | 1385 | 1352 | 253.9 |
| B | 12 | 111 | 29837 | 112.21 | 1385 | 1352 | 253.9 |
| C | 14 | 238 | 226765 | 709.32 | 1396 | 1411 | 317.7 |
| C | 15 | 208 | 171309 | 534.77 | 1396 | 1411 | 317.7 |
| C | 2 | 16 | 125738 | 391.33 | 1396 | 1411 | 317.7 |
| D | 7 | 80 | 5453546 | 17294.61 | 1340 | 1312 | 315.3 |
| D | 1 | 52 | 1070532 | 3391.59 | 1340 | 1312 | 315.3 |
| D | 1 | 239 | 315336 | 996.09 | 1340 | 1312 | 315.3 |
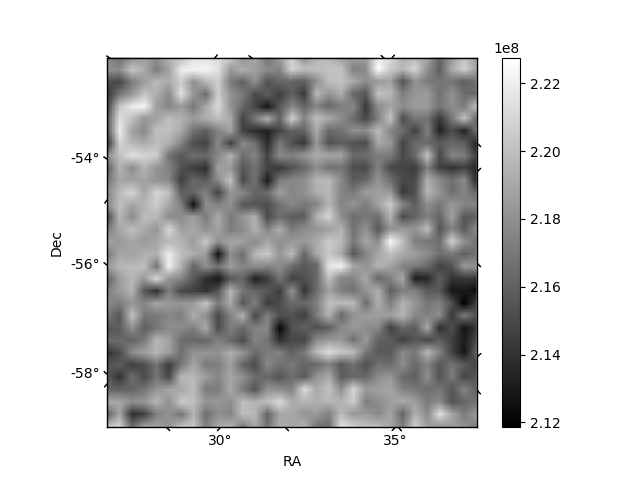
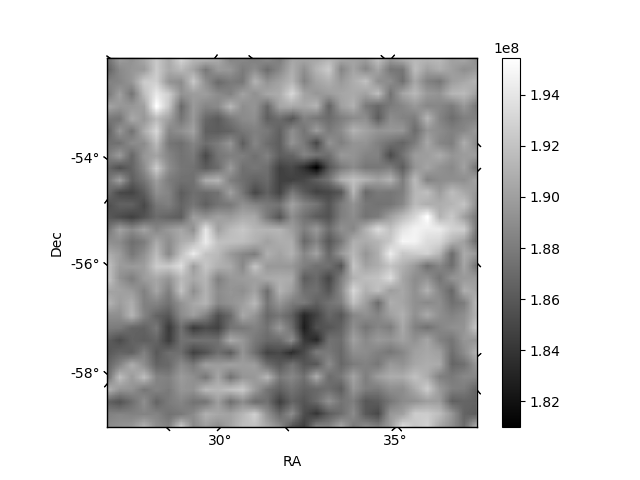
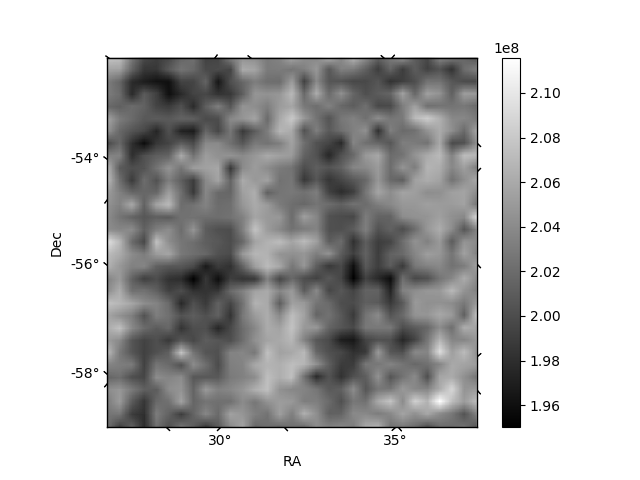
Histogram calculated using DETX and DETY for each event in the final _common_clean file
| Quadrant A | 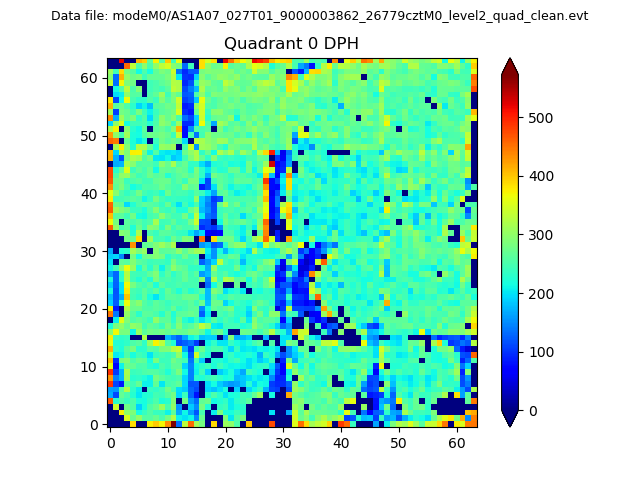 |
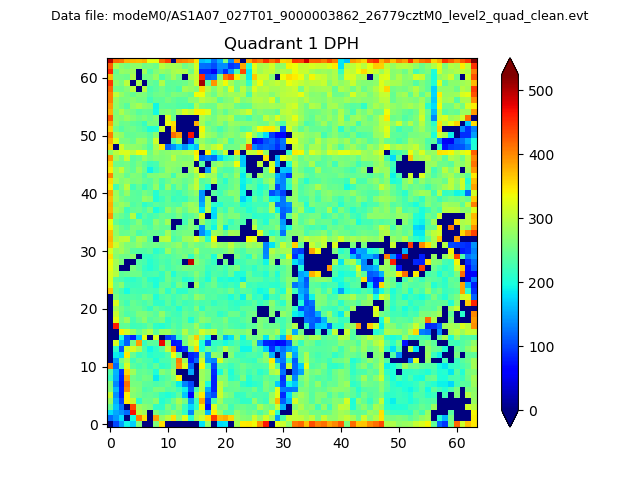 |
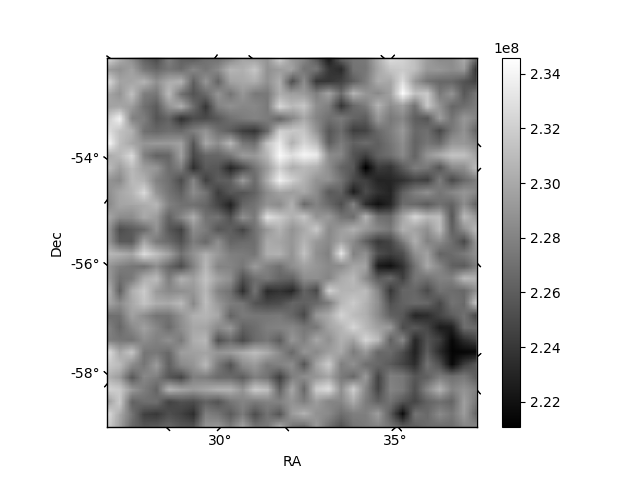
Quadrant B |
|---|---|---|---|
| Quadrant D |  |
 |
Quadrant C |
| Plot type | Count rate plots | Images |
|---|---|---|
| Comparison with Poisson distribution Blue bars denote a histogram of data divided into 1 sec bins. Red curve is a Poisson curve with rate = median count rate of data. |
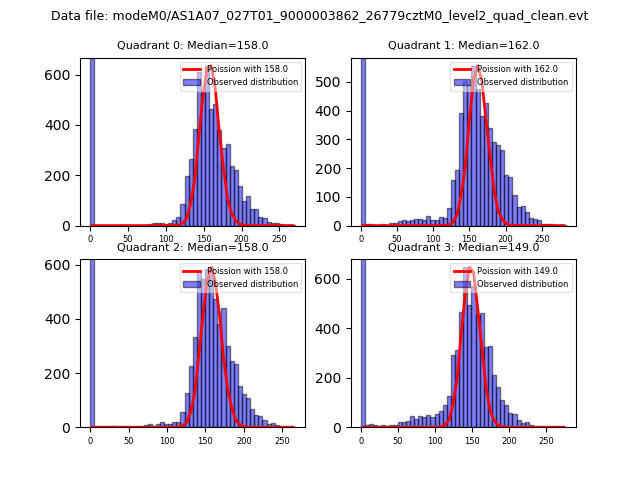 |
 |
| Quadrant-wise count rates Data is divided into 100 sec bins |
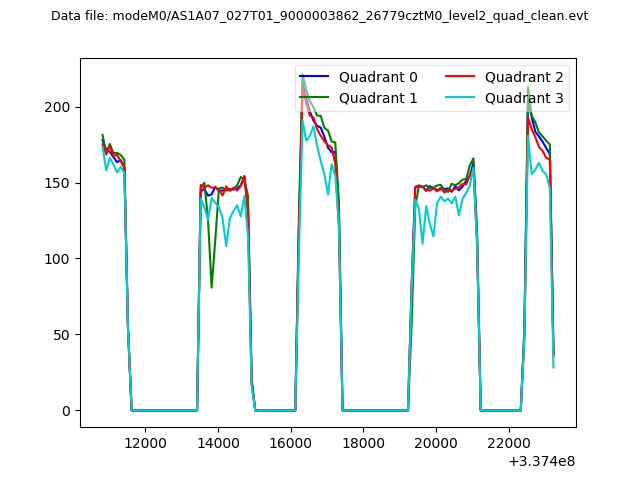 |
|
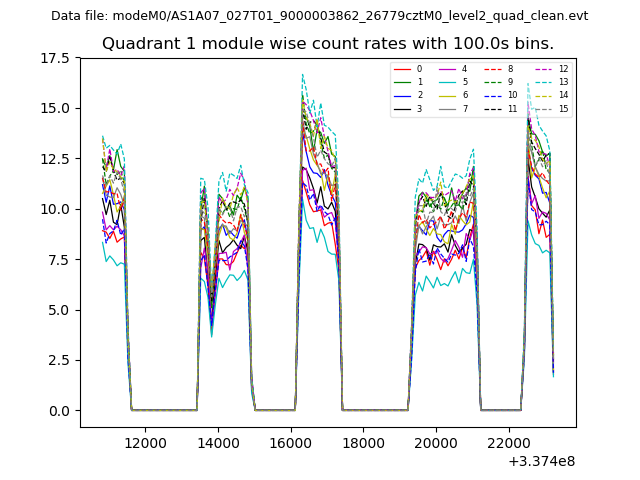
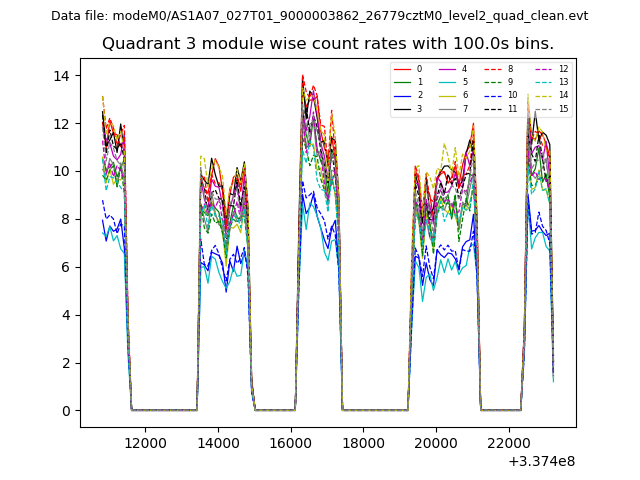
| Module-wise count rates for Quadrant A Data is divided into 100 sec bins |
 |
 |
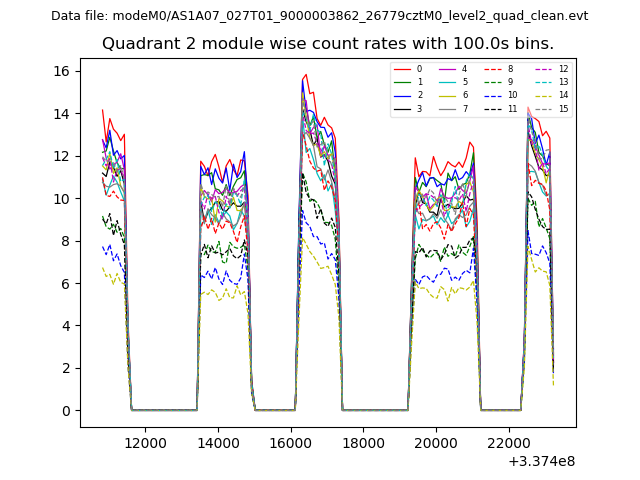
| Module-wise count rates for Quadrant B Data is divided into 100 sec bins |
 |
 |
| Module-wise count rates for Quadrant C Data is divided into 100 sec bins |
 |
 |
| Module-wise count rates for Quadrant D Data is divided into 100 sec bins |
 |
 |
| Parameter | Plot |
|---|---|
| CZT HV Monitor | 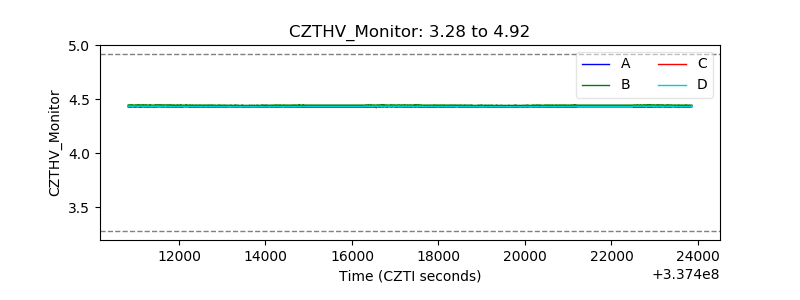 |
| D_VDD | 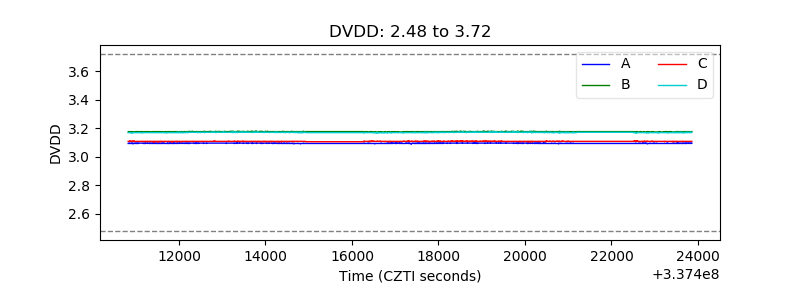 |
| Temperature 1 | 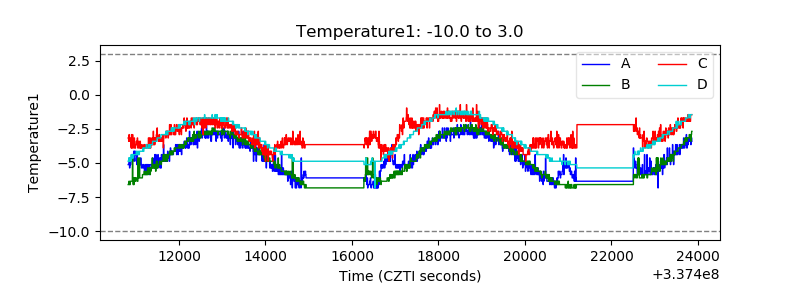 |
| Veto HV Monitor | 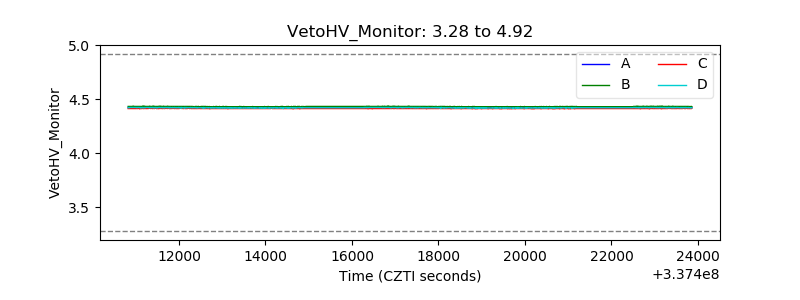 |
| Veto LLD | 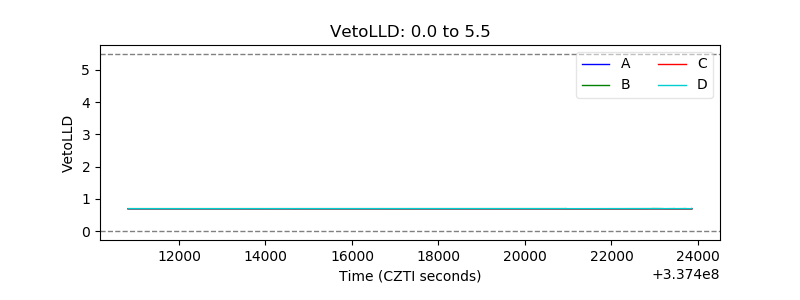 |
| Alpha Counter | 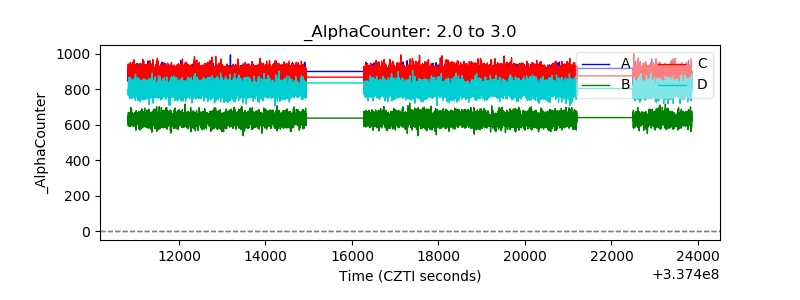 |
| _CPM_Rate | 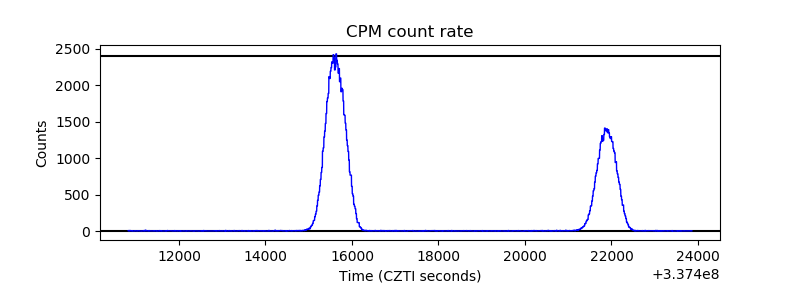 |
| CZT Counter |  |
| +2.5 Volts monitor |  |
| +5 Volts monitor | 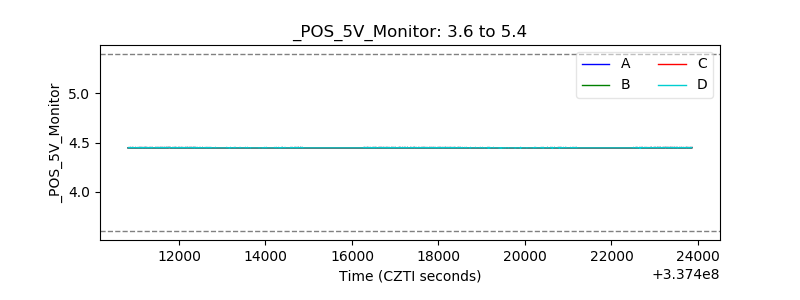 |
| _ROLL_ROT | 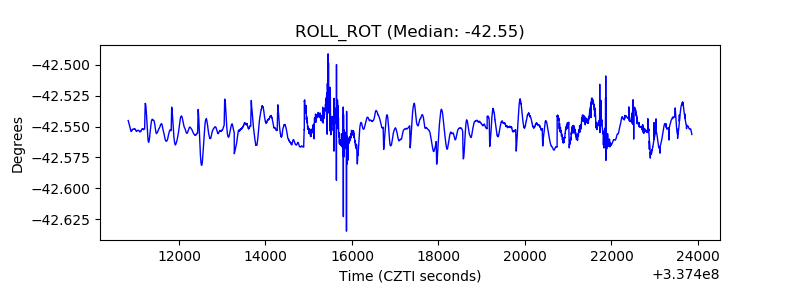 |
| _Roll_DEC | 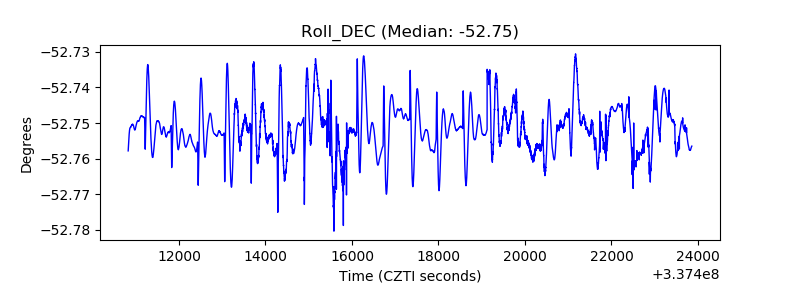 |
| _Roll_RA |  |
| Veto Counter | 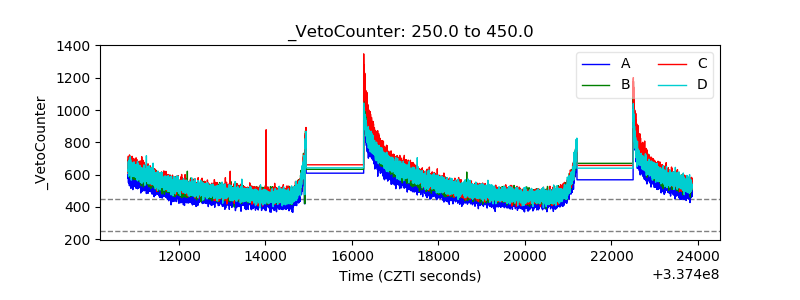 |