| Param | Original file | Final file |
|---|---|---|
| Filename | modeM0/AS1A07_027T01_9000003862_26780cztM0_level2.evt | modeM0/AS1A07_027T01_9000003862_26780cztM0_level2_quad_clean.evt |
| Size (bytes) | 470,986,560 | 53,049,600 |
| Size | 449.2 MB | 50.6 MB |
| Events in quadrant A | 2,692,686 | 339,106 |
| Events in quadrant B | 3,020,824 | 334,993 |
| Events in quadrant C | 2,179,517 | 333,450 |
| Events in quadrant D | 6,084,925 | 301,484 |
| Mode M0 | |||
|---|---|---|---|
| Quadrant | BADHDUFLAG | Total packets | Discarded packets |
| A | 0 | 10876 | 0 |
| B | 0 | 11510 | 0 |
| C | 0 | 8931 | 0 |
| D | 0 | 20996 | 0 |
| Quadrant | Total seconds | Saturated seconds | Saturation percentage |
|---|---|---|---|
| A | 4209 | 11 | 0.261345% |
| B | 4209 | 254 | 6.034688% |
| C | 4210 | 13 | 0.308789% |
| D | 4210 | 1262 | 29.976247% |
Noise dominated data is calculated using 1-second bins in cleaned event files. If a bin has >2000 counts, and if more than 50% of those come from <1% of pixels, then it is considered to be noise-dominated and hence unusable.
| Quadrant | # 1 sec bins | Bins with >0 counts | Bins with >2000 counts | High rate bins dominated by noise | Noise dominated (total time) | Noise dominated (detector-on time) | Marked lightcurve |
|---|---|---|---|---|---|---|---|
| A | 4209 | 4209 | 1 | 1 | 0.02% | 0.02% |  |
| B | 4209 | 4209 | 213 | 213 | 5.06% | 5.06% |  |
| C | 4210 | 4210 | 2 | 2 | 0.05% | 0.05% |  |
| D | 4210 | 4210 | 1066 | 1066 | 25.32% | 25.32% |  |
Top three noisy pixels from each quadrant. If the there are fewer than three noisy pixels in the level2.evt file, extra rows are filled as -1
| Pixel properties | Quadrant properties | ||||||
|---|---|---|---|---|---|---|---|
| Quadrant | DetID | PixID | Counts | Sigma | Mean | Median | Sigma |
| A | 0 | 13 | 578660 | 5301.85 | 548 | 540 | 109.0 |
| A | 13 | 254 | 6464 | 54.33 | 548 | 540 | 109.0 |
| A | 0 | 226 | 4645 | 37.65 | 548 | 540 | 109.0 |
| B | 0 | 189 | 844761 | 8589.82 | 529 | 517 | 98.3 |
| B | 15 | 32 | 65136 | 657.47 | 529 | 517 | 98.3 |
| B | 0 | 190 | 21855 | 217.11 | 529 | 517 | 98.3 |
| C | 14 | 238 | 87069 | 708.19 | 528 | 532 | 122.2 |
| C | 15 | 208 | 15566 | 123.03 | 528 | 532 | 122.2 |
| C | 2 | 16 | 13110 | 102.93 | 528 | 532 | 122.2 |
| D | 7 | 80 | 3584926 | 31805.77 | 472 | 461 | 112.7 |
| D | 1 | 52 | 369281 | 3272.62 | 472 | 461 | 112.7 |
| D | 1 | 239 | 177504 | 1570.94 | 472 | 461 | 112.7 |
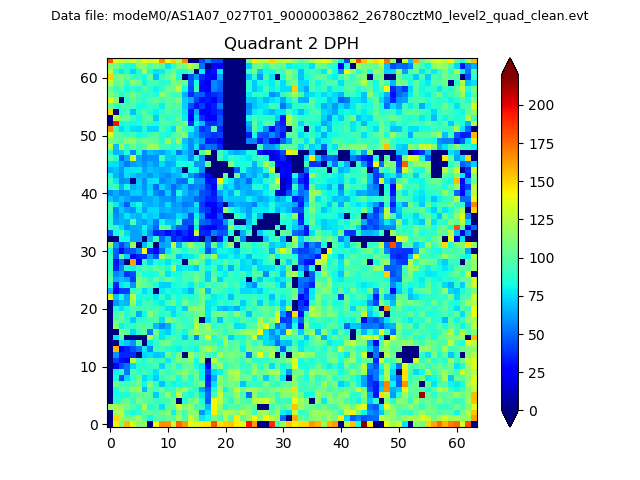
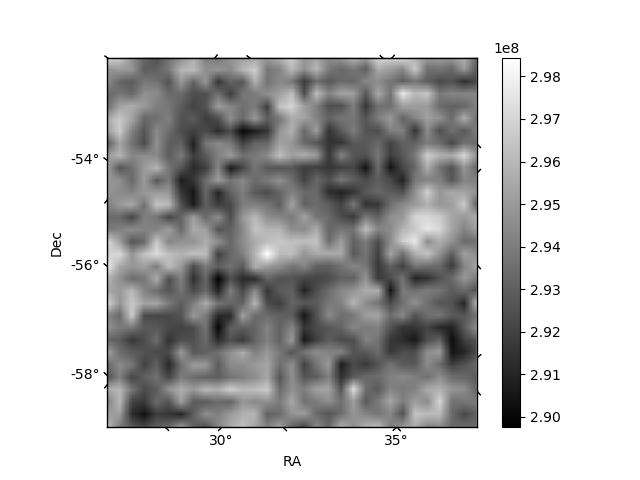
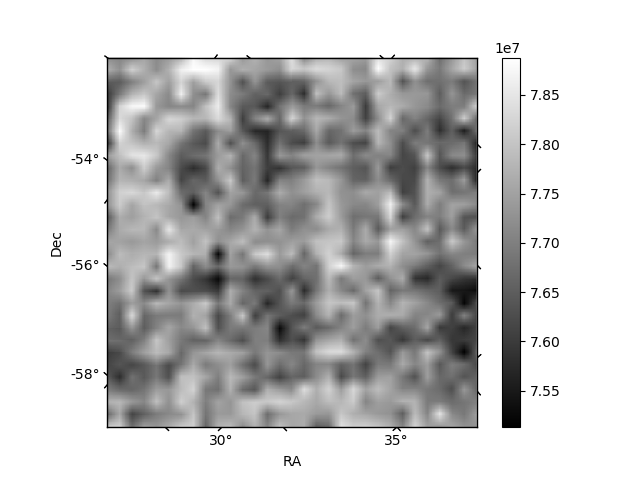
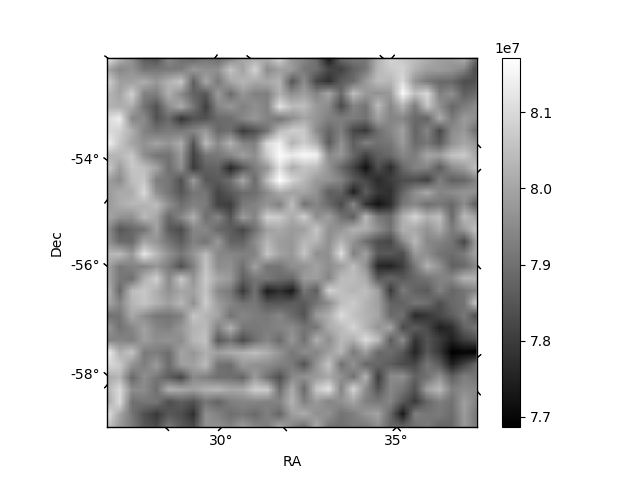
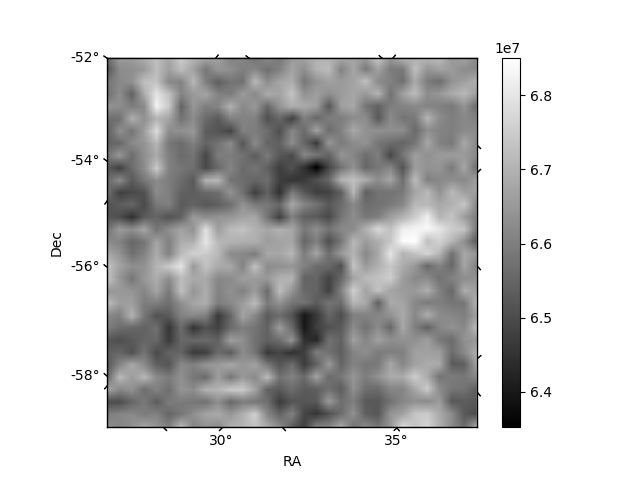
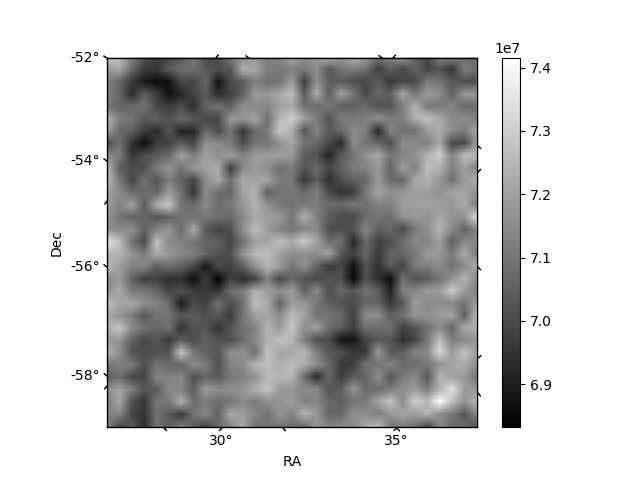
Histogram calculated using DETX and DETY for each event in the final _common_clean file
| Quadrant A | 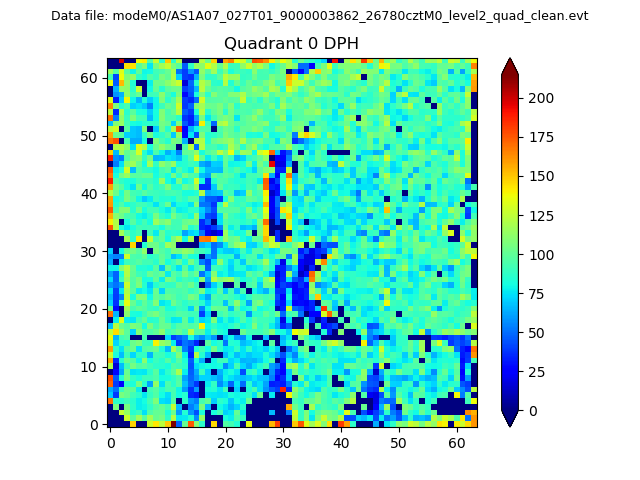 |
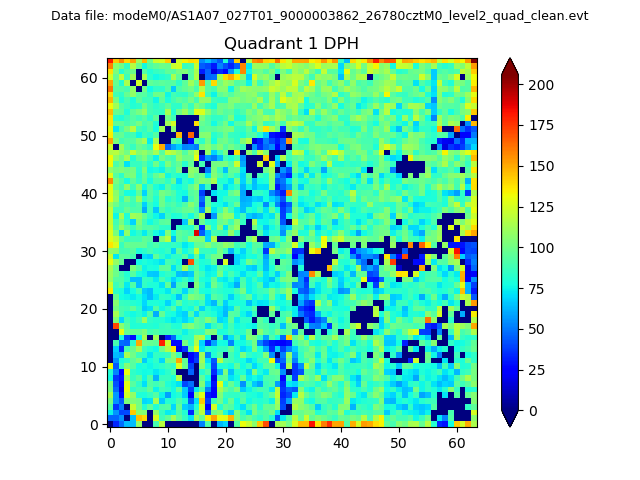 |
Quadrant B |
|---|---|---|---|
| Quadrant D | 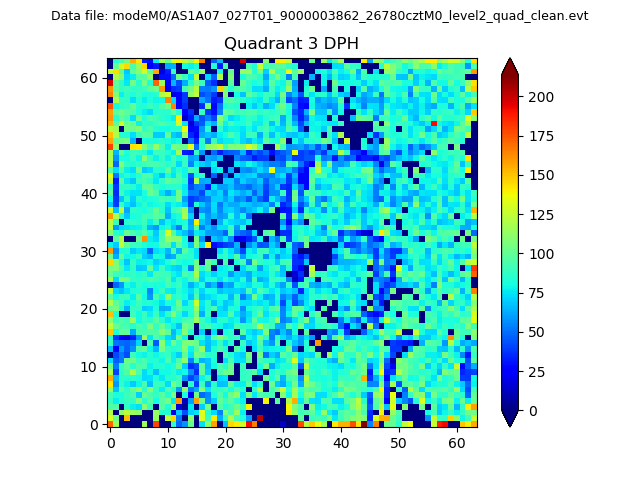 |
 |
Quadrant C |
| Plot type | Count rate plots | Images |
|---|---|---|
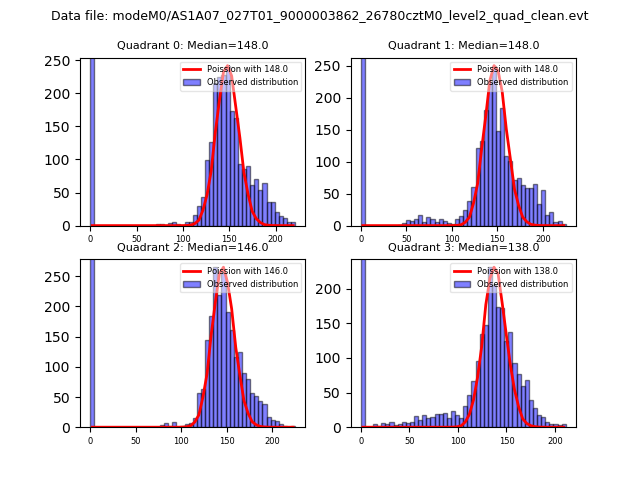
| Comparison with Poisson distribution Blue bars denote a histogram of data divided into 1 sec bins. Red curve is a Poisson curve with rate = median count rate of data. |
 |
 |
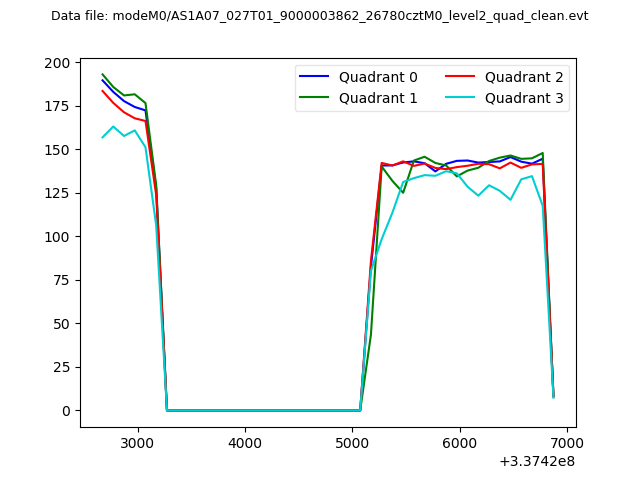
| Quadrant-wise count rates Data is divided into 100 sec bins |
 |
|
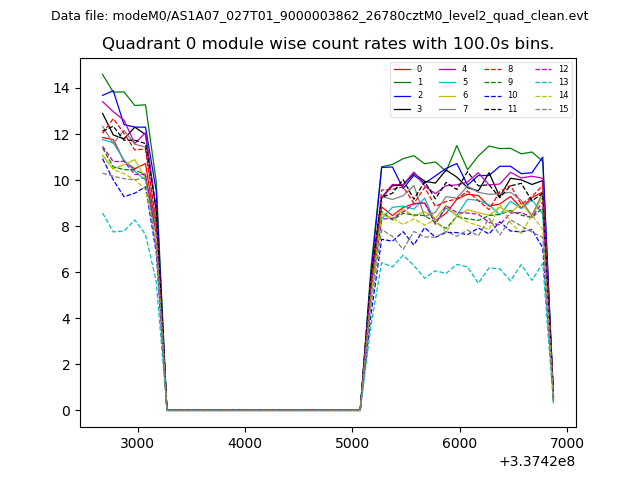
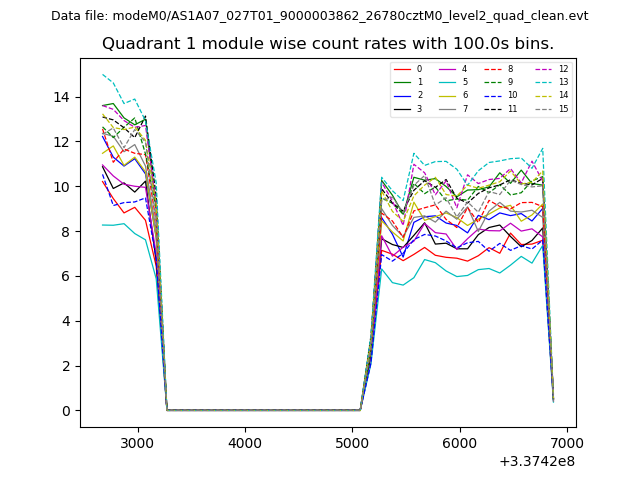
| Module-wise count rates for Quadrant A Data is divided into 100 sec bins |
 |
 |
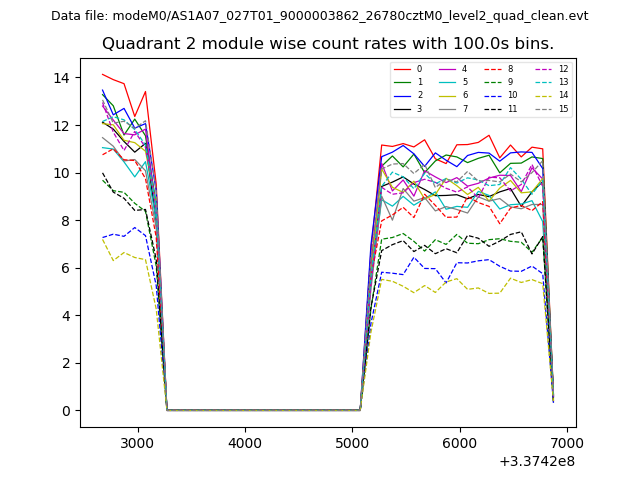
| Module-wise count rates for Quadrant B Data is divided into 100 sec bins |
 |
 |
| Module-wise count rates for Quadrant C Data is divided into 100 sec bins |
 |
 |
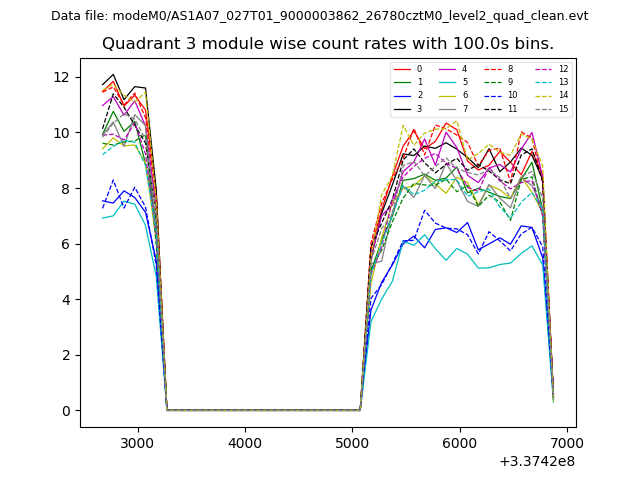
| Module-wise count rates for Quadrant D Data is divided into 100 sec bins |
 |
 |
| Parameter | Plot |
|---|---|
| CZT HV Monitor | 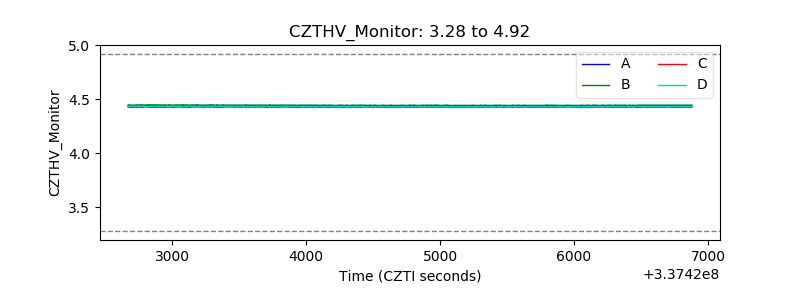 |
| D_VDD | 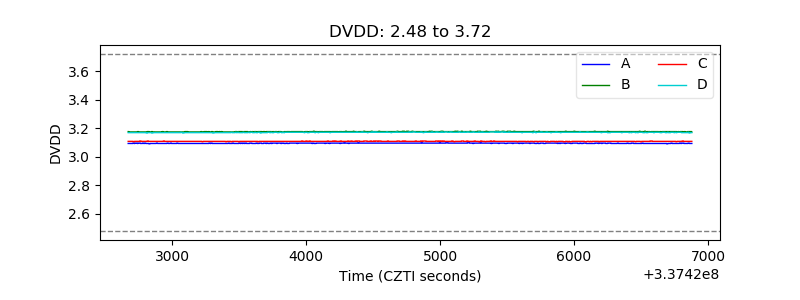 |
| Temperature 1 |  |
| Veto HV Monitor | 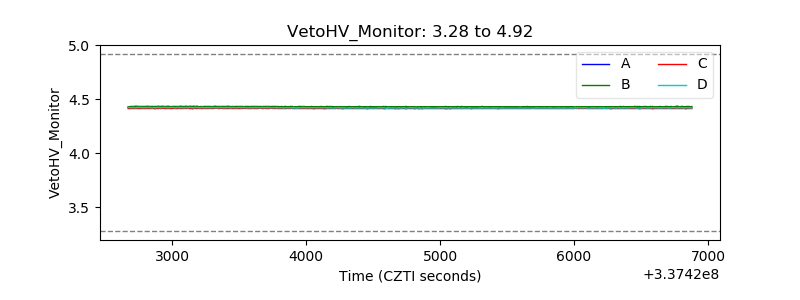 |
| Veto LLD | 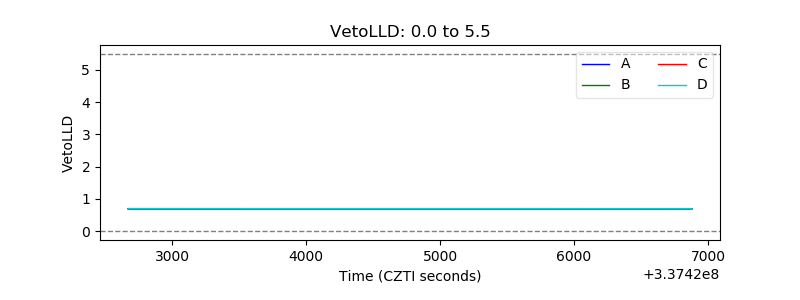 |
| Alpha Counter | 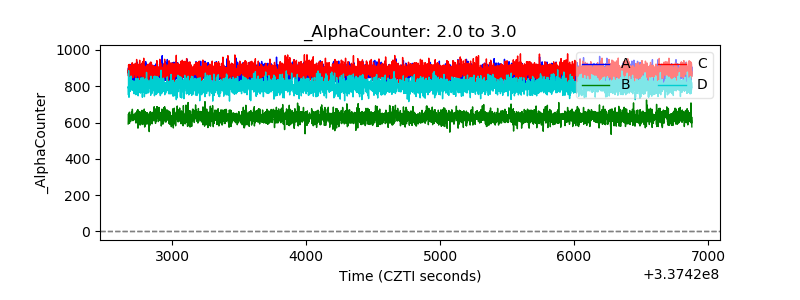 |
| _CPM_Rate | 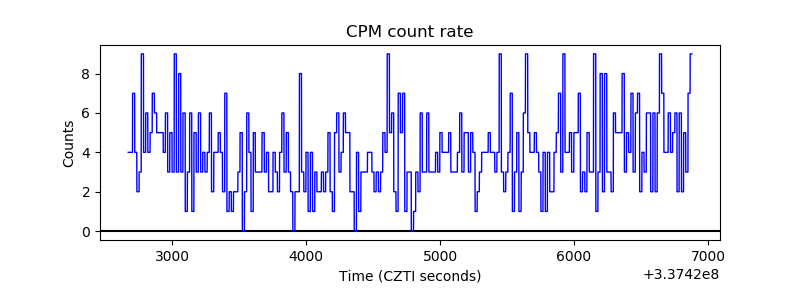 |
| CZT Counter | 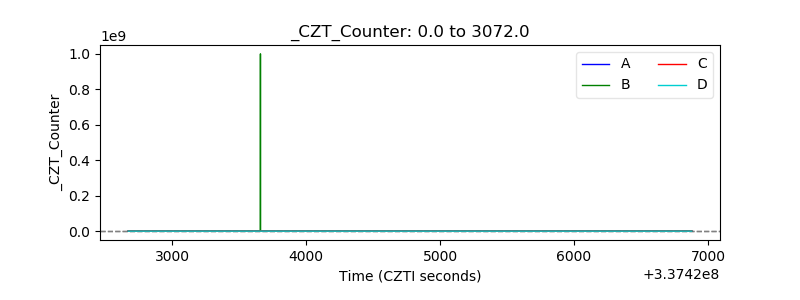 |
| +2.5 Volts monitor |  |
| +5 Volts monitor |  |
| _ROLL_ROT | 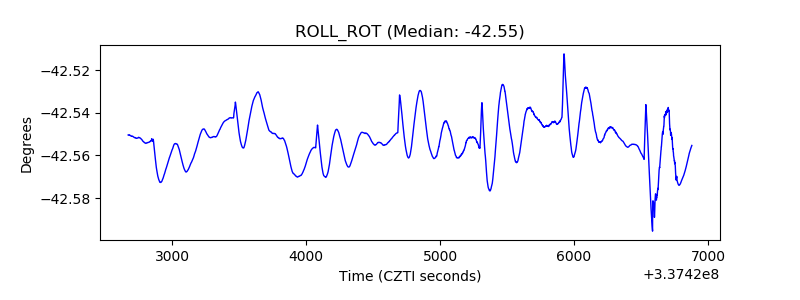 |
| _Roll_DEC | 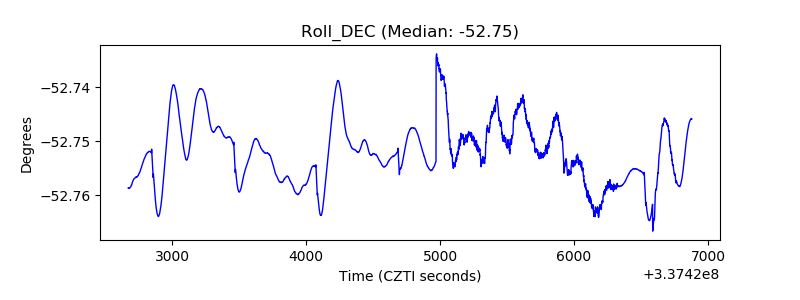 |
| _Roll_RA | 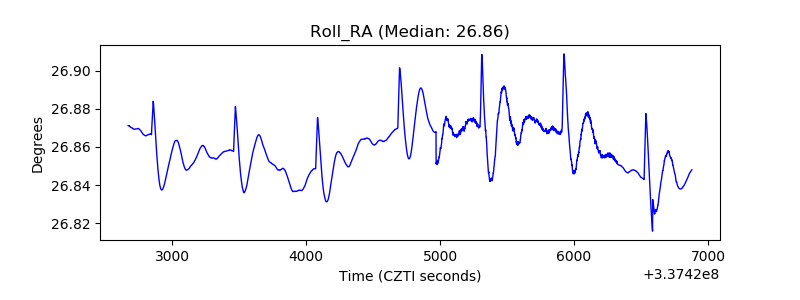 |
| Veto Counter | 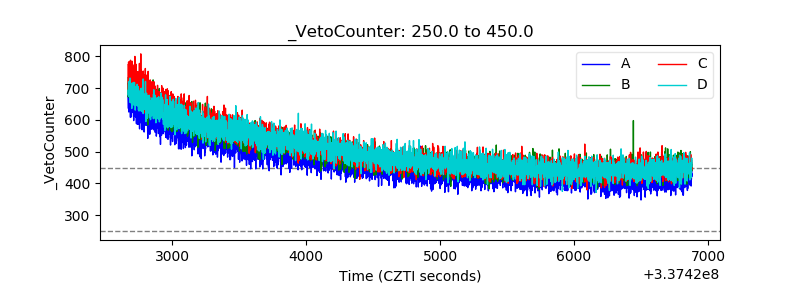 |