| Param | Original file | Final file |
|---|---|---|
| Filename | modeM0/AS1A09_079T01_9000003864_26780cztM0_level2.evt | modeM0/AS1A09_079T01_9000003864_26780cztM0_level2_quad_clean.evt |
| Size (bytes) | 181,938,240 | 38,453,760 |
| Size | 173.5 MB | 36.7 MB |
| Events in quadrant A | 1,663,373 | 255,546 |
| Events in quadrant B | 1,061,838 | 267,853 |
| Events in quadrant C | 1,052,275 | 258,127 |
| Events in quadrant D | 1,600,340 | 242,950 |
| Mode M9 | |||
|---|---|---|---|
| Quadrant | BADHDUFLAG | Total packets | Discarded packets |
| A | 0 | 11 | 0 |
| B | 0 | 11 | 0 |
| C | 0 | 11 | 0 |
| D | 0 | 11 | 0 |
| Mode M0 | |||
|---|---|---|---|
| Quadrant | BADHDUFLAG | Total packets | Discarded packets |
| A | 0 | 6339 | 0 |
| B | 0 | 4269 | 0 |
| C | 0 | 4205 | 0 |
| D | 0 | 6105 | 0 |
| Quadrant | Total seconds | Saturated seconds | Saturation percentage |
|---|---|---|---|
| A | 1909 | 131 | 6.862232% |
| B | 1908 | 74 | 3.878407% |
| C | 1908 | 100 | 5.241090% |
| D | 1908 | 197 | 10.324948% |
Noise dominated data is calculated using 1-second bins in cleaned event files. If a bin has >2000 counts, and if more than 50% of those come from <1% of pixels, then it is considered to be noise-dominated and hence unusable.
| Quadrant | # 1 sec bins | Bins with >0 counts | Bins with >2000 counts | High rate bins dominated by noise | Noise dominated (total time) | Noise dominated (detector-on time) | Marked lightcurve |
|---|---|---|---|---|---|---|---|
| A | 3069 | 1910 | 18 | 18 | 0.59% | 0.94% | 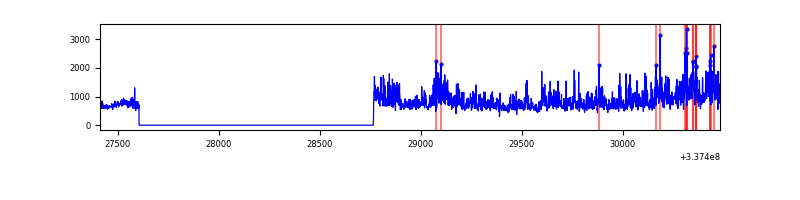 |
| B | 3068 | 1909 | 6 | 6 | 0.20% | 0.31% | 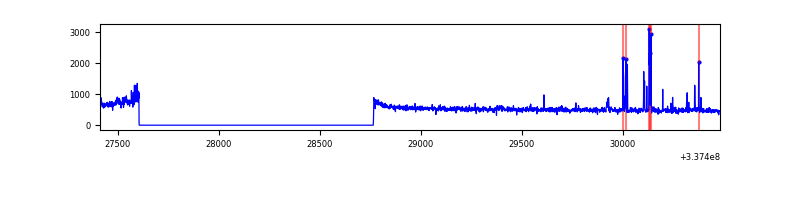 |
| C | 3068 | 1909 | 1 | 1 | 0.03% | 0.05% |  |
| D | 3068 | 1909 | 82 | 82 | 2.67% | 4.30% | 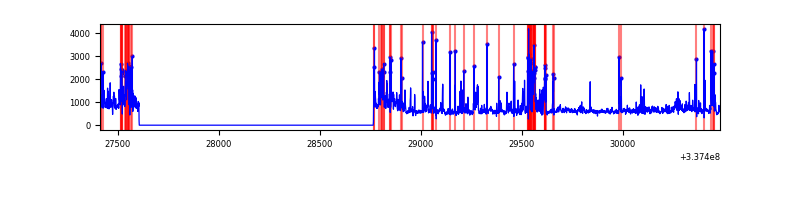 |
Top three noisy pixels from each quadrant. If the there are fewer than three noisy pixels in the level2.evt file, extra rows are filled as -1
| Pixel properties | Quadrant properties | ||||||
|---|---|---|---|---|---|---|---|
| Quadrant | DetID | PixID | Counts | Sigma | Mean | Median | Sigma |
| A | 0 | 13 | 662446 | 12428.27 | 259 | 253 | 53.3 |
| A | 13 | 254 | 2979 | 51.16 | 259 | 253 | 53.3 |
| A | 0 | 226 | 2242 | 37.33 | 259 | 253 | 53.3 |
| B | 0 | 189 | 54416 | 1082.24 | 254 | 247 | 50.1 |
| B | 12 | 111 | 5548 | 105.91 | 254 | 247 | 50.1 |
| B | 11 | 111 | 5253 | 100.01 | 254 | 247 | 50.1 |
| C | 14 | 238 | 40285 | 667.38 | 253 | 254 | 60.0 |
| C | 2 | 16 | 13390 | 219.0 | 253 | 254 | 60.0 |
| C | 15 | 208 | 9649 | 156.63 | 253 | 254 | 60.0 |
| D | 1 | 52 | 340282 | 5643.47 | 250 | 244 | 60.3 |
| D | 7 | 80 | 231804 | 3843.11 | 250 | 244 | 60.3 |
| D | 1 | 239 | 51536 | 851.27 | 250 | 244 | 60.3 |
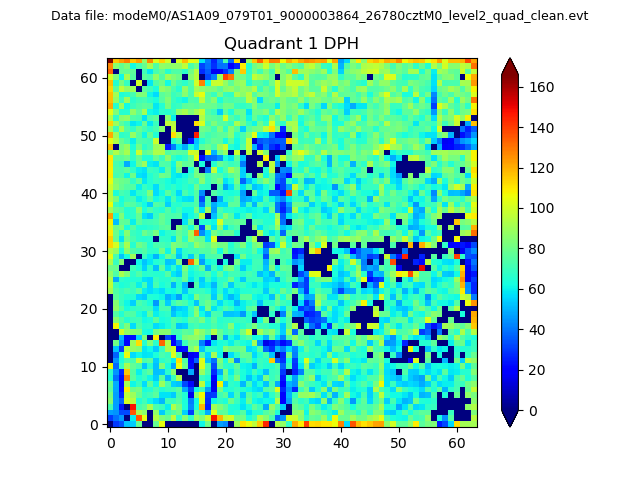
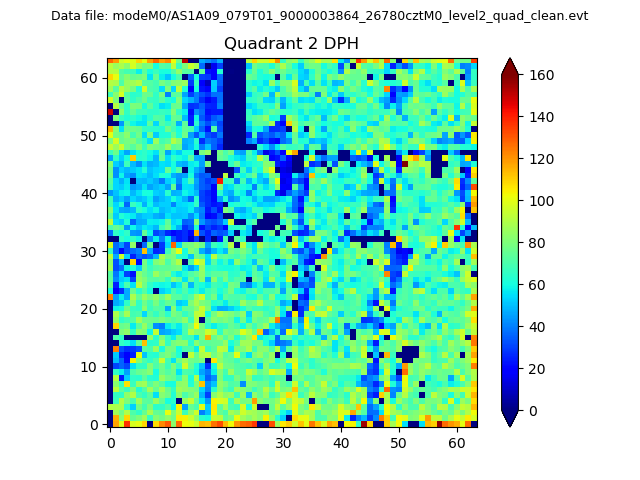
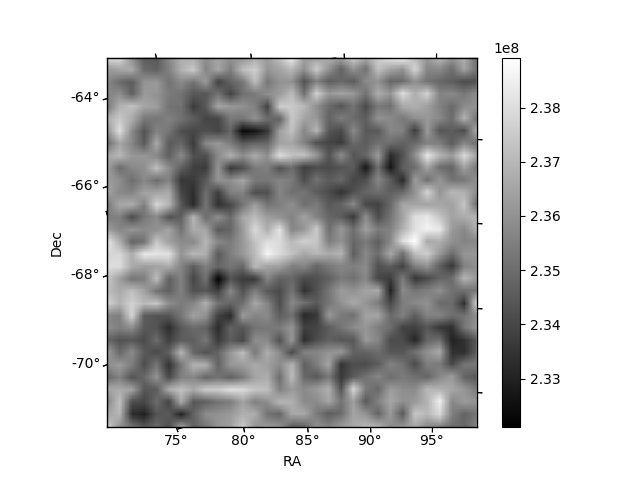
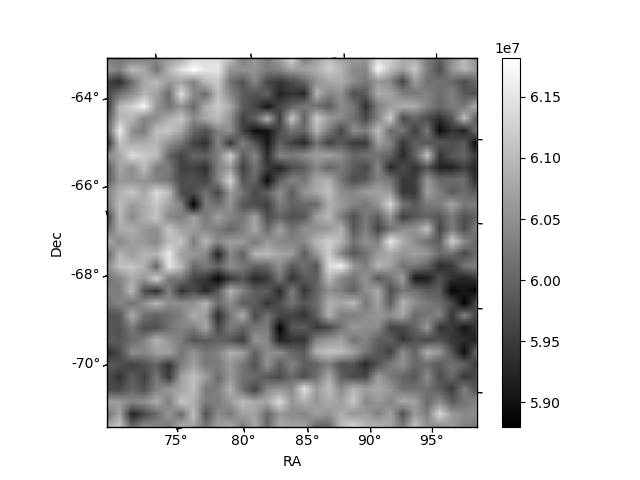
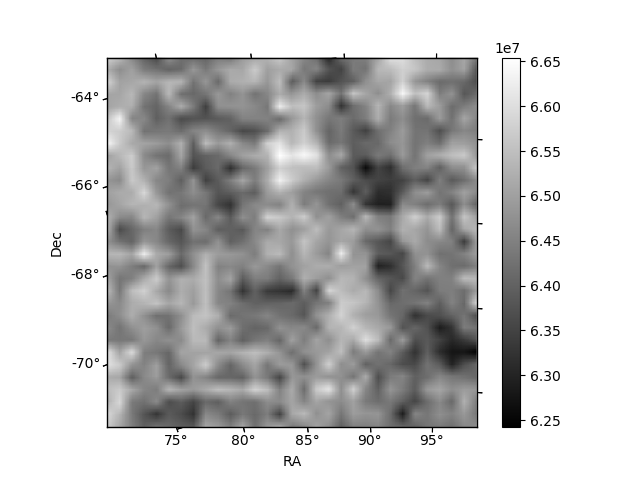
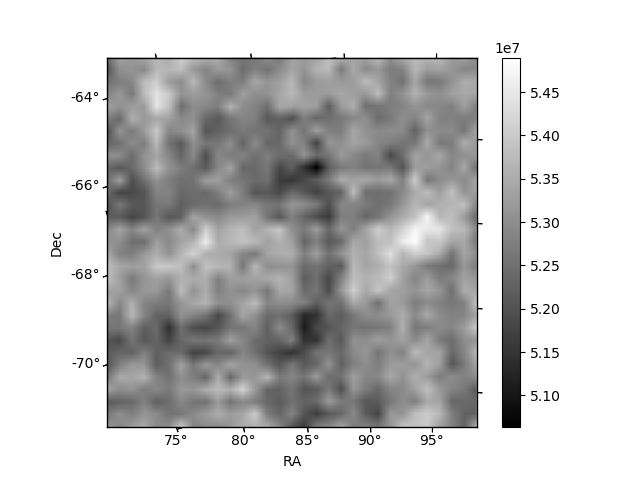
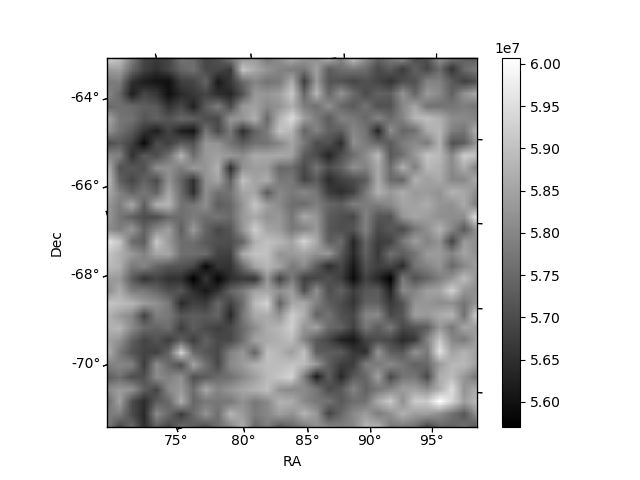
Histogram calculated using DETX and DETY for each event in the final _common_clean file
| Quadrant A | 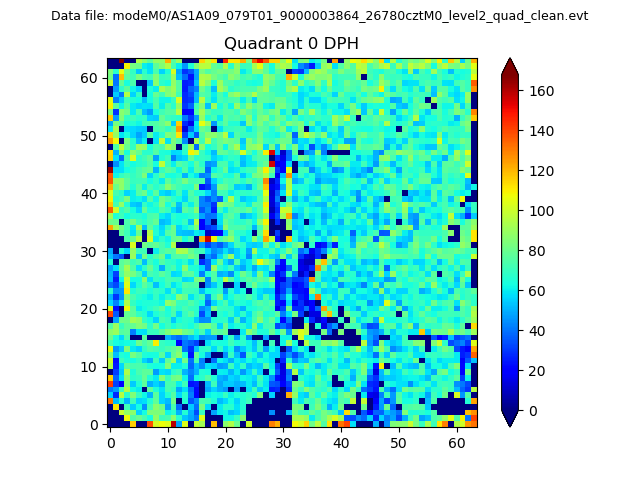 |
 |
Quadrant B |
|---|---|---|---|
| Quadrant D | 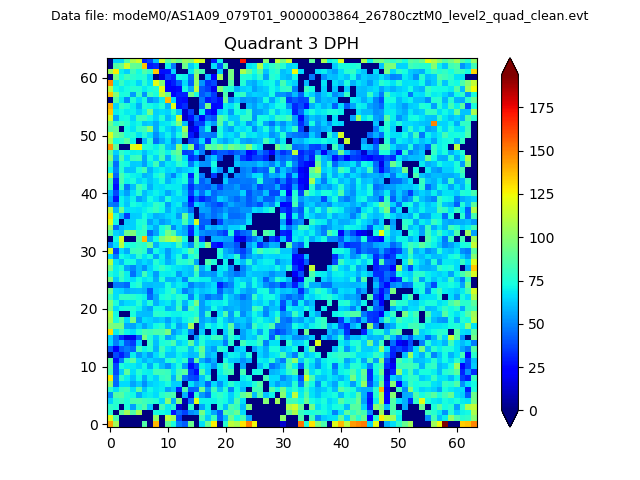 |
 |
Quadrant C |
| Plot type | Count rate plots | Images |
|---|---|---|
| Comparison with Poisson distribution Blue bars denote a histogram of data divided into 1 sec bins. Red curve is a Poisson curve with rate = median count rate of data. |
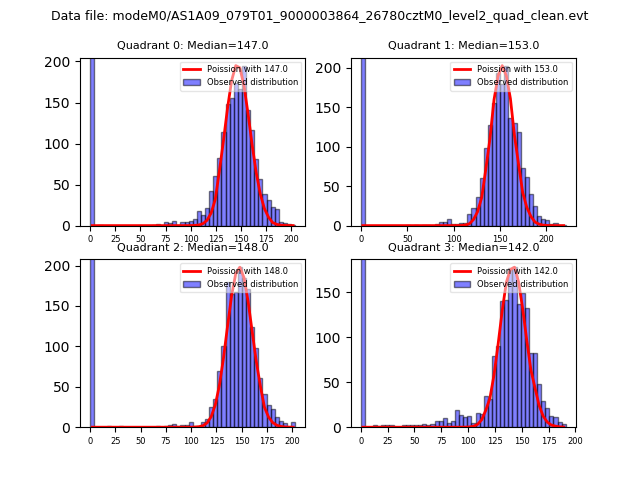 |
 |
| Quadrant-wise count rates Data is divided into 100 sec bins |
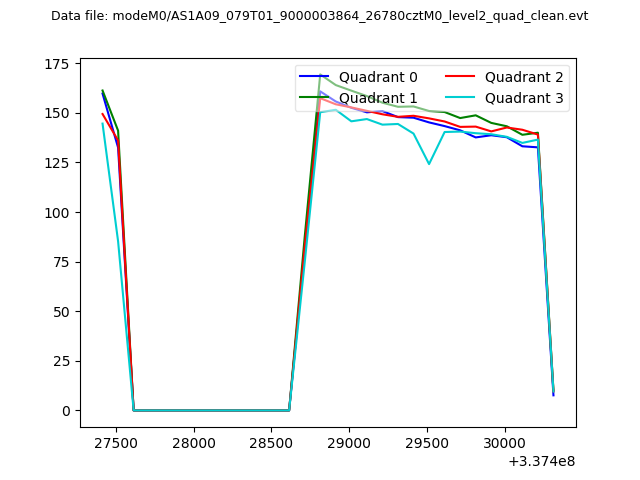 |
|
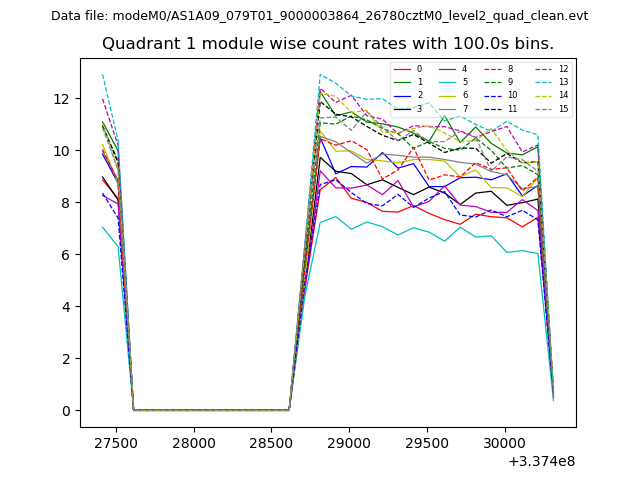
| Module-wise count rates for Quadrant A Data is divided into 100 sec bins |
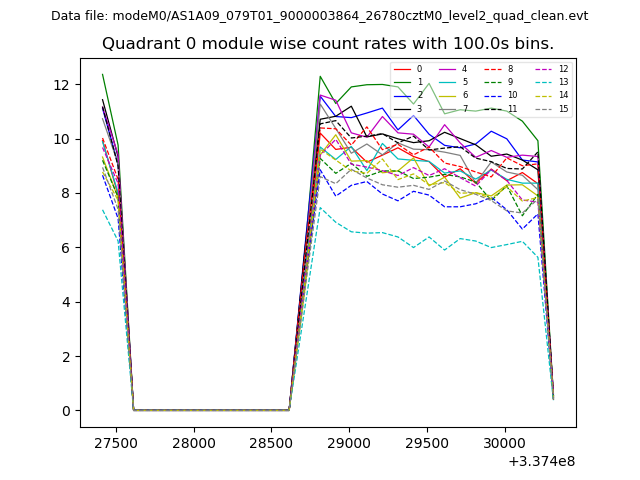 |
 |
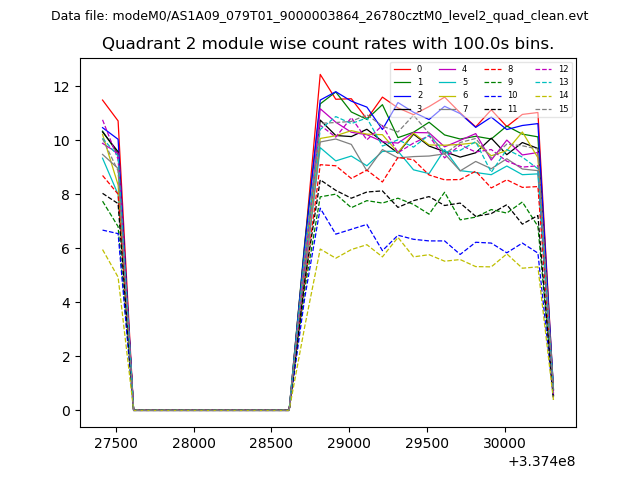
| Module-wise count rates for Quadrant B Data is divided into 100 sec bins |
 |
 |
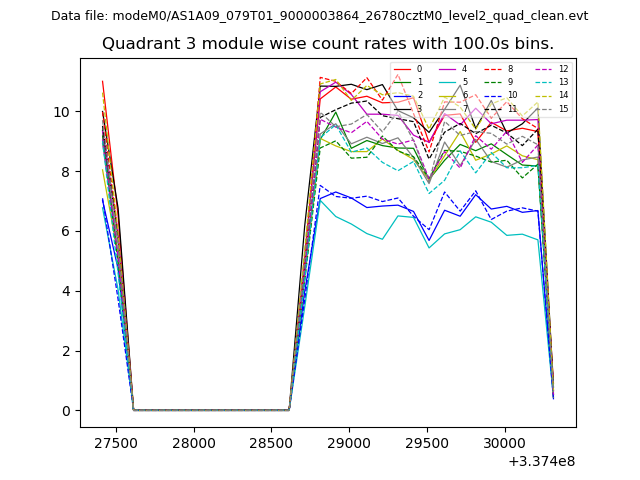
| Module-wise count rates for Quadrant C Data is divided into 100 sec bins |
 |
 |
| Module-wise count rates for Quadrant D Data is divided into 100 sec bins |
 |
 |
| Parameter | Plot |
|---|---|
| CZT HV Monitor |  |
| D_VDD | 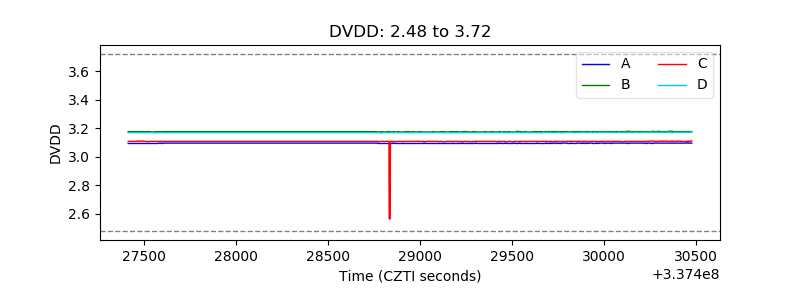 |
| Temperature 1 | 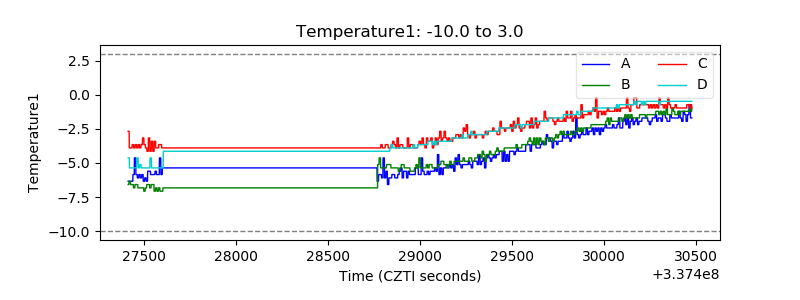 |
| Veto HV Monitor | 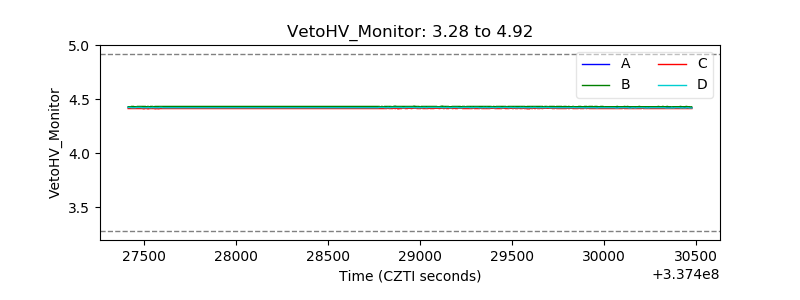 |
| Veto LLD | 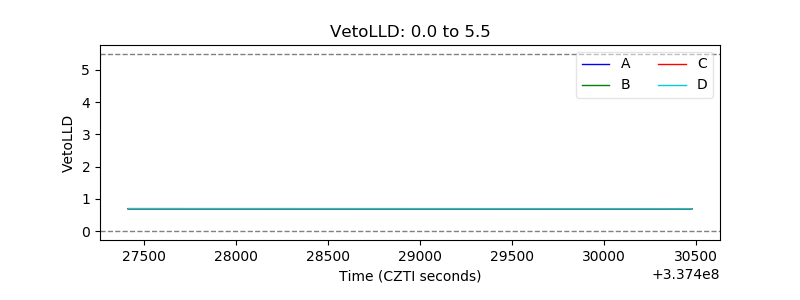 |
| Alpha Counter | 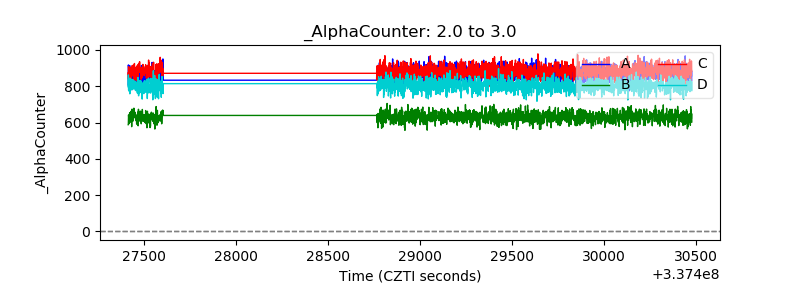 |
| _CPM_Rate | 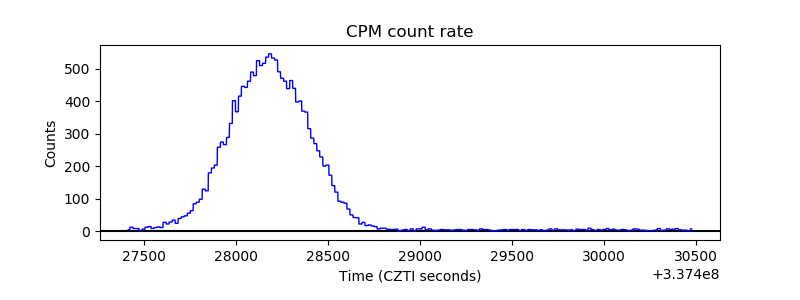 |
| CZT Counter | 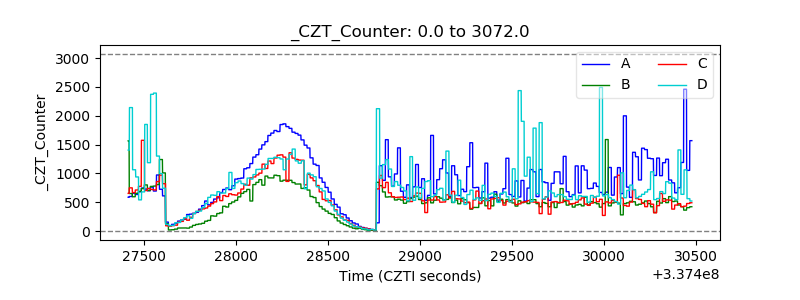 |
| +2.5 Volts monitor | 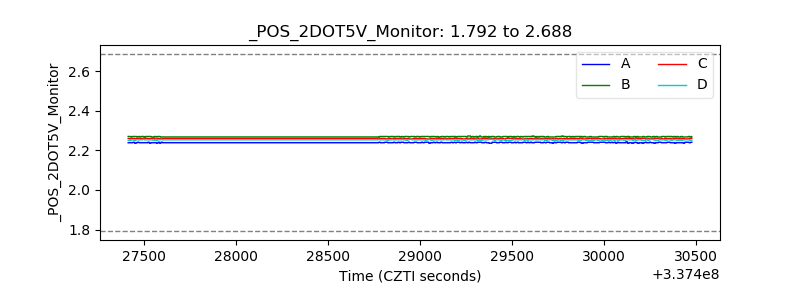 |
| +5 Volts monitor |  |
| _ROLL_ROT | 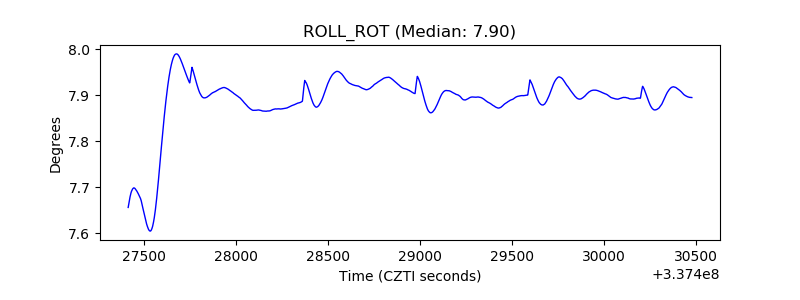 |
| _Roll_DEC | 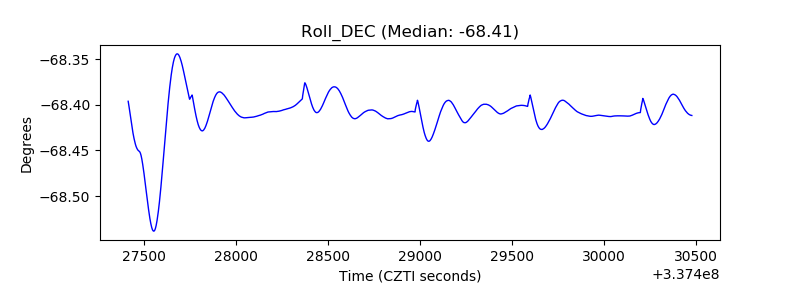 |
| _Roll_RA | 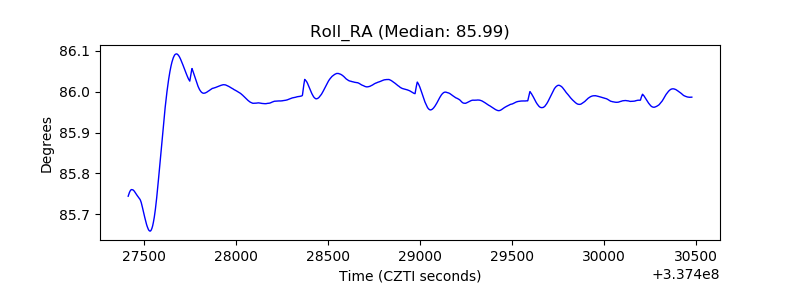 |
| Veto Counter | 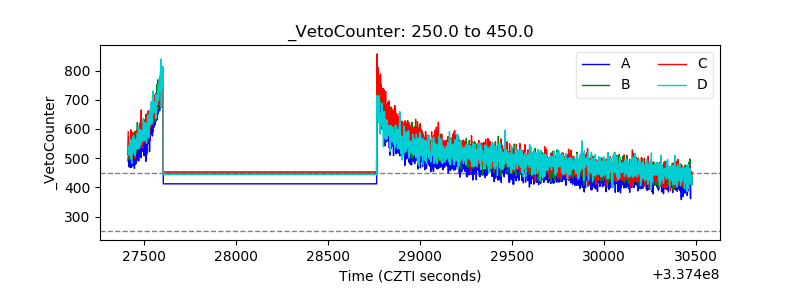 |