| Param | Original file | Final file |
|---|---|---|
| Filename | modeM0/AS1A09_079T01_9000003864_26781cztM0_level2.evt | modeM0/AS1A09_079T01_9000003864_26781cztM0_level2_quad_clean.evt |
| Size (bytes) | 516,409,920 | 93,038,400 |
| Size | 492.5 MB | 88.7 MB |
| Events in quadrant A | 5,258,479 | 593,357 |
| Events in quadrant B | 2,904,324 | 618,245 |
| Events in quadrant C | 2,924,139 | 602,952 |
| Events in quadrant D | 4,148,655 | 586,430 |
| Mode M9 | |||
|---|---|---|---|
| Quadrant | BADHDUFLAG | Total packets | Discarded packets |
| A | 0 | 9 | 0 |
| B | 0 | 9 | 0 |
| C | 0 | 9 | 0 |
| D | 0 | 9 | 0 |
| Mode M0 | |||
|---|---|---|---|
| Quadrant | BADHDUFLAG | Total packets | Discarded packets |
| A | 0 | 19710 | 0 |
| B | 0 | 12279 | 0 |
| C | 0 | 12329 | 0 |
| D | 0 | 16422 | 0 |
| Quadrant | Total seconds | Saturated seconds | Saturation percentage |
|---|---|---|---|
| A | 5965 | 275 | 4.610226% |
| B | 5966 | 102 | 1.709688% |
| C | 5966 | 120 | 2.011398% |
| D | 5966 | 259 | 4.341267% |
Noise dominated data is calculated using 1-second bins in cleaned event files. If a bin has >2000 counts, and if more than 50% of those come from <1% of pixels, then it is considered to be noise-dominated and hence unusable.
| Quadrant | # 1 sec bins | Bins with >0 counts | Bins with >2000 counts | High rate bins dominated by noise | Noise dominated (total time) | Noise dominated (detector-on time) | Marked lightcurve |
|---|---|---|---|---|---|---|---|
| A | 6810 | 5966 | 113 | 113 | 1.66% | 1.89% | 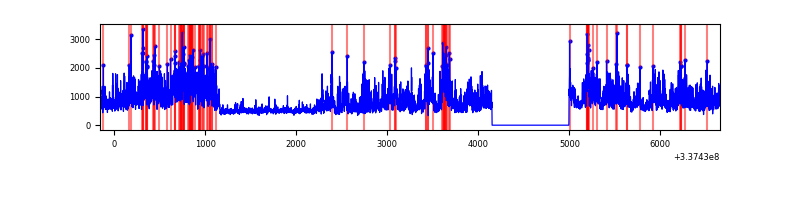 |
| B | 6811 | 5966 | 6 | 6 | 0.09% | 0.10% | 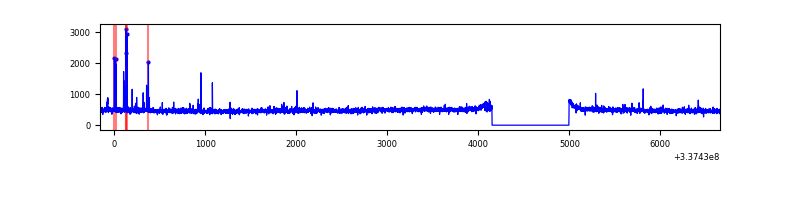 |
| C | 6811 | 5966 | 0 | 0 | 0.00% | 0.00% |  |
| D | 6811 | 5966 | 153 | 153 | 2.25% | 2.56% | 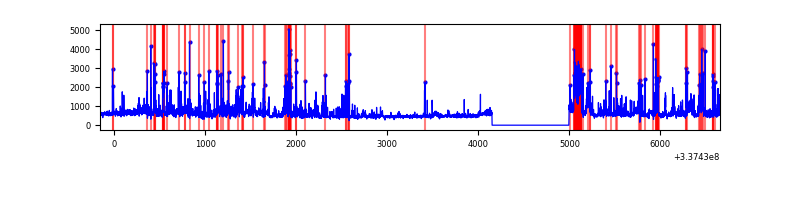 |
Top three noisy pixels from each quadrant. If the there are fewer than three noisy pixels in the level2.evt file, extra rows are filled as -1
| Pixel properties | Quadrant properties | ||||||
|---|---|---|---|---|---|---|---|
| Quadrant | DetID | PixID | Counts | Sigma | Mean | Median | Sigma |
| A | 0 | 13 | 2450506 | 17065.76 | 721 | 705 | 143.6 |
| A | 11 | 29 | 15861 | 105.58 | 721 | 705 | 143.6 |
| A | 12 | 96 | 12554 | 82.54 | 721 | 705 | 143.6 |
| B | 0 | 189 | 37528 | 271.69 | 722 | 704 | 135.5 |
| B | 0 | 229 | 16867 | 119.25 | 722 | 704 | 135.5 |
| B | 12 | 111 | 16144 | 113.92 | 722 | 704 | 135.5 |
| C | 14 | 238 | 115761 | 705.24 | 705 | 708 | 163.1 |
| C | 2 | 16 | 43806 | 264.18 | 705 | 708 | 163.1 |
| C | 15 | 208 | 10707 | 61.29 | 705 | 708 | 163.1 |
| D | 1 | 52 | 752639 | 4443.74 | 706 | 688 | 169.2 |
| D | 7 | 80 | 218293 | 1285.96 | 706 | 688 | 169.2 |
| D | 1 | 239 | 211953 | 1248.49 | 706 | 688 | 169.2 |
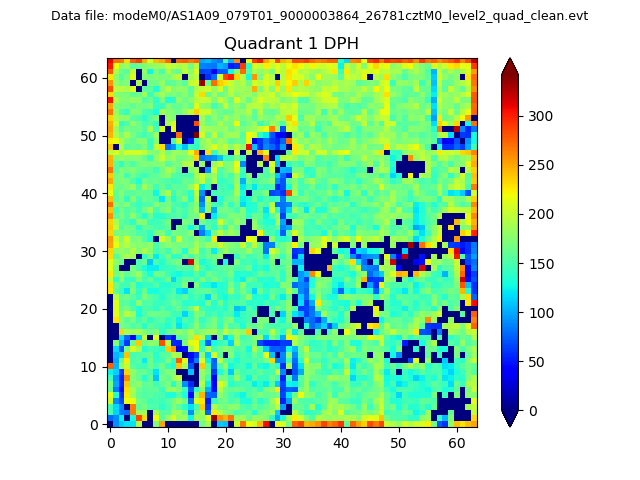
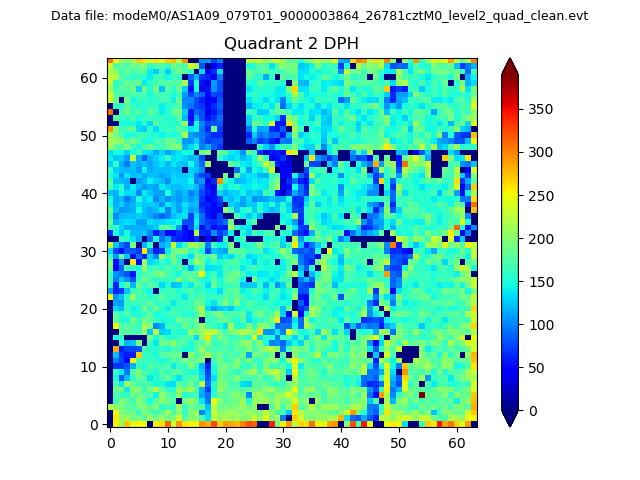
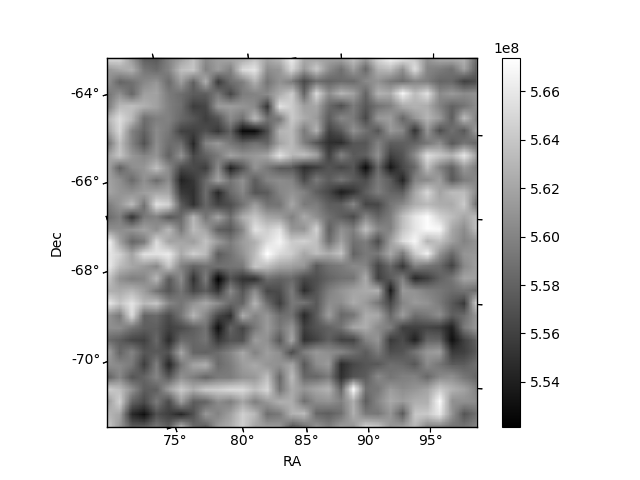
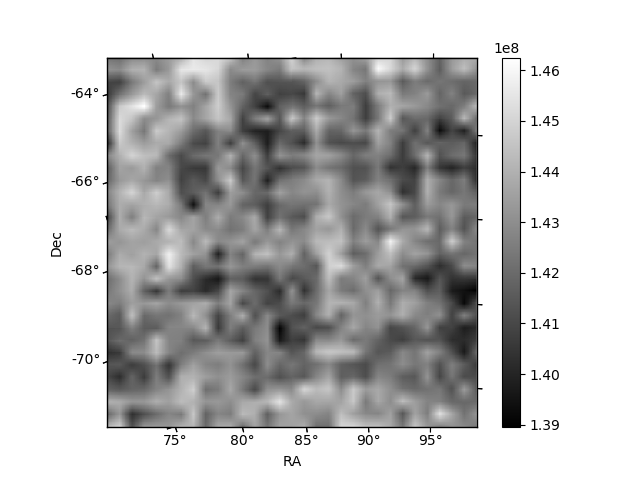
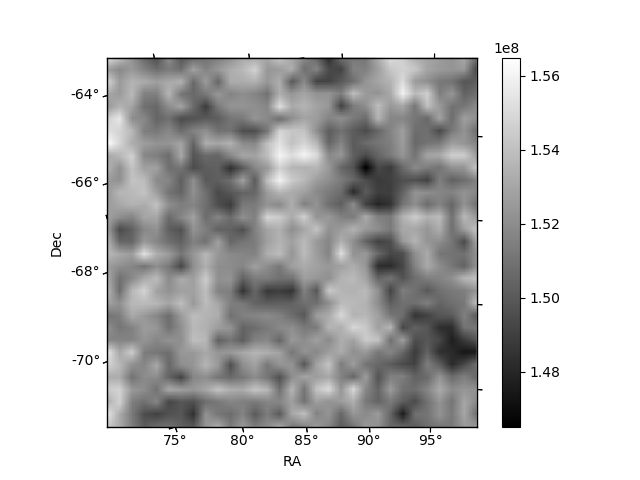
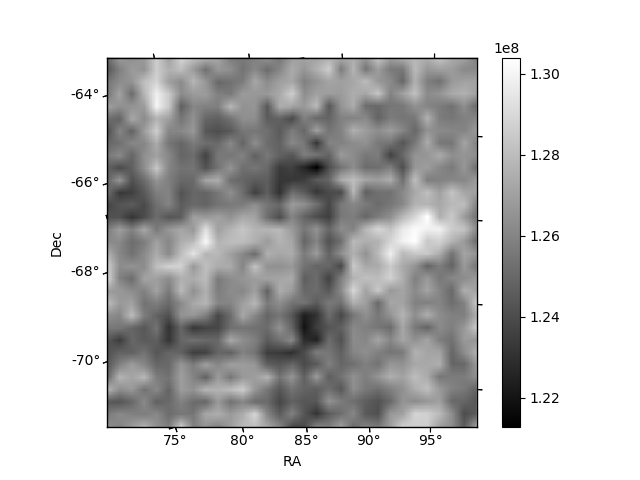
Histogram calculated using DETX and DETY for each event in the final _common_clean file
| Quadrant A | 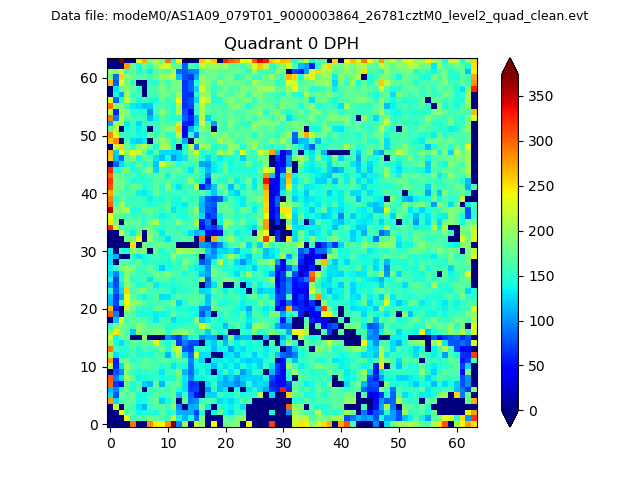 |
 |
Quadrant B |
|---|---|---|---|
| Quadrant D | 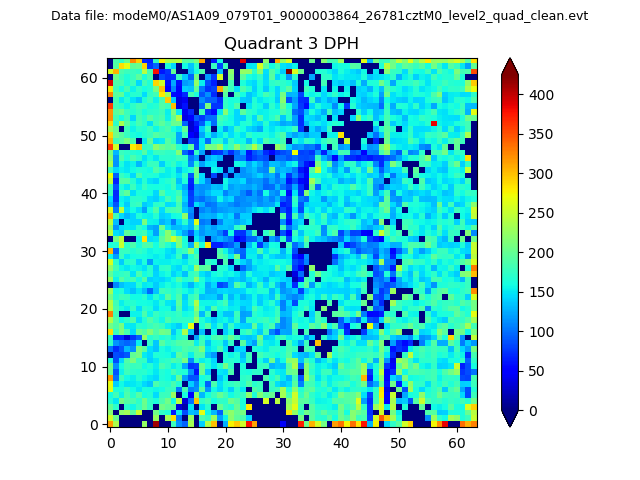 |
 |
Quadrant C |
| Plot type | Count rate plots | Images |
|---|---|---|
| Comparison with Poisson distribution Blue bars denote a histogram of data divided into 1 sec bins. Red curve is a Poisson curve with rate = median count rate of data. |
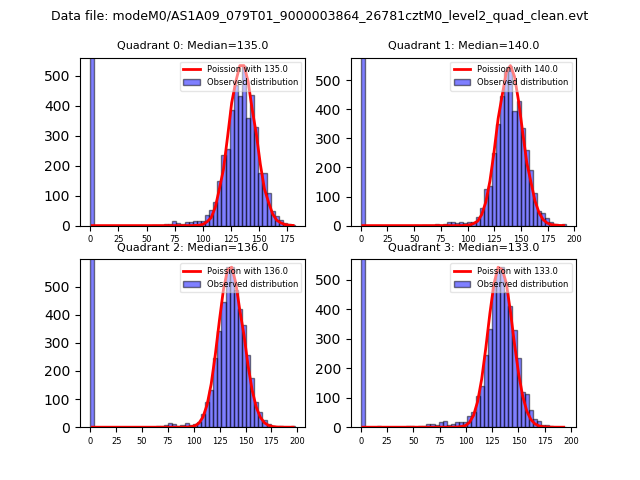 |
 |
| Quadrant-wise count rates Data is divided into 100 sec bins |
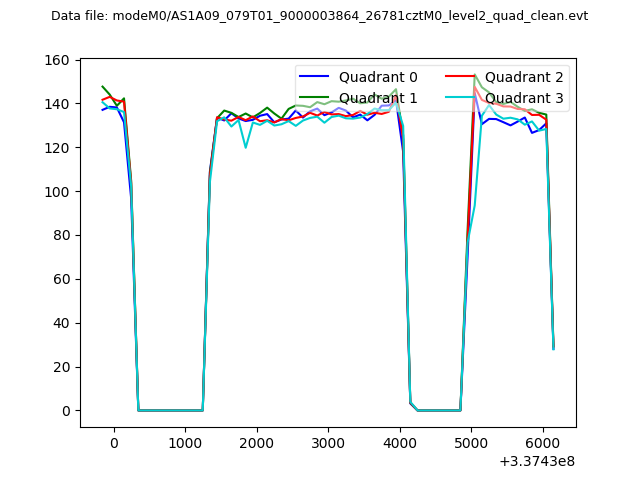 |
|
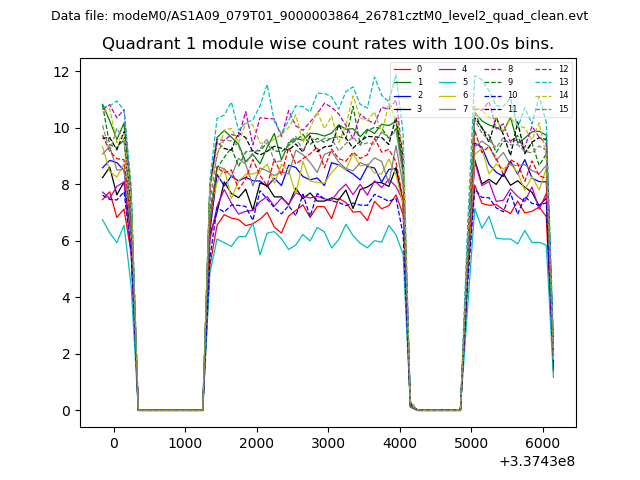
| Module-wise count rates for Quadrant A Data is divided into 100 sec bins |
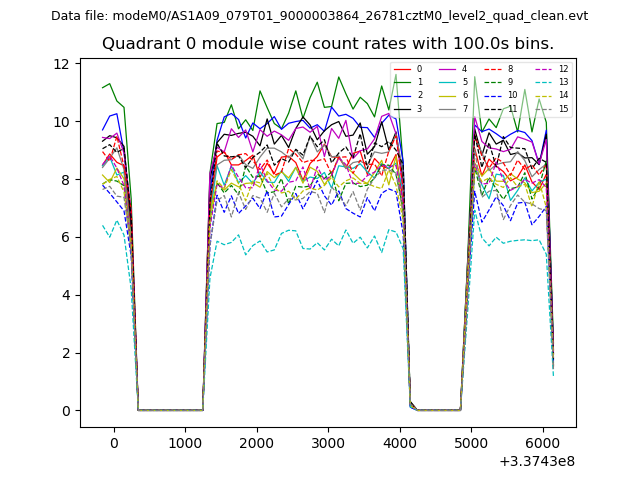 |
 |
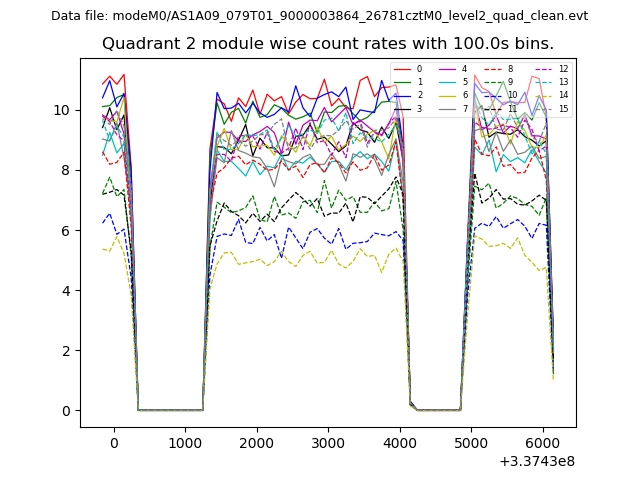
| Module-wise count rates for Quadrant B Data is divided into 100 sec bins |
 |
 |
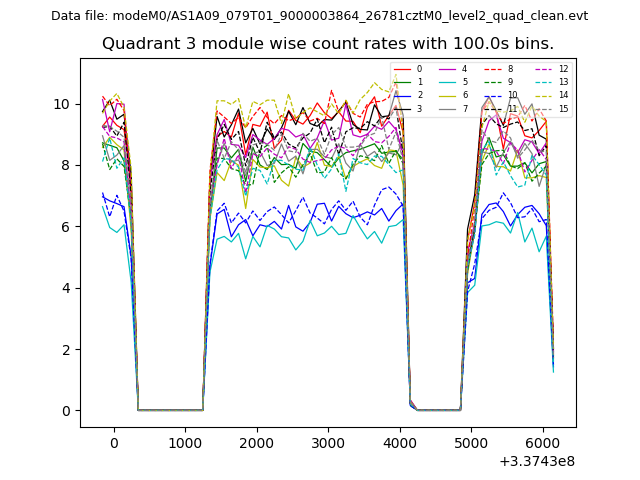
| Module-wise count rates for Quadrant C Data is divided into 100 sec bins |
 |
 |
| Module-wise count rates for Quadrant D Data is divided into 100 sec bins |
 |
 |
| Parameter | Plot |
|---|---|
| CZT HV Monitor | 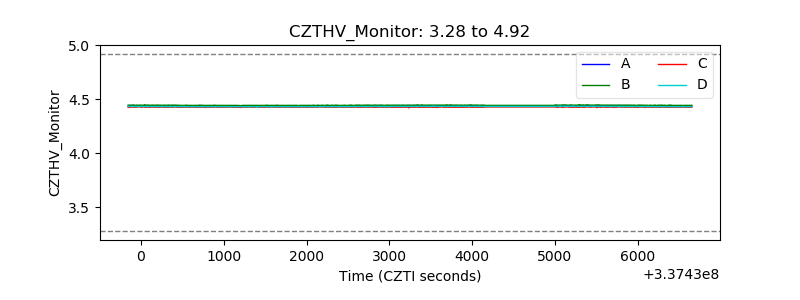 |
| D_VDD | 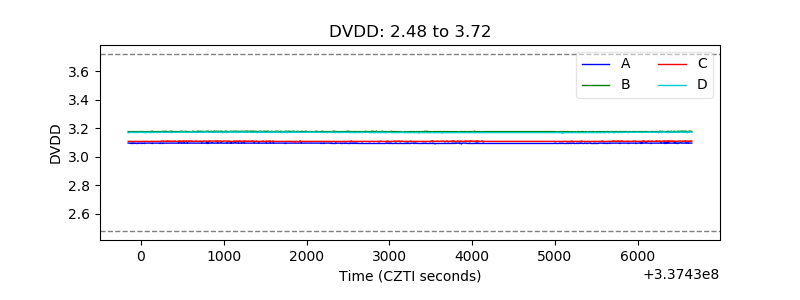 |
| Temperature 1 | 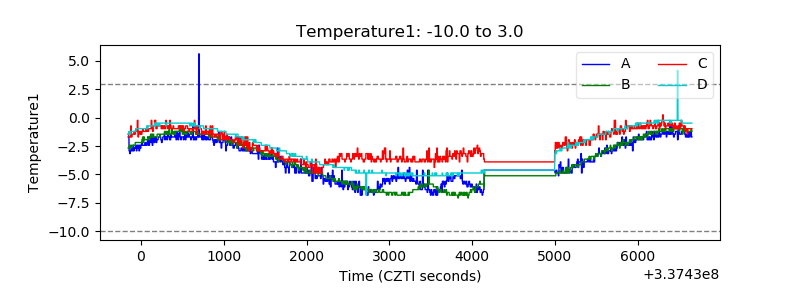 |
| Veto HV Monitor | 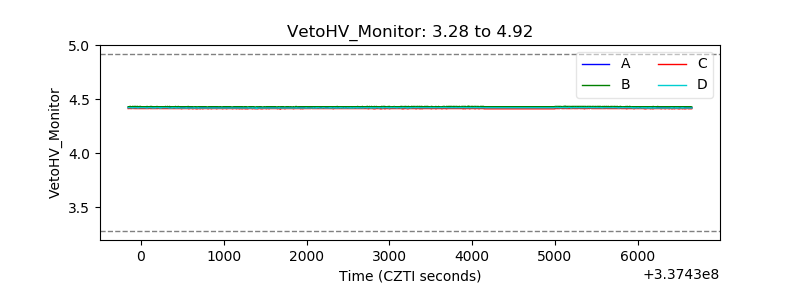 |
| Veto LLD | 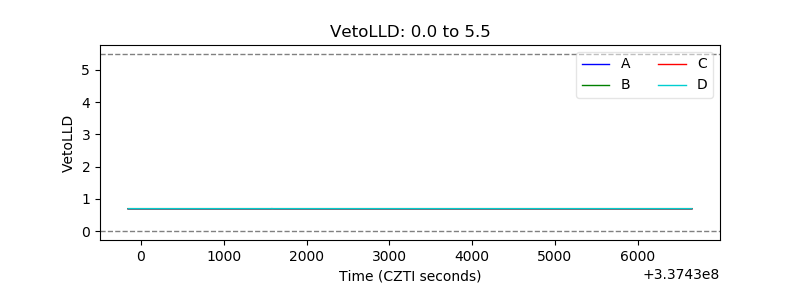 |
| Alpha Counter | 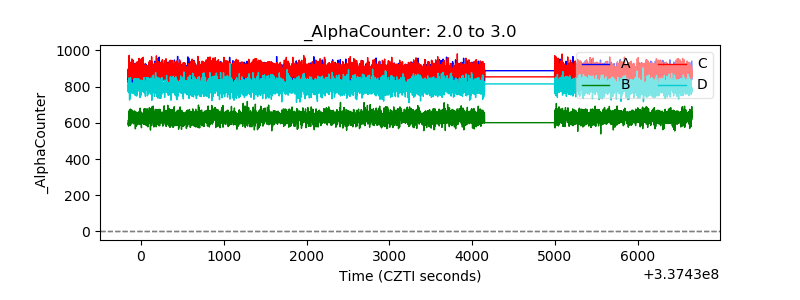 |
| _CPM_Rate | 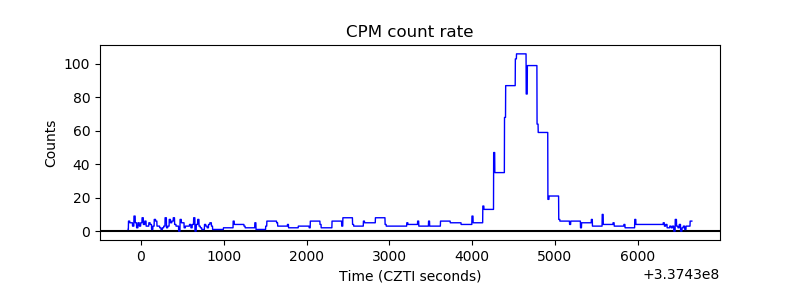 |
| CZT Counter | 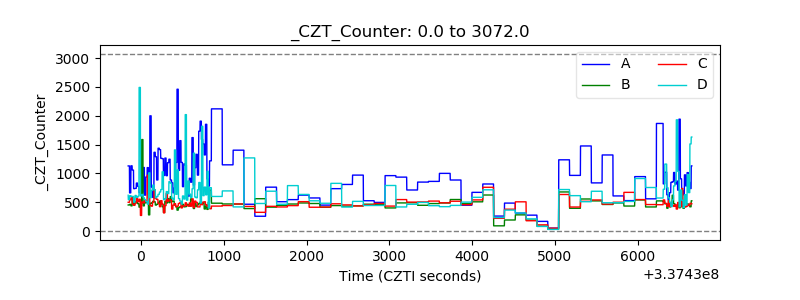 |
| +2.5 Volts monitor |  |
| +5 Volts monitor |  |
| _ROLL_ROT |  |
| _Roll_DEC | 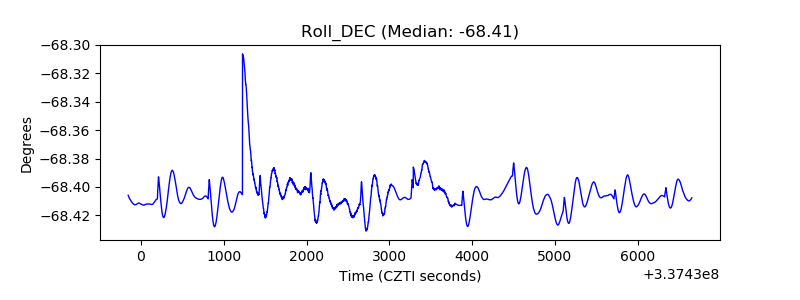 |
| _Roll_RA | 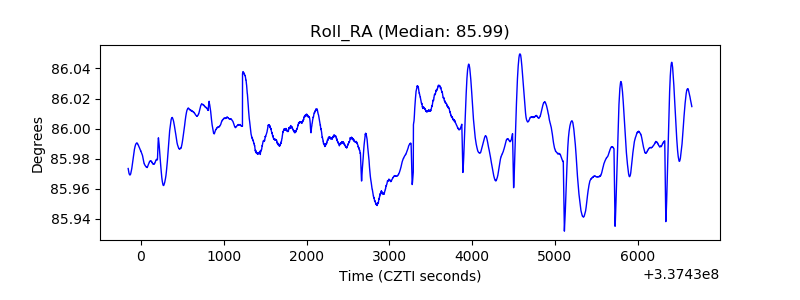 |
| Veto Counter | 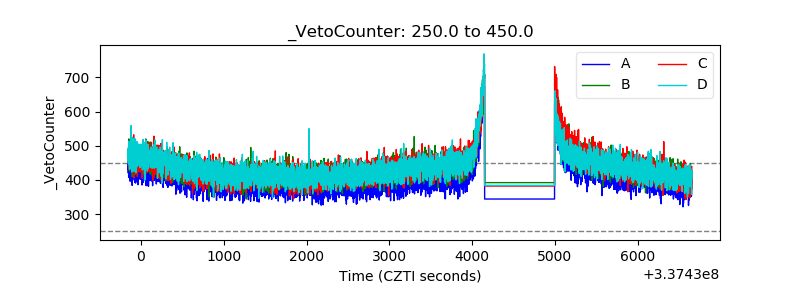 |