| Param | Original file | Final file |
|---|---|---|
| Filename | modeM0/AS1A09_079T01_9000003864_26782cztM0_level2.evt | modeM0/AS1A09_079T01_9000003864_26782cztM0_level2_quad_clean.evt |
| Size (bytes) | 591,451,200 | 102,297,600 |
| Size | 564.1 MB | 97.6 MB |
| Events in quadrant A | 4,812,565 | 657,624 |
| Events in quadrant B | 3,360,369 | 676,359 |
| Events in quadrant C | 3,487,639 | 659,362 |
| Events in quadrant D | 5,779,675 | 618,990 |
| Mode M9 | |||
|---|---|---|---|
| Quadrant | BADHDUFLAG | Total packets | Discarded packets |
| A | 0 | 3 | 0 |
| B | 0 | 3 | 0 |
| C | 0 | 3 | 0 |
| D | 0 | 3 | 0 |
| Mode M0 | |||
|---|---|---|---|
| Quadrant | BADHDUFLAG | Total packets | Discarded packets |
| A | 0 | 18928 | 0 |
| B | 0 | 14443 | 0 |
| C | 0 | 14757 | 0 |
| D | 0 | 21806 | 0 |
| Quadrant | Total seconds | Saturated seconds | Saturation percentage |
|---|---|---|---|
| A | 6963 | 240 | 3.446790% |
| B | 6964 | 184 | 2.642160% |
| C | 6964 | 217 | 3.116025% |
| D | 6964 | 630 | 9.046525% |
Noise dominated data is calculated using 1-second bins in cleaned event files. If a bin has >2000 counts, and if more than 50% of those come from <1% of pixels, then it is considered to be noise-dominated and hence unusable.
| Quadrant | # 1 sec bins | Bins with >0 counts | Bins with >2000 counts | High rate bins dominated by noise | Noise dominated (total time) | Noise dominated (detector-on time) | Marked lightcurve |
|---|---|---|---|---|---|---|---|
| A | 7308 | 6964 | 41 | 41 | 0.56% | 0.59% | 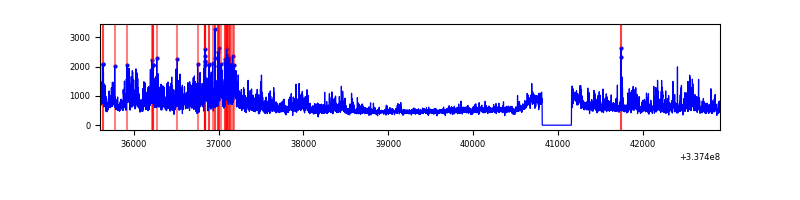 |
| B | 7309 | 6965 | 1 | 1 | 0.01% | 0.01% | 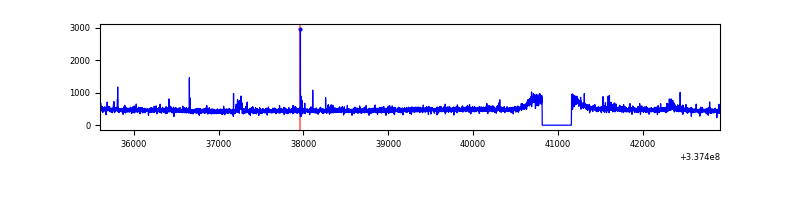 |
| C | 7309 | 6965 | 8 | 8 | 0.11% | 0.11% | 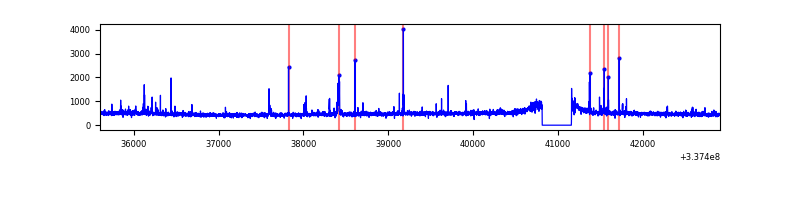 |
| D | 7309 | 6965 | 370 | 370 | 5.06% | 5.31% | 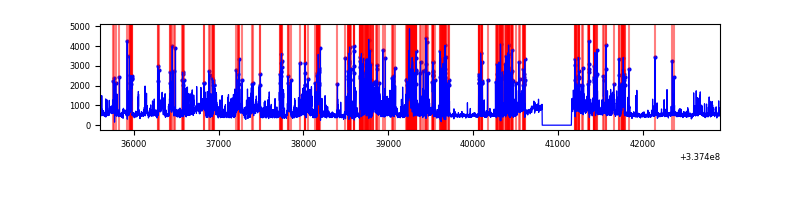 |
Top three noisy pixels from each quadrant. If the there are fewer than three noisy pixels in the level2.evt file, extra rows are filled as -1
| Pixel properties | Quadrant properties | ||||||
|---|---|---|---|---|---|---|---|
| Quadrant | DetID | PixID | Counts | Sigma | Mean | Median | Sigma |
| A | 0 | 13 | 1414303 | 8365.67 | 846 | 827 | 169.0 |
| A | 9 | 130 | 90828 | 532.67 | 846 | 827 | 169.0 |
| A | 12 | 96 | 41882 | 242.98 | 846 | 827 | 169.0 |
| B | 12 | 111 | 19334 | 115.76 | 843 | 821 | 159.9 |
| B | 11 | 111 | 17514 | 104.38 | 843 | 821 | 159.9 |
| B | 14 | 111 | 15328 | 90.71 | 843 | 821 | 159.9 |
| C | 14 | 238 | 132842 | 688.92 | 822 | 827 | 191.6 |
| C | 2 | 16 | 95896 | 496.12 | 822 | 827 | 191.6 |
| C | 15 | 208 | 34639 | 176.45 | 822 | 827 | 191.6 |
| D | 7 | 80 | 1237722 | 6360.44 | 810 | 791 | 194.5 |
| D | 1 | 52 | 836308 | 4296.33 | 810 | 791 | 194.5 |
| D | 1 | 239 | 256708 | 1315.96 | 810 | 791 | 194.5 |
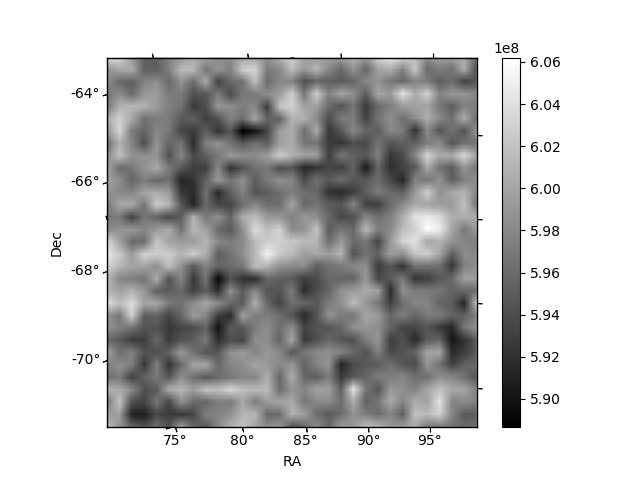
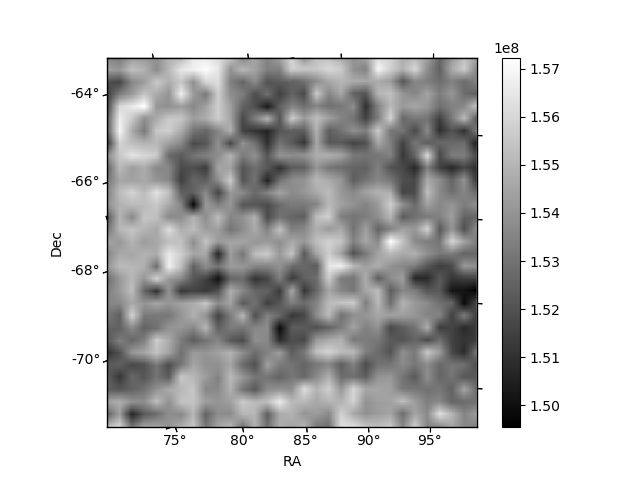
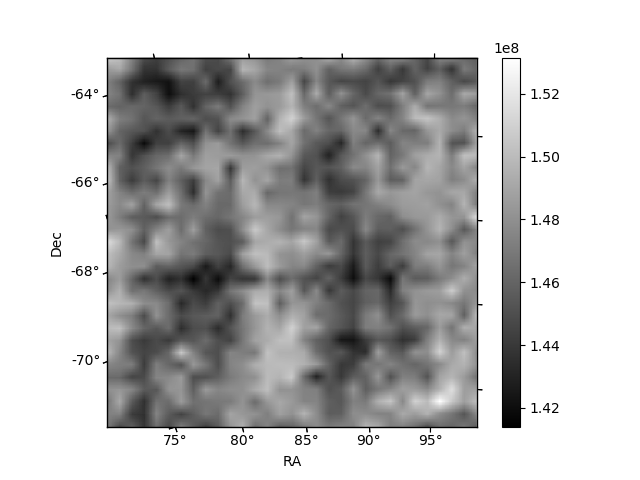
Histogram calculated using DETX and DETY for each event in the final _common_clean file
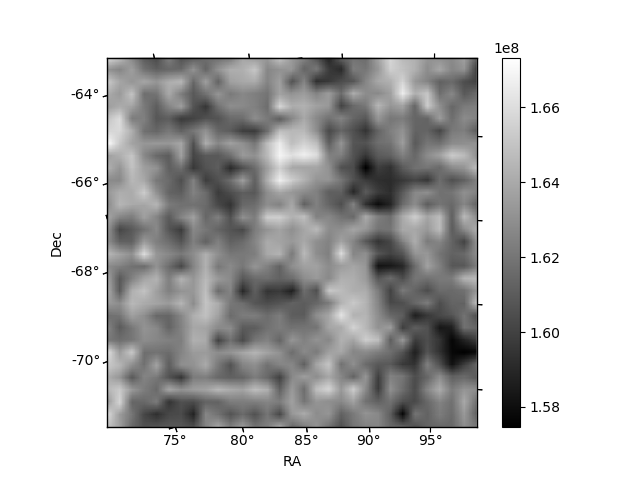
| Quadrant A | 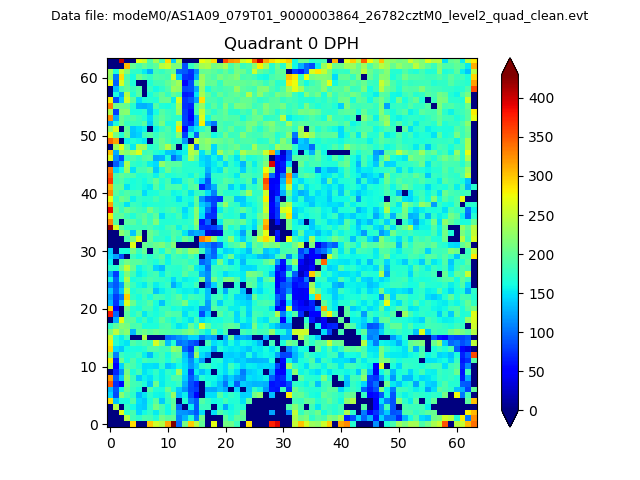 |
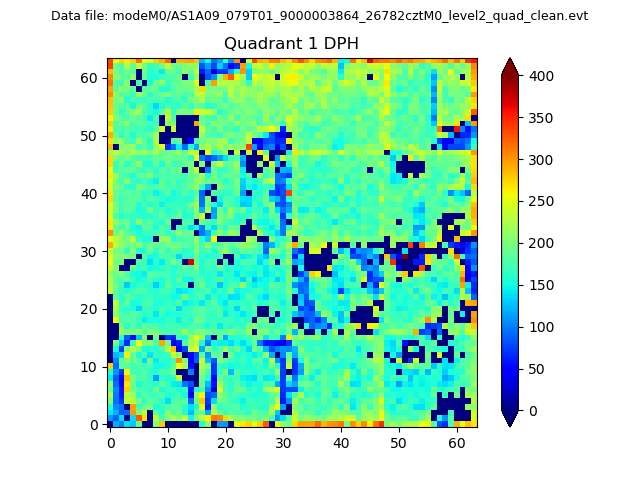 |
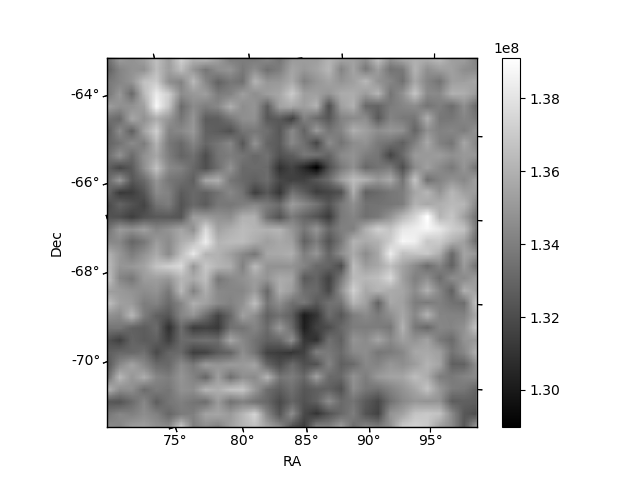
Quadrant B |
|---|---|---|---|
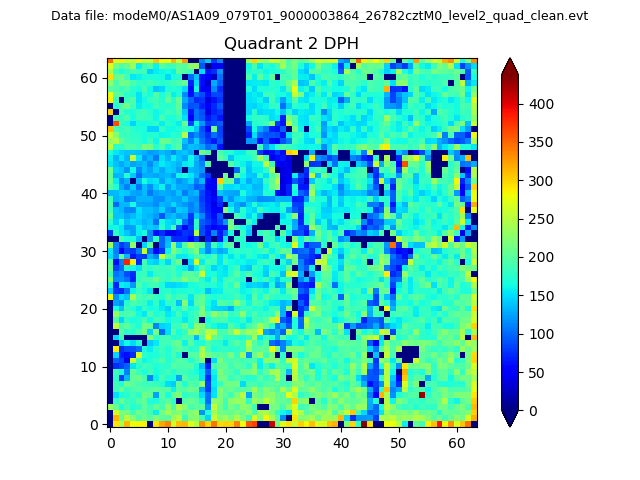
| Quadrant D | 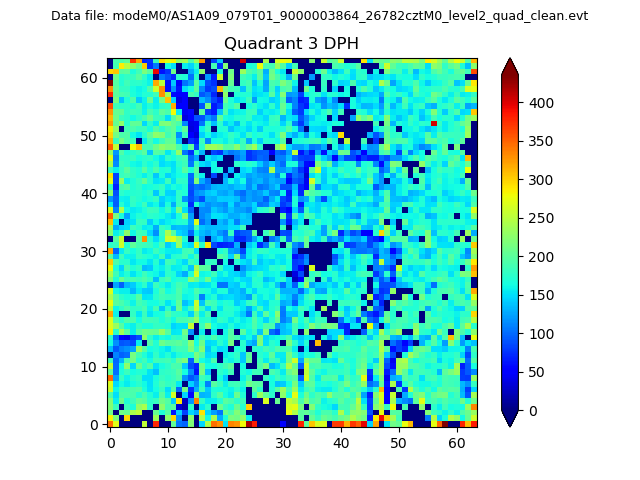 |
 |
Quadrant C |
| Plot type | Count rate plots | Images |
|---|---|---|
| Comparison with Poisson distribution Blue bars denote a histogram of data divided into 1 sec bins. Red curve is a Poisson curve with rate = median count rate of data. |
 |
 |
| Quadrant-wise count rates Data is divided into 100 sec bins |
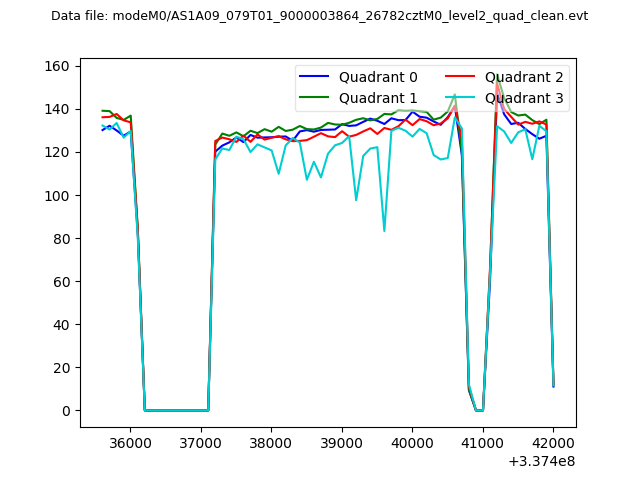 |
|
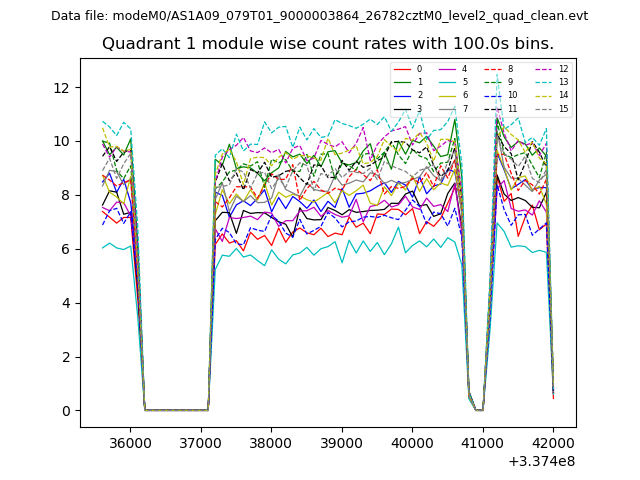
| Module-wise count rates for Quadrant A Data is divided into 100 sec bins |
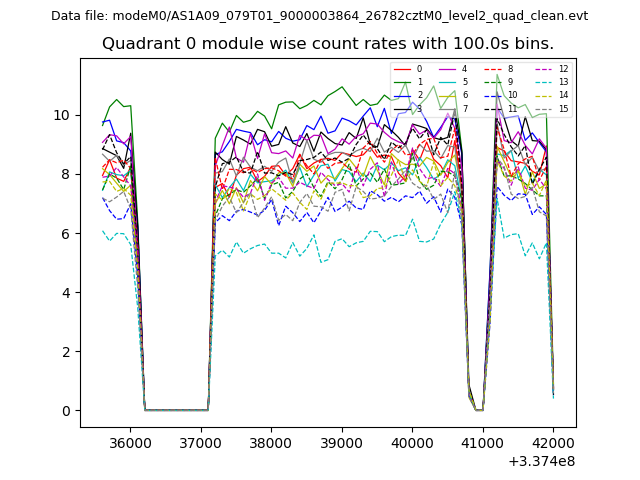 |
 |
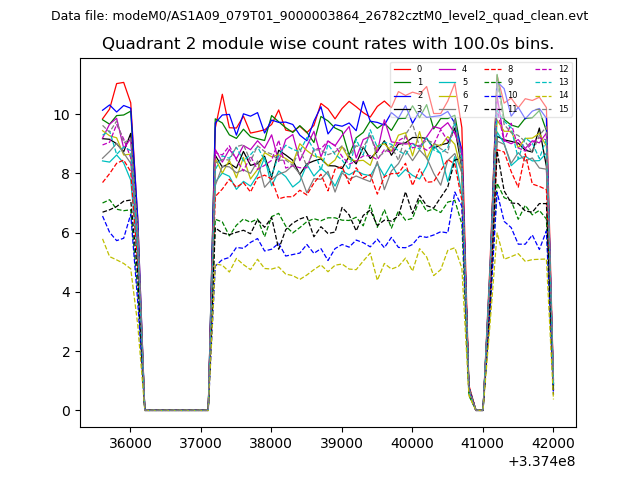
| Module-wise count rates for Quadrant B Data is divided into 100 sec bins |
 |
 |
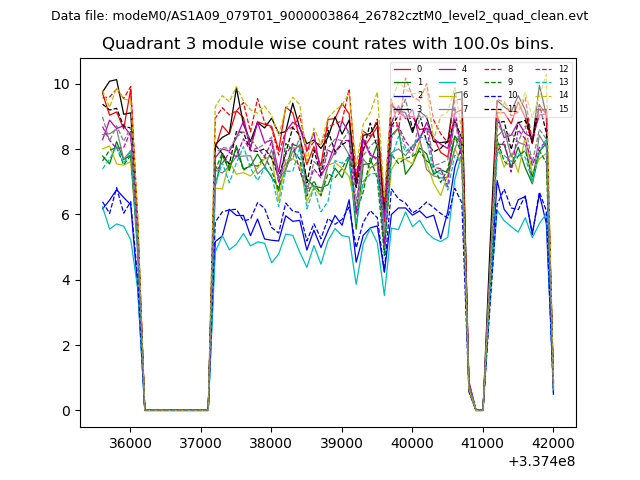
| Module-wise count rates for Quadrant C Data is divided into 100 sec bins |
 |
 |
| Module-wise count rates for Quadrant D Data is divided into 100 sec bins |
 |
 |
| Parameter | Plot |
|---|---|
| CZT HV Monitor | 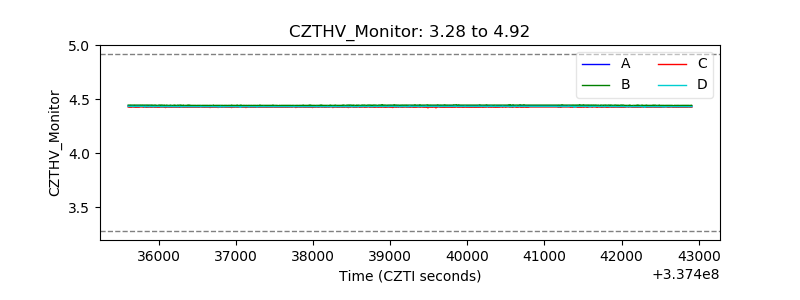 |
| D_VDD | 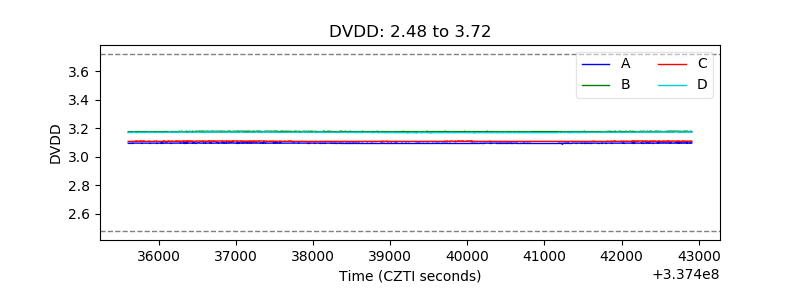 |
| Temperature 1 | 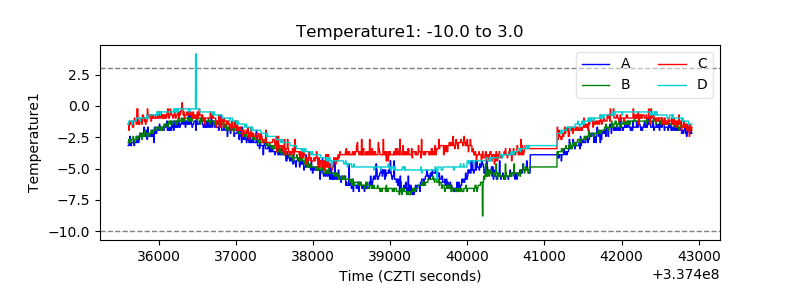 |
| Veto HV Monitor | 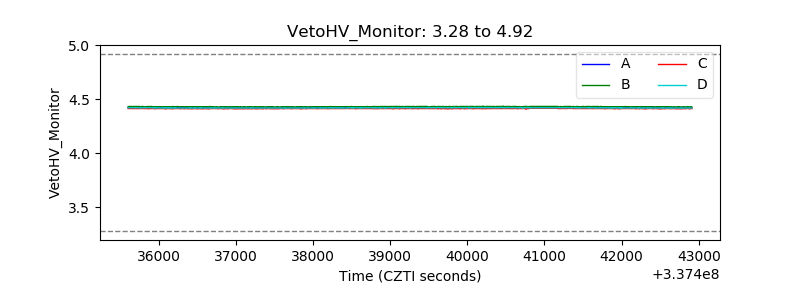 |
| Veto LLD | 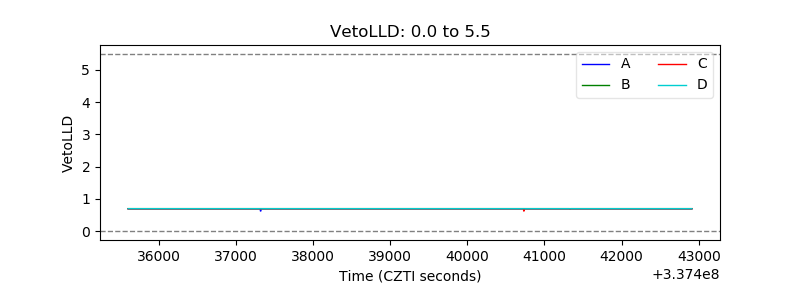 |
| Alpha Counter | 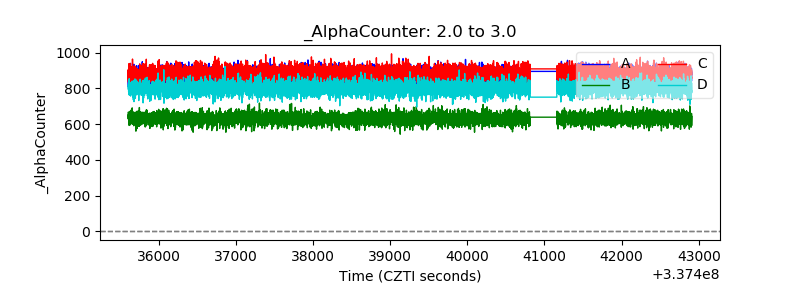 |
| _CPM_Rate | 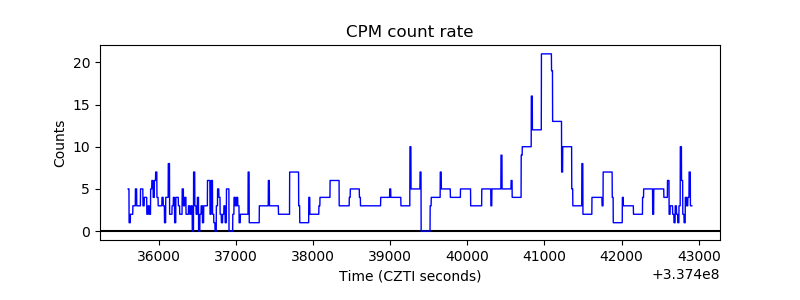 |
| CZT Counter | 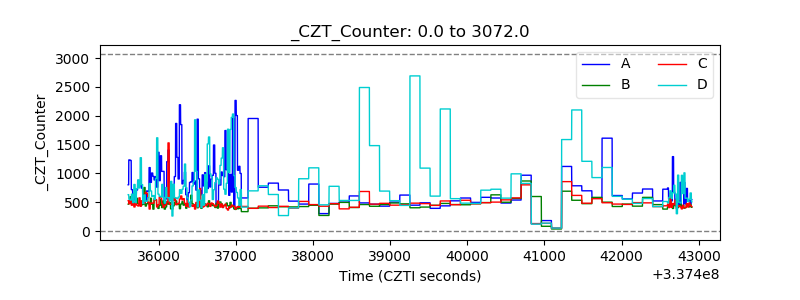 |
| +2.5 Volts monitor |  |
| +5 Volts monitor |  |
| _ROLL_ROT | 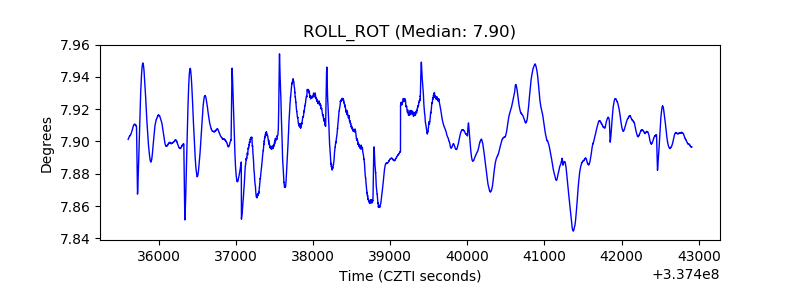 |
| _Roll_DEC |  |
| _Roll_RA | 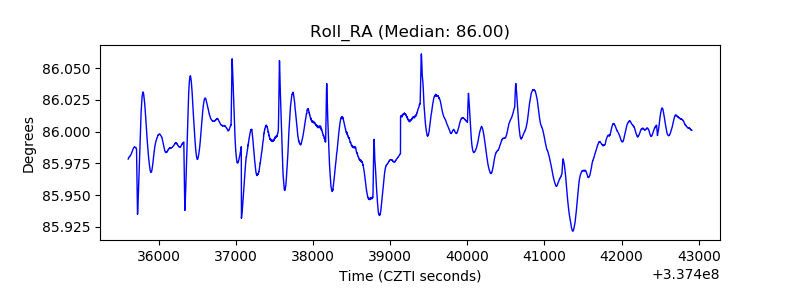 |
| Veto Counter | 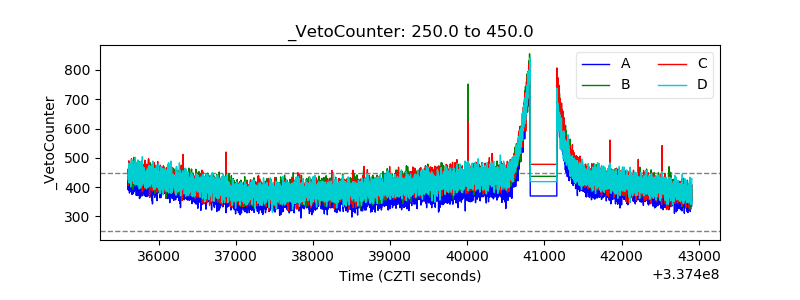 |