| Param | Original file | Final file |
|---|---|---|
| Filename | modeM0/AS1A09_079T01_9000003864_26783cztM0_level2.evt | modeM0/AS1A09_079T01_9000003864_26783cztM0_level2_quad_clean.evt |
| Size (bytes) | 540,910,080 | 97,056,000 |
| Size | 515.9 MB | 92.6 MB |
| Events in quadrant A | 4,115,722 | 618,865 |
| Events in quadrant B | 3,303,992 | 631,164 |
| Events in quadrant C | 3,374,802 | 613,001 |
| Events in quadrant D | 5,121,243 | 597,595 |
| Mode M9 | |||
|---|---|---|---|
| Quadrant | BADHDUFLAG | Total packets | Discarded packets |
| A | 0 | 2 | 0 |
| B | 0 | 2 | 0 |
| C | 0 | 2 | 0 |
| D | 0 | 2 | 0 |
| Mode M0 | |||
|---|---|---|---|
| Quadrant | BADHDUFLAG | Total packets | Discarded packets |
| A | 0 | 16632 | 0 |
| B | 0 | 14285 | 0 |
| C | 0 | 14504 | 0 |
| D | 0 | 19700 | 0 |
| Quadrant | Total seconds | Saturated seconds | Saturation percentage |
|---|---|---|---|
| A | 6870 | 138 | 2.008734% |
| B | 6871 | 161 | 2.343181% |
| C | 6870 | 183 | 2.663755% |
| D | 6870 | 397 | 5.778748% |
Noise dominated data is calculated using 1-second bins in cleaned event files. If a bin has >2000 counts, and if more than 50% of those come from <1% of pixels, then it is considered to be noise-dominated and hence unusable.
| Quadrant | # 1 sec bins | Bins with >0 counts | Bins with >2000 counts | High rate bins dominated by noise | Noise dominated (total time) | Noise dominated (detector-on time) | Marked lightcurve |
|---|---|---|---|---|---|---|---|
| A | 7070 | 6871 | 7 | 7 | 0.10% | 0.10% | 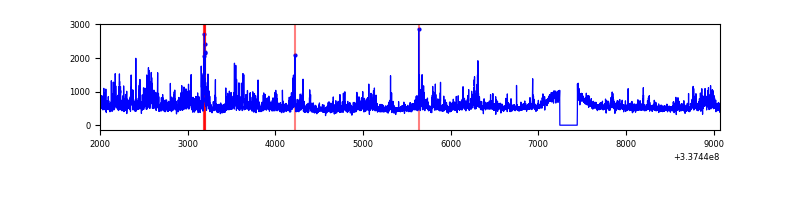 |
| B | 7071 | 6872 | 3 | 3 | 0.04% | 0.04% | 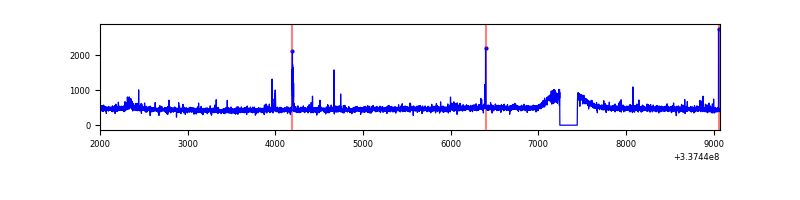 |
| C | 7070 | 6871 | 10 | 10 | 0.14% | 0.15% | 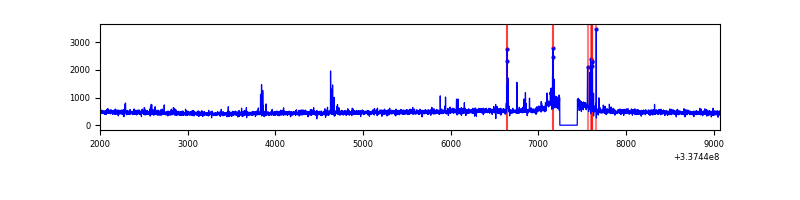 |
| D | 7070 | 6871 | 244 | 244 | 3.45% | 3.55% | 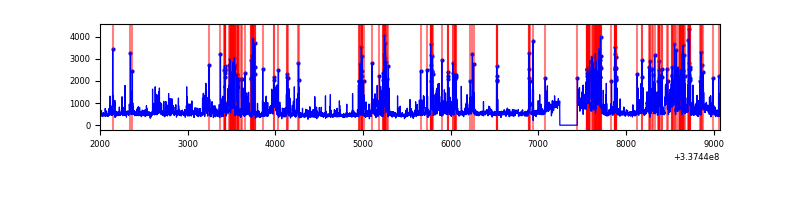 |
Top three noisy pixels from each quadrant. If the there are fewer than three noisy pixels in the level2.evt file, extra rows are filled as -1
| Pixel properties | Quadrant properties | ||||||
|---|---|---|---|---|---|---|---|
| Quadrant | DetID | PixID | Counts | Sigma | Mean | Median | Sigma |
| A | 0 | 13 | 873618 | 5239.22 | 831 | 812 | 166.6 |
| A | 12 | 96 | 31071 | 181.64 | 831 | 812 | 166.6 |
| A | 13 | 254 | 11721 | 65.48 | 831 | 812 | 166.6 |
| B | 0 | 229 | 25516 | 156.91 | 827 | 804 | 157.5 |
| B | 12 | 111 | 19096 | 116.14 | 827 | 804 | 157.5 |
| B | 11 | 111 | 16807 | 101.61 | 827 | 804 | 157.5 |
| C | 14 | 238 | 127955 | 683.82 | 800 | 804 | 185.9 |
| C | 2 | 16 | 78005 | 415.19 | 800 | 804 | 185.9 |
| C | 15 | 208 | 50180 | 265.54 | 800 | 804 | 185.9 |
| D | 7 | 80 | 976205 | 4963.01 | 804 | 782 | 196.5 |
| D | 1 | 52 | 658512 | 3346.57 | 804 | 782 | 196.5 |
| D | 2 | 250 | 334098 | 1695.93 | 804 | 782 | 196.5 |
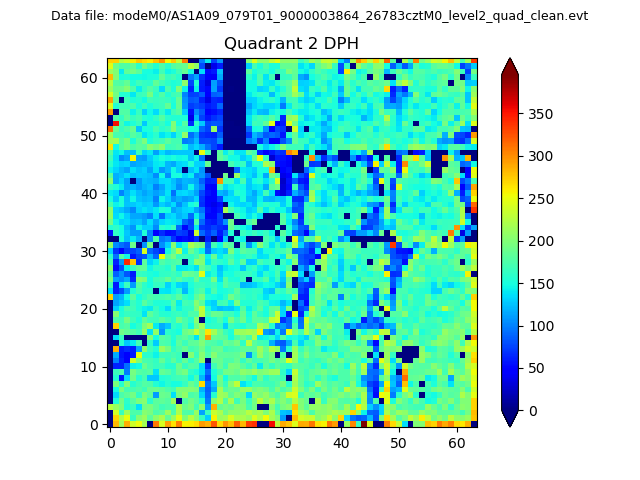
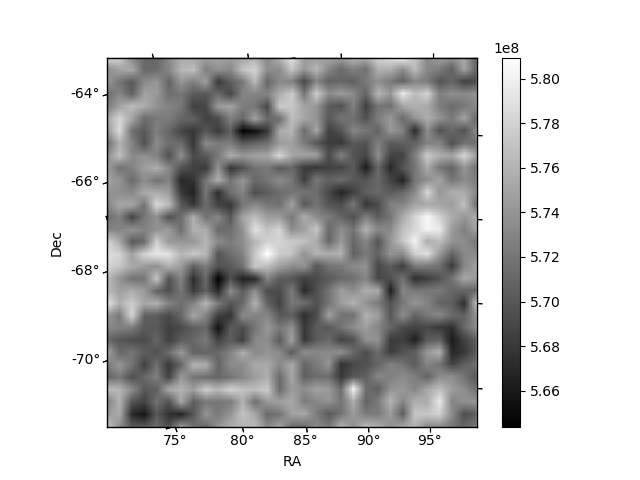
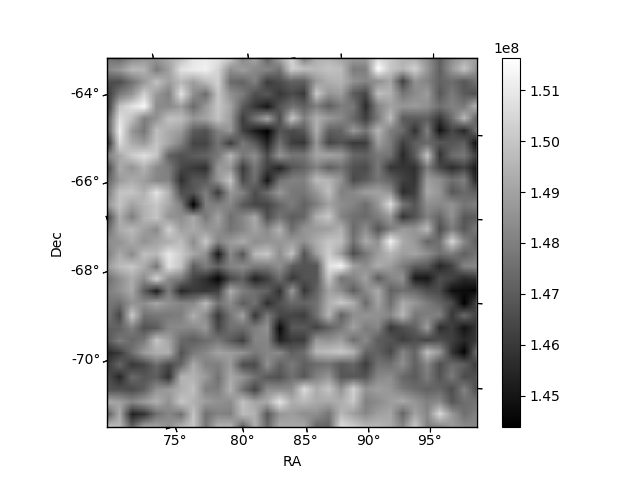
Histogram calculated using DETX and DETY for each event in the final _common_clean file
| Quadrant A | 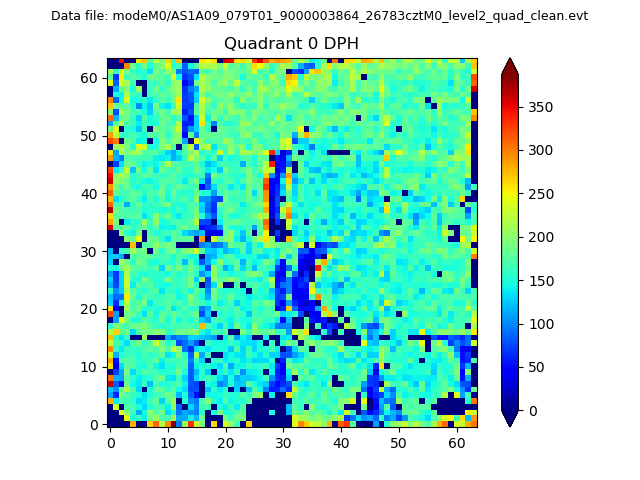 |
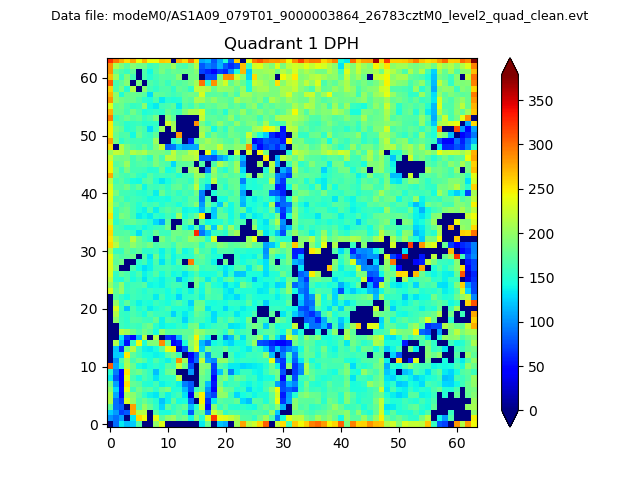 |
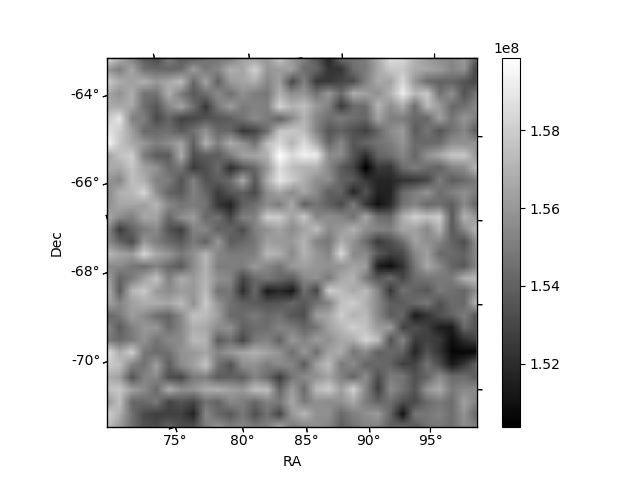
Quadrant B |
|---|---|---|---|
| Quadrant D | 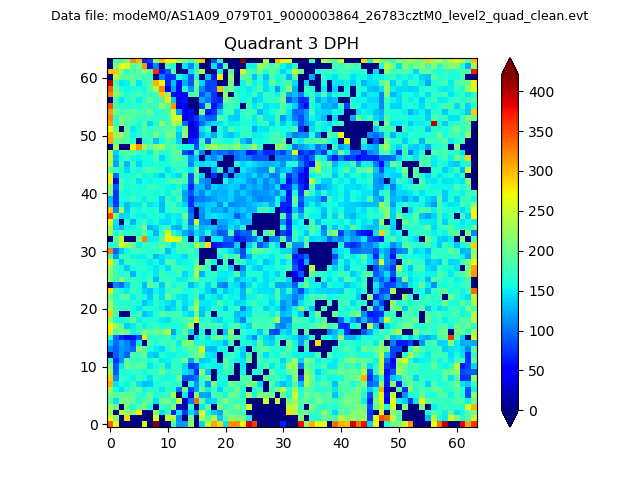 |
 |
Quadrant C |
| Plot type | Count rate plots | Images |
|---|---|---|
| Comparison with Poisson distribution Blue bars denote a histogram of data divided into 1 sec bins. Red curve is a Poisson curve with rate = median count rate of data. |
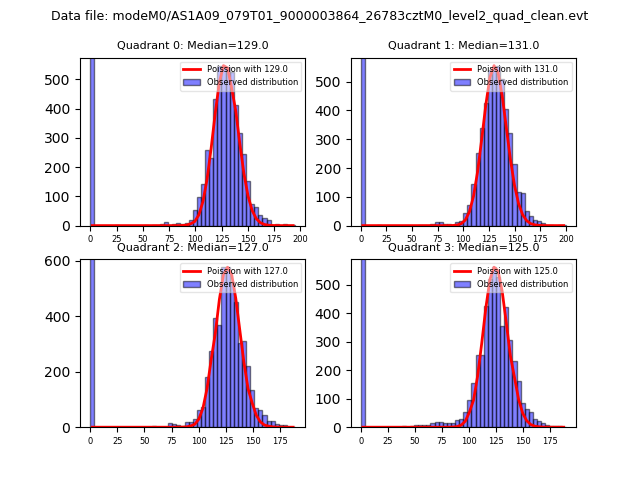 |
 |
| Quadrant-wise count rates Data is divided into 100 sec bins |
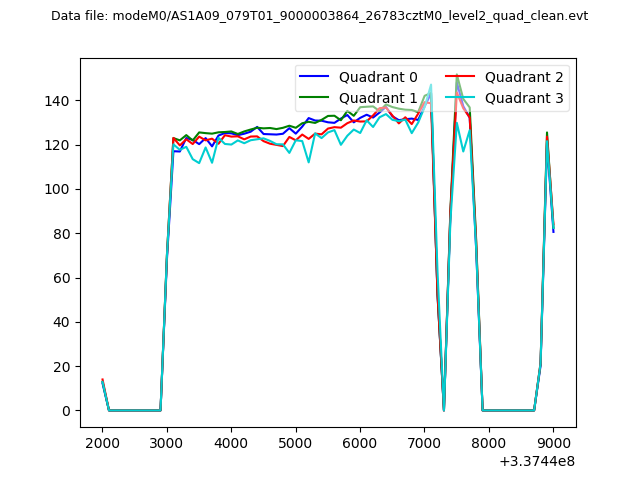 |
|
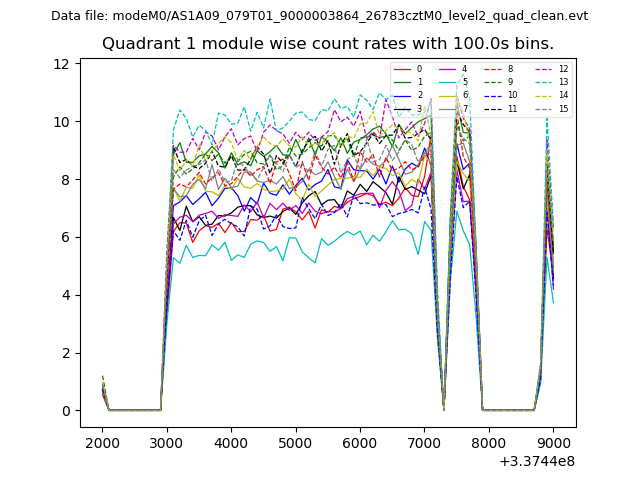
| Module-wise count rates for Quadrant A Data is divided into 100 sec bins |
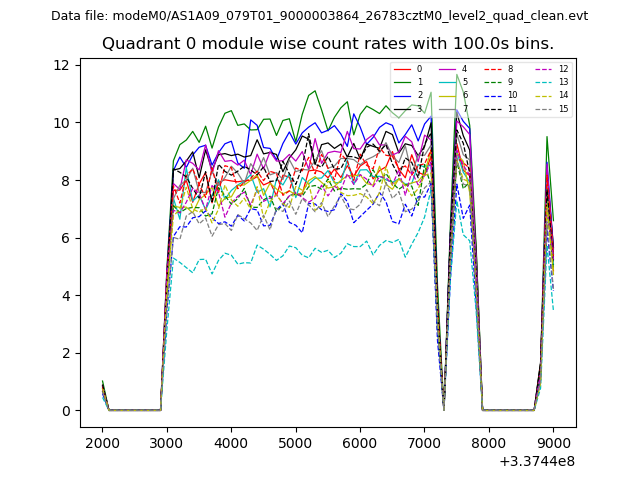 |
 |
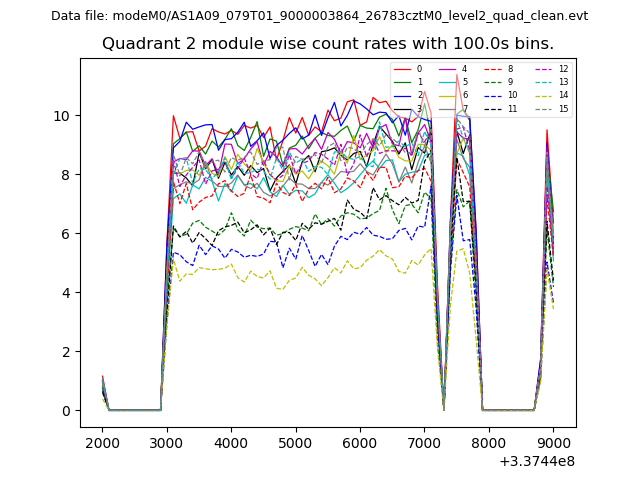
| Module-wise count rates for Quadrant B Data is divided into 100 sec bins |
 |
 |
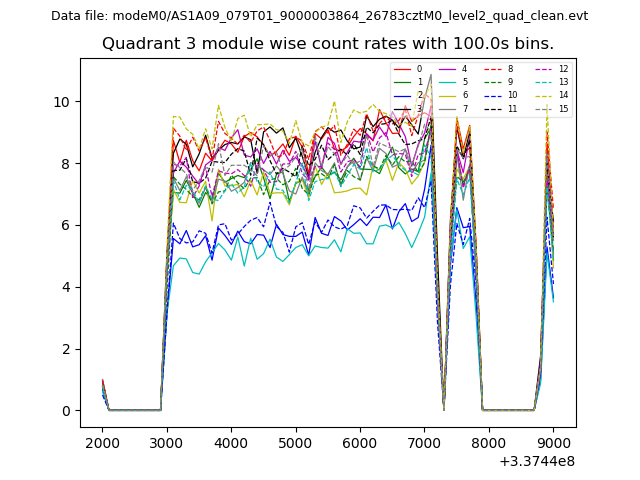
| Module-wise count rates for Quadrant C Data is divided into 100 sec bins |
 |
 |
| Module-wise count rates for Quadrant D Data is divided into 100 sec bins |
 |
 |
| Parameter | Plot |
|---|---|
| CZT HV Monitor | 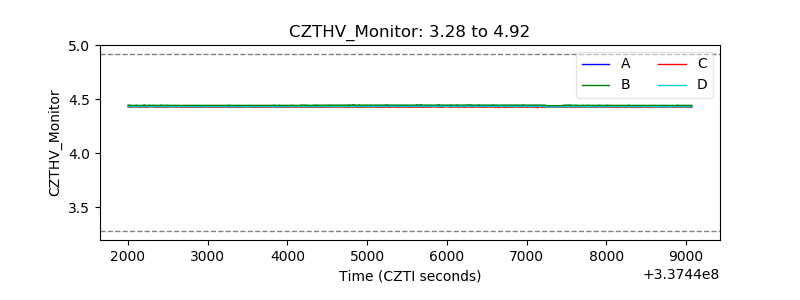 |
| D_VDD | 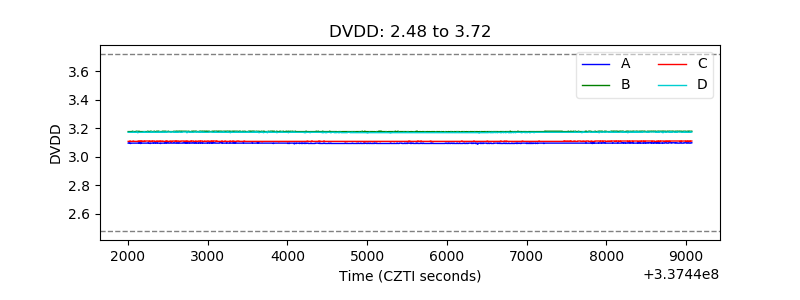 |
| Temperature 1 |  |
| Veto HV Monitor | 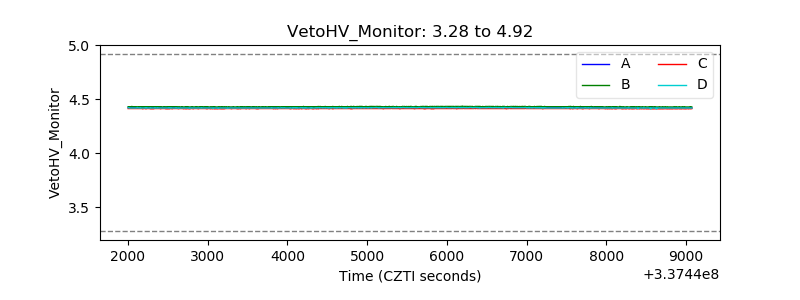 |
| Veto LLD | 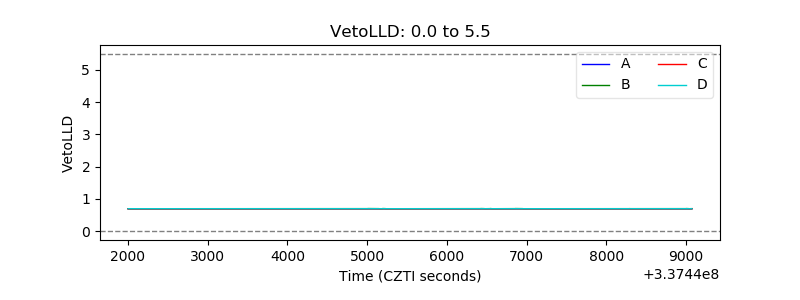 |
| Alpha Counter | 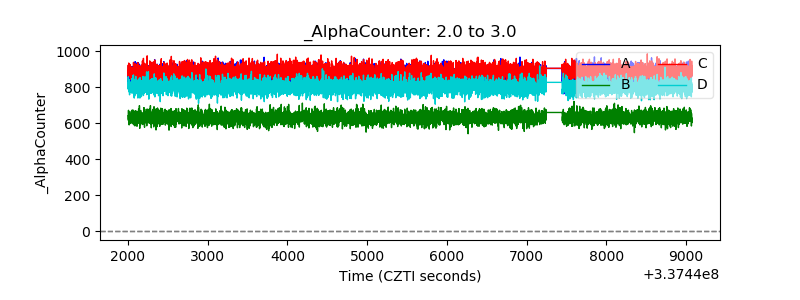 |
| _CPM_Rate | 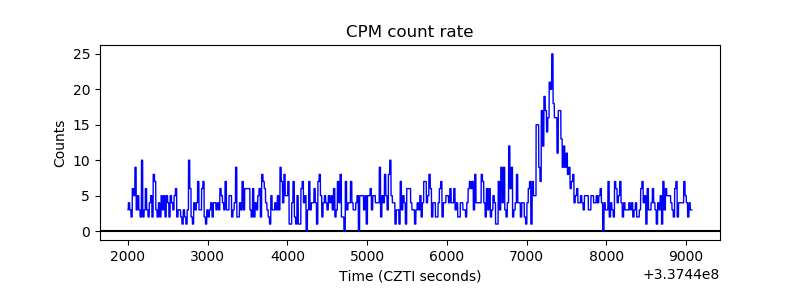 |
| CZT Counter | 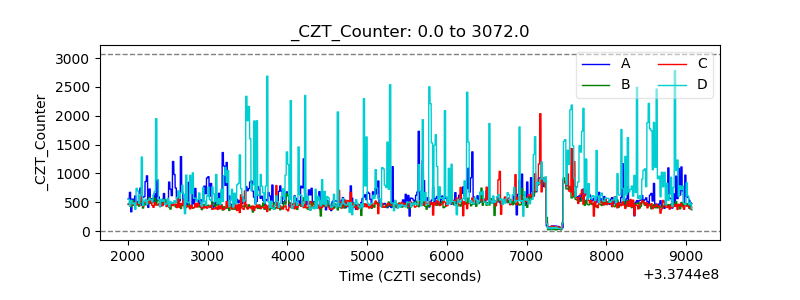 |
| +2.5 Volts monitor |  |
| +5 Volts monitor |  |
| _ROLL_ROT |  |
| _Roll_DEC | 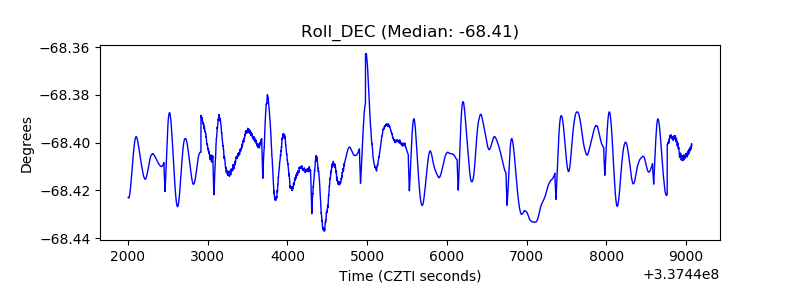 |
| _Roll_RA | 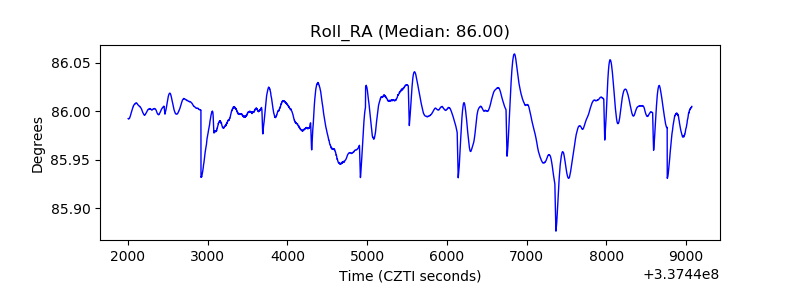 |
| Veto Counter | 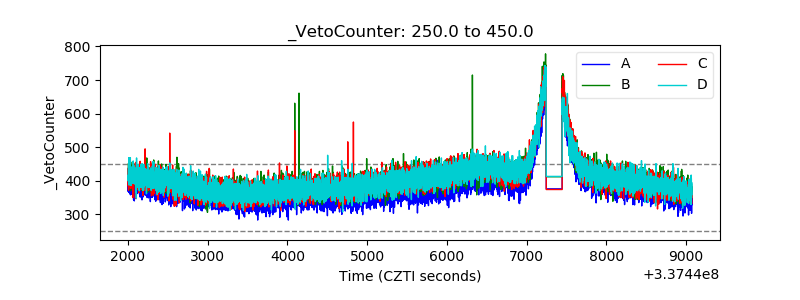 |