| Param | Original file | Final file |
|---|---|---|
| Filename | modeM0/AS1A09_079T01_9000003864_26784cztM0_level2.evt | modeM0/AS1A09_079T01_9000003864_26784cztM0_level2_quad_clean.evt |
| Size (bytes) | 624,286,080 | 105,390,720 |
| Size | 595.4 MB | 100.5 MB |
| Events in quadrant A | 3,931,361 | 682,641 |
| Events in quadrant B | 3,458,839 | 693,873 |
| Events in quadrant C | 3,502,025 | 674,445 |
| Events in quadrant D | 7,518,707 | 631,019 |
| Mode M9 | |||
|---|---|---|---|
| Quadrant | BADHDUFLAG | Total packets | Discarded packets |
| A | 0 | 4 | 0 |
| B | 0 | 4 | 0 |
| C | 0 | 4 | 0 |
| D | 0 | 4 | 0 |
| Mode M0 | |||
|---|---|---|---|
| Quadrant | BADHDUFLAG | Total packets | Discarded packets |
| A | 0 | 16320 | 0 |
| B | 0 | 14979 | 0 |
| C | 0 | 15173 | 0 |
| D | 0 | 27316 | 0 |
| Quadrant | Total seconds | Saturated seconds | Saturation percentage |
|---|---|---|---|
| A | 7322 | 67 | 0.915051% |
| B | 7322 | 65 | 0.887736% |
| C | 7322 | 92 | 1.256487% |
| D | 7321 | 870 | 11.883622% |
Noise dominated data is calculated using 1-second bins in cleaned event files. If a bin has >2000 counts, and if more than 50% of those come from <1% of pixels, then it is considered to be noise-dominated and hence unusable.
| Quadrant | # 1 sec bins | Bins with >0 counts | Bins with >2000 counts | High rate bins dominated by noise | Noise dominated (total time) | Noise dominated (detector-on time) | Marked lightcurve |
|---|---|---|---|---|---|---|---|
| A | 7727 | 7323 | 4 | 4 | 0.05% | 0.05% | 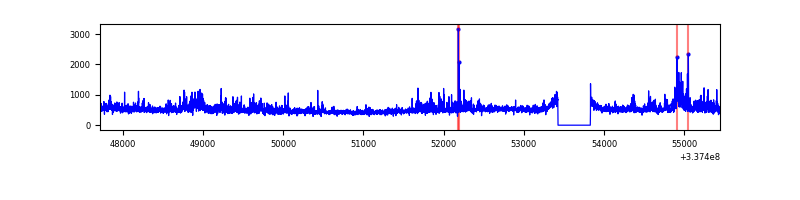 |
| B | 7727 | 7323 | 3 | 3 | 0.04% | 0.04% | 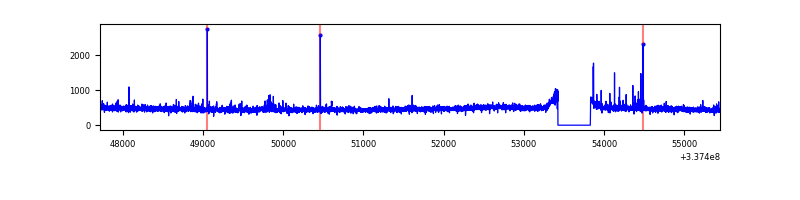 |
| C | 7727 | 7323 | 4 | 4 | 0.05% | 0.05% | 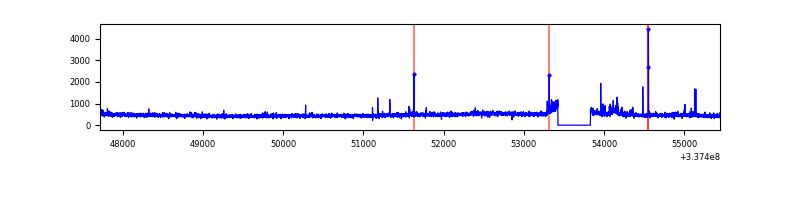 |
| D | 7726 | 7322 | 682 | 682 | 8.83% | 9.31% | 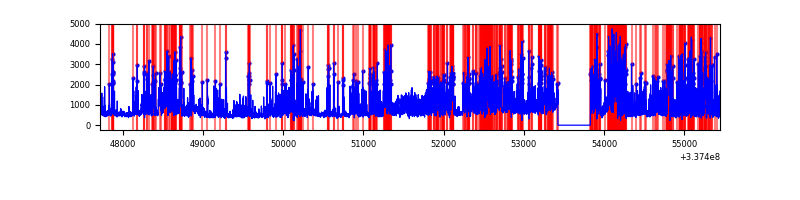 |
Top three noisy pixels from each quadrant. If the there are fewer than three noisy pixels in the level2.evt file, extra rows are filled as -1
| Pixel properties | Quadrant properties | ||||||
|---|---|---|---|---|---|---|---|
| Quadrant | DetID | PixID | Counts | Sigma | Mean | Median | Sigma |
| A | 0 | 13 | 538710 | 3063.68 | 871 | 851 | 175.6 |
| A | 12 | 96 | 31941 | 177.09 | 871 | 851 | 175.6 |
| A | 13 | 254 | 12596 | 66.9 | 871 | 851 | 175.6 |
| B | 3 | 64 | 22257 | 130.28 | 866 | 844 | 164.4 |
| B | 12 | 111 | 19647 | 114.4 | 866 | 844 | 164.4 |
| B | 10 | 246 | 19265 | 112.07 | 866 | 844 | 164.4 |
| C | 14 | 238 | 134426 | 686.04 | 838 | 843 | 194.7 |
| C | 2 | 16 | 69371 | 351.94 | 838 | 843 | 194.7 |
| C | 0 | 207 | 22527 | 111.36 | 838 | 843 | 194.7 |
| D | 1 | 52 | 3555730 | 17437.98 | 813 | 792 | 203.9 |
| D | 2 | 250 | 552751 | 2707.52 | 813 | 792 | 203.9 |
| D | 7 | 80 | 222756 | 1088.8 | 813 | 792 | 203.9 |
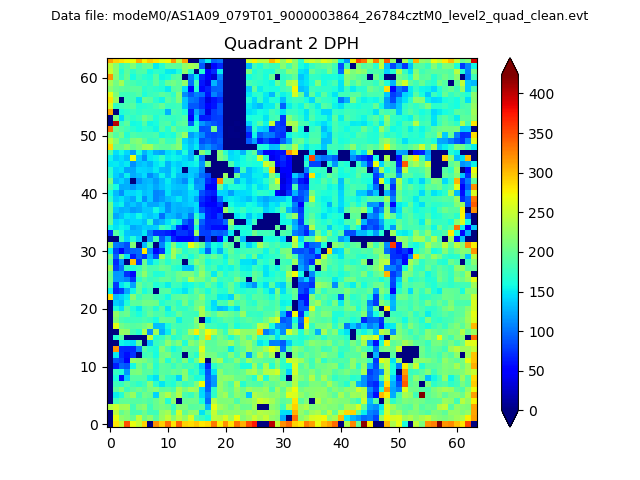
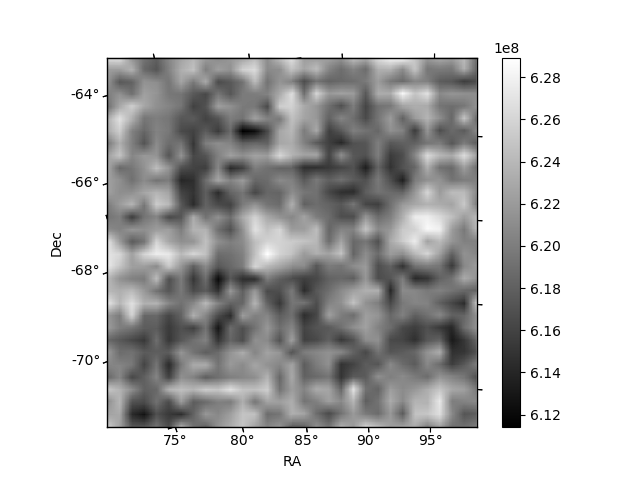
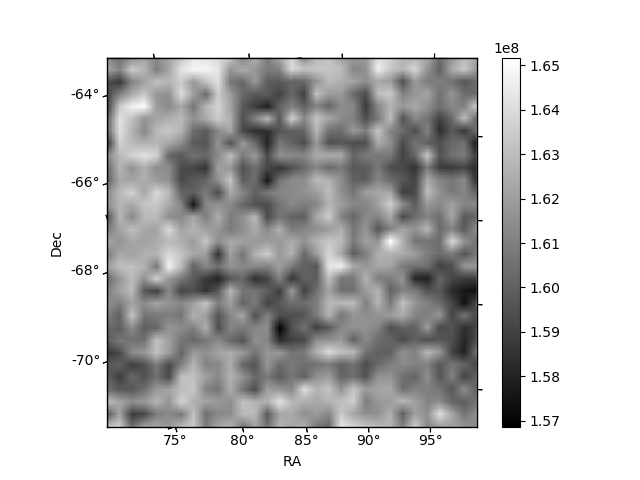
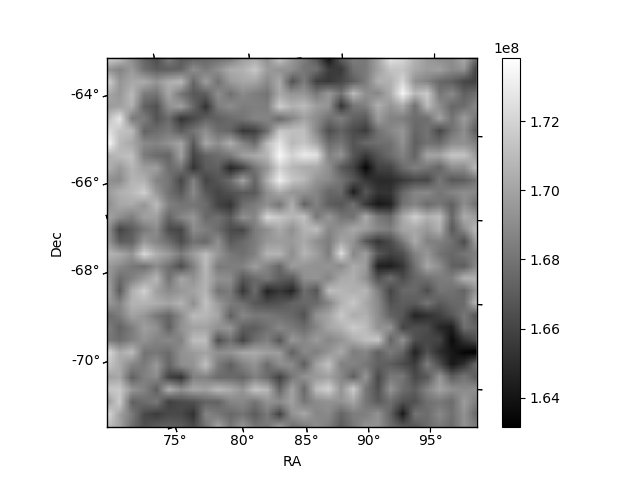
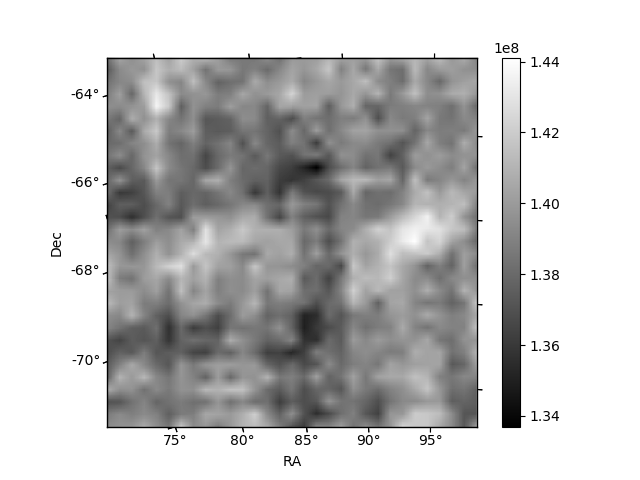
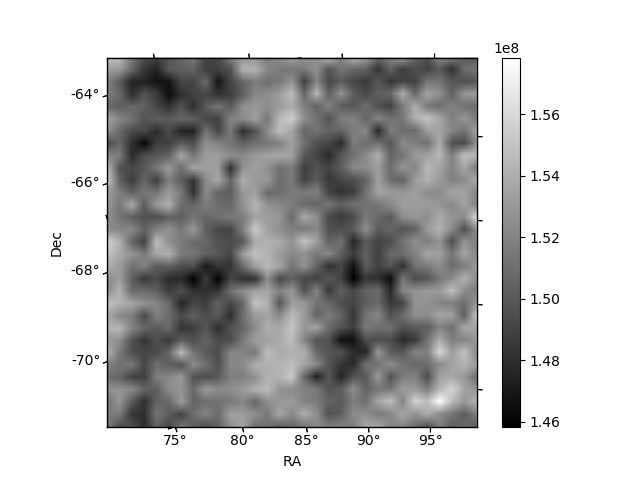
Histogram calculated using DETX and DETY for each event in the final _common_clean file
| Quadrant A | 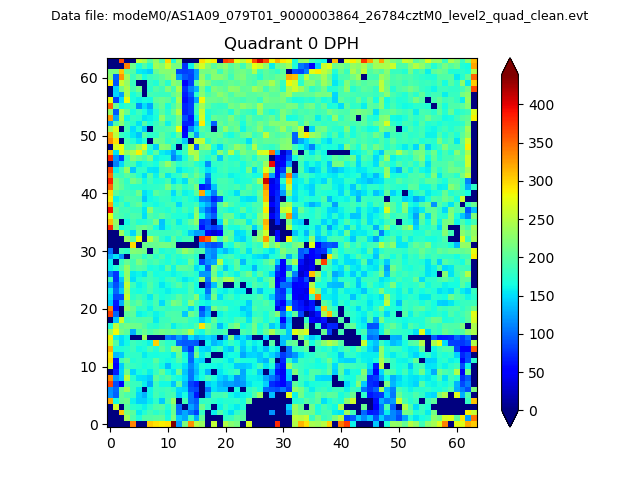 |
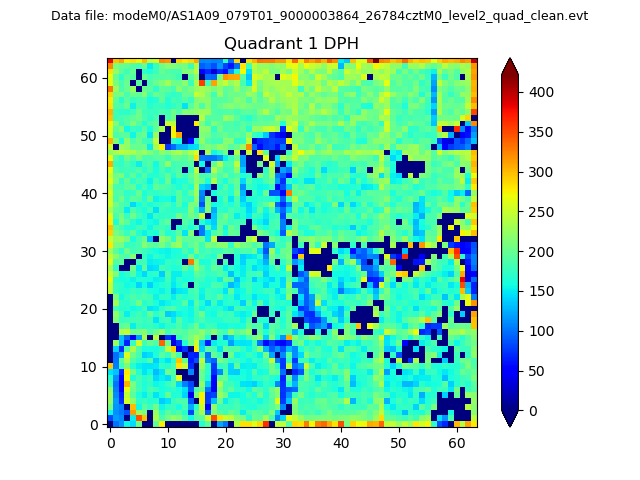 |
Quadrant B |
|---|---|---|---|
| Quadrant D | 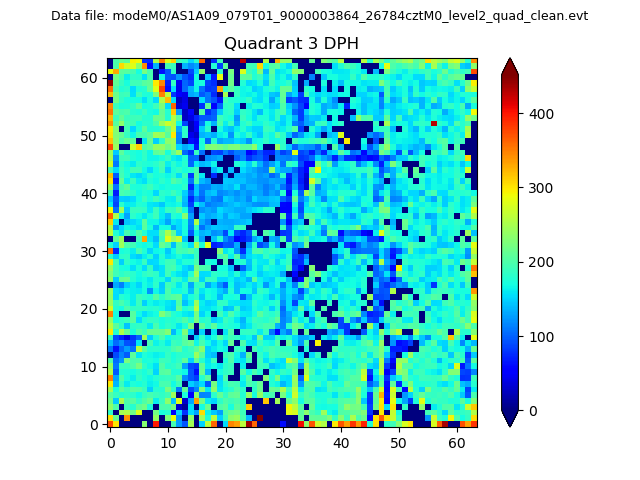 |
 |
Quadrant C |
| Plot type | Count rate plots | Images |
|---|---|---|
| Comparison with Poisson distribution Blue bars denote a histogram of data divided into 1 sec bins. Red curve is a Poisson curve with rate = median count rate of data. |
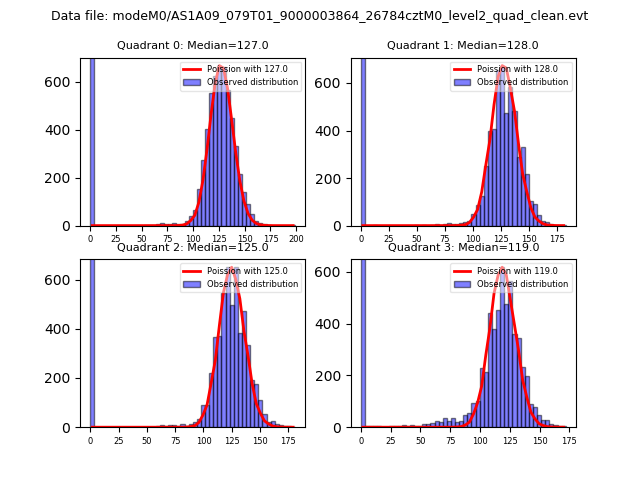 |
 |
| Quadrant-wise count rates Data is divided into 100 sec bins |
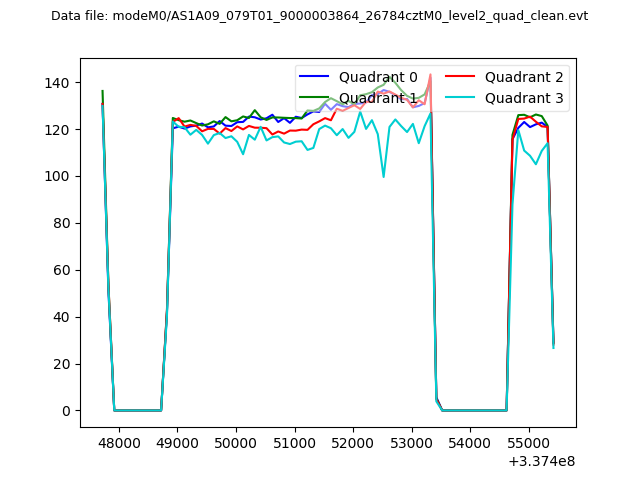 |
|
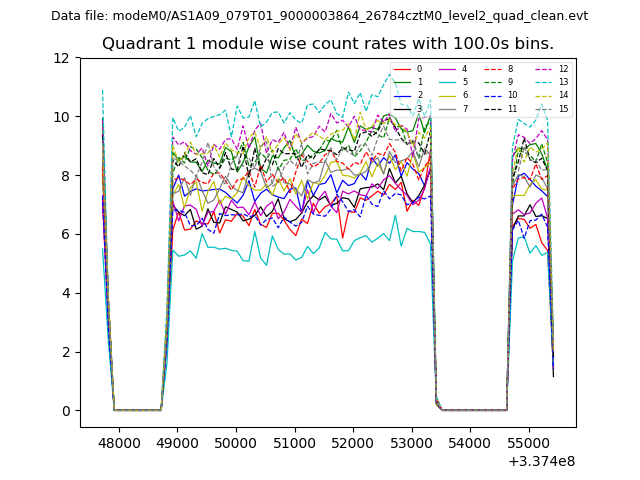
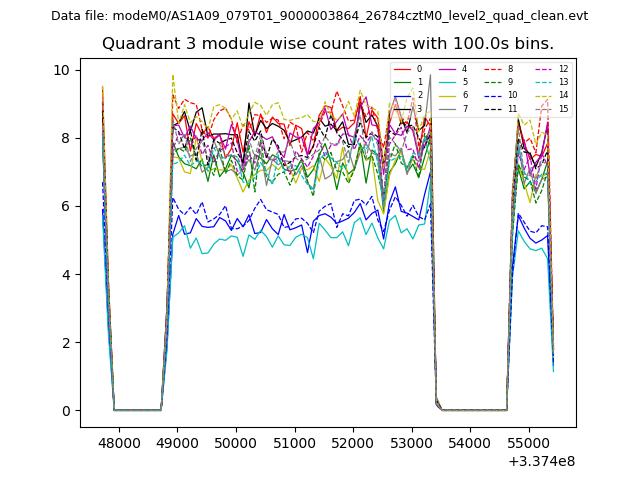
| Module-wise count rates for Quadrant A Data is divided into 100 sec bins |
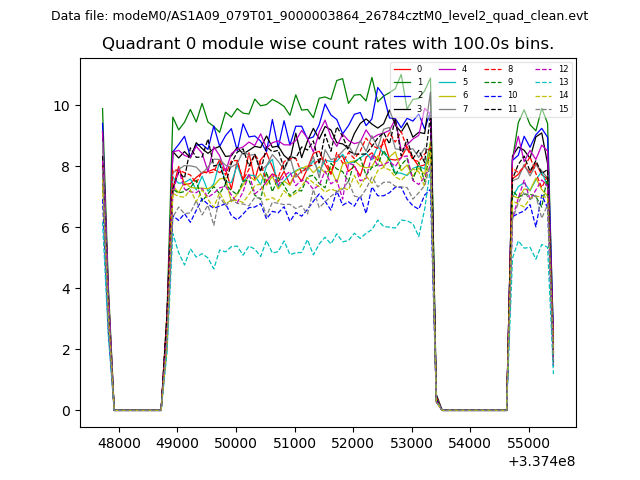 |
 |
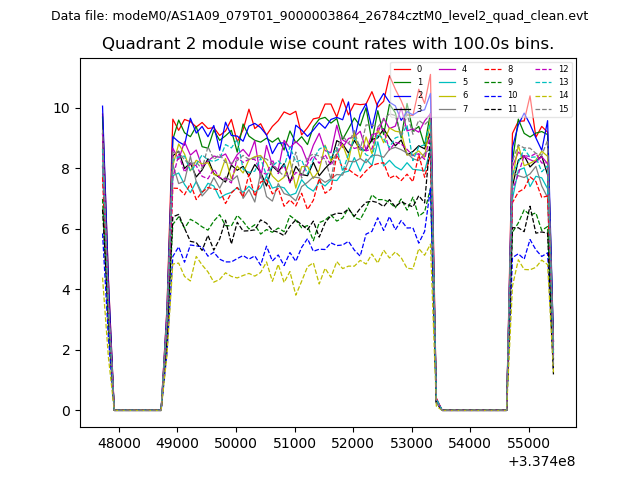
| Module-wise count rates for Quadrant B Data is divided into 100 sec bins |
 |
 |
| Module-wise count rates for Quadrant C Data is divided into 100 sec bins |
 |
 |
| Module-wise count rates for Quadrant D Data is divided into 100 sec bins |
 |
 |
| Parameter | Plot |
|---|---|
| CZT HV Monitor | 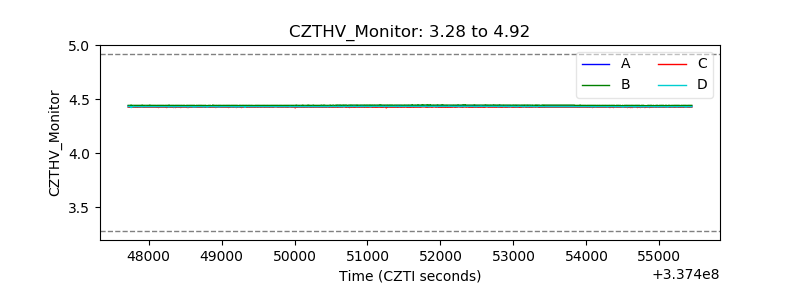 |
| D_VDD | 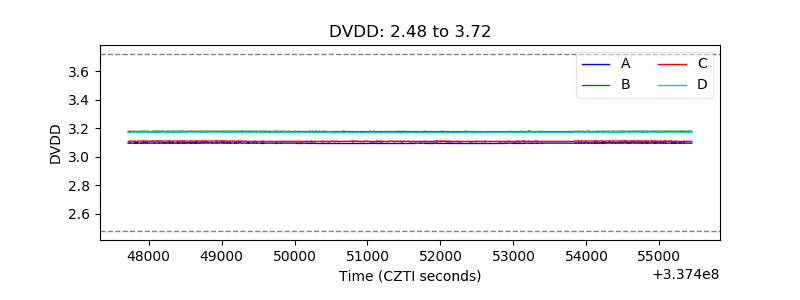 |
| Temperature 1 |  |
| Veto HV Monitor | 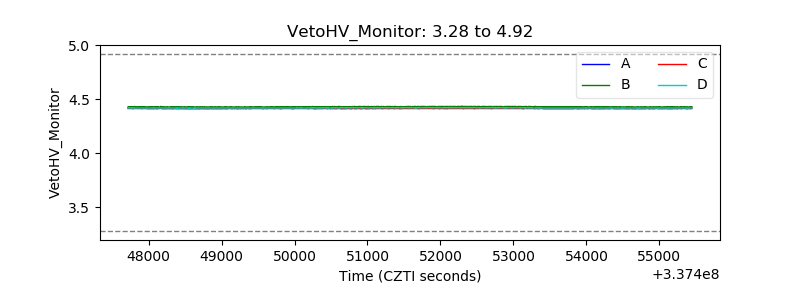 |
| Veto LLD | 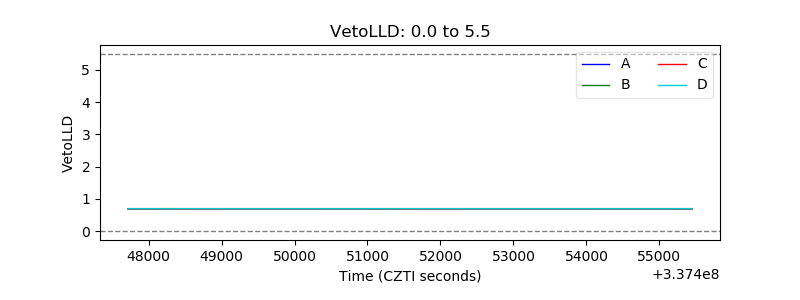 |
| Alpha Counter | 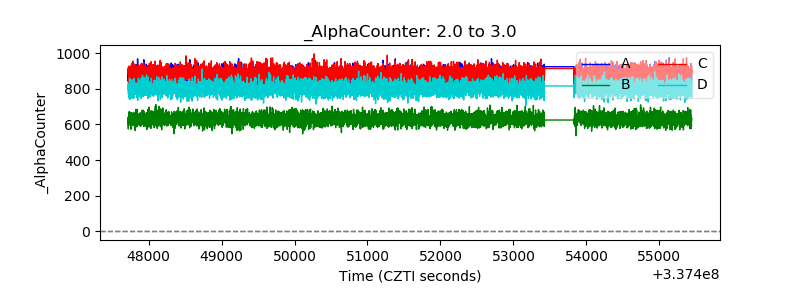 |
| _CPM_Rate | 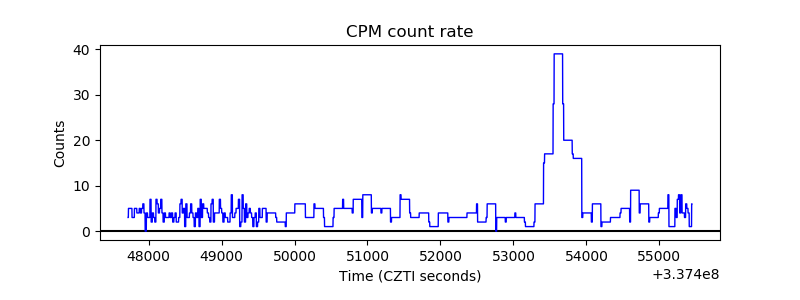 |
| CZT Counter | 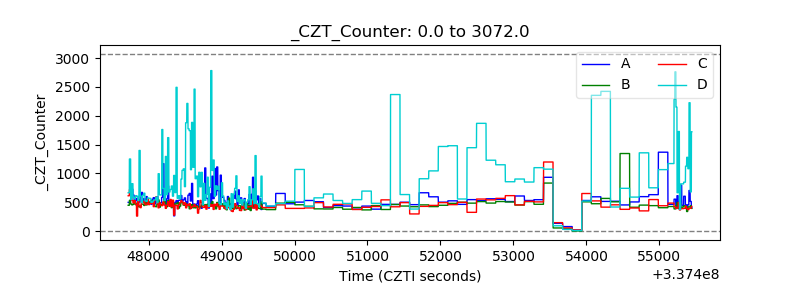 |
| +2.5 Volts monitor |  |
| +5 Volts monitor |  |
| _ROLL_ROT | 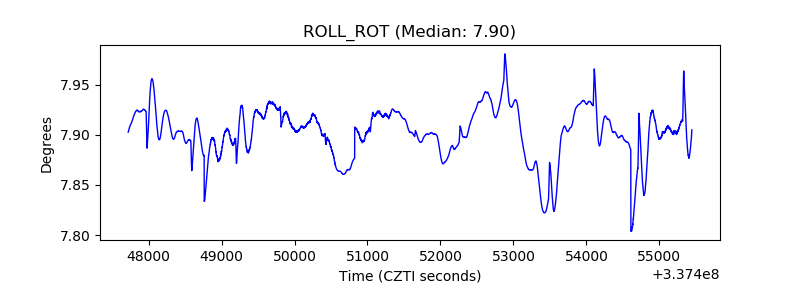 |
| _Roll_DEC |  |
| _Roll_RA | 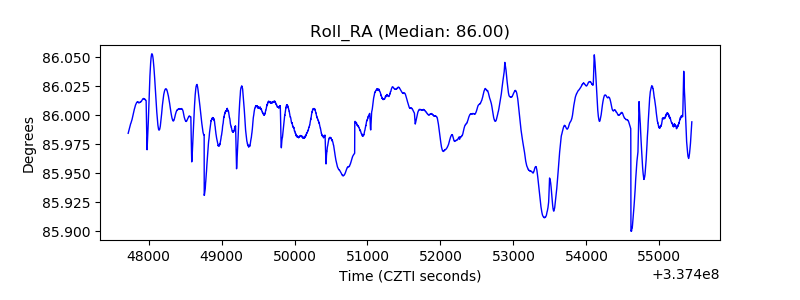 |
| Veto Counter | 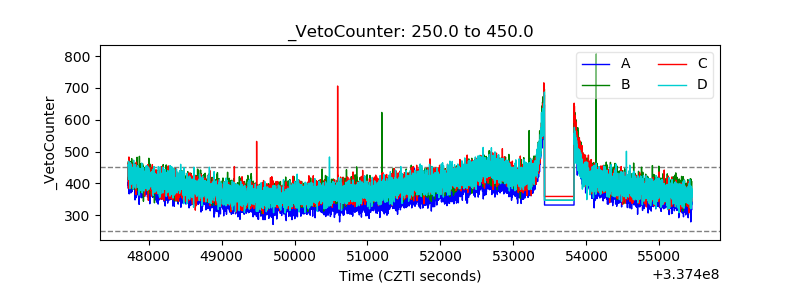 |