| Param | Original file | Final file |
|---|---|---|
| Filename | modeM0/AS1A09_079T01_9000003864_26786cztM0_level2.evt | modeM0/AS1A09_079T01_9000003864_26786cztM0_level2_quad_clean.evt |
| Size (bytes) | 409,034,880 | 74,819,520 |
| Size | 390.1 MB | 71.4 MB |
| Events in quadrant A | 2,880,652 | 496,663 |
| Events in quadrant B | 2,130,613 | 510,253 |
| Events in quadrant C | 2,210,878 | 493,498 |
| Events in quadrant D | 4,846,015 | 435,113 |
| Mode M0 | |||
|---|---|---|---|
| Quadrant | BADHDUFLAG | Total packets | Discarded packets |
| A | 0 | 11630 | 0 |
| B | 0 | 9501 | 0 |
| C | 0 | 9702 | 0 |
| D | 0 | 17631 | 0 |
| Quadrant | Total seconds | Saturated seconds | Saturation percentage |
|---|---|---|---|
| A | 4698 | 18 | 0.383142% |
| B | 4699 | 10 | 0.212811% |
| C | 4698 | 35 | 0.744998% |
| D | 4698 | 748 | 15.921669% |
Noise dominated data is calculated using 1-second bins in cleaned event files. If a bin has >2000 counts, and if more than 50% of those come from <1% of pixels, then it is considered to be noise-dominated and hence unusable.
| Quadrant | # 1 sec bins | Bins with >0 counts | Bins with >2000 counts | High rate bins dominated by noise | Noise dominated (total time) | Noise dominated (detector-on time) | Marked lightcurve |
|---|---|---|---|---|---|---|---|
| A | 4698 | 4698 | 6 | 6 | 0.13% | 0.13% | 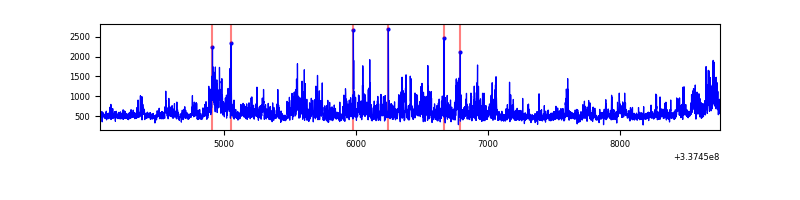 |
| B | 4699 | 4699 | 1 | 1 | 0.02% | 0.02% |  |
| C | 4698 | 4698 | 5 | 5 | 0.11% | 0.11% | 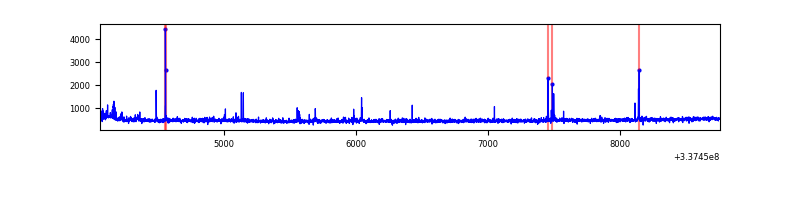 |
| D | 4698 | 4698 | 644 | 644 | 13.71% | 13.71% | 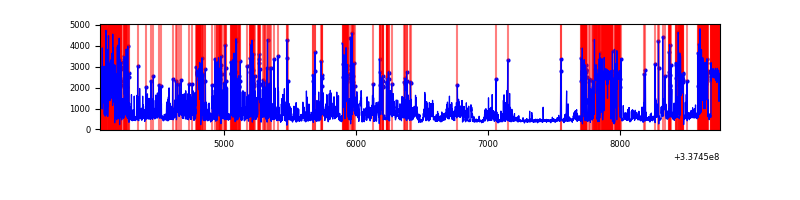 |
Top three noisy pixels from each quadrant. If the there are fewer than three noisy pixels in the level2.evt file, extra rows are filled as -1
| Pixel properties | Quadrant properties | ||||||
|---|---|---|---|---|---|---|---|
| Quadrant | DetID | PixID | Counts | Sigma | Mean | Median | Sigma |
| A | 0 | 13 | 814133 | 7518.06 | 533 | 521 | 108.2 |
| A | 13 | 254 | 7700 | 66.34 | 533 | 521 | 108.2 |
| A | 10 | 67 | 5062 | 41.96 | 533 | 521 | 108.2 |
| B | 10 | 246 | 26124 | 251.15 | 534 | 519 | 101.9 |
| B | 12 | 111 | 12353 | 116.08 | 534 | 519 | 101.9 |
| B | 11 | 111 | 10993 | 102.74 | 534 | 519 | 101.9 |
| C | 14 | 238 | 83853 | 681.37 | 518 | 520 | 122.3 |
| C | 2 | 16 | 52564 | 425.53 | 518 | 520 | 122.3 |
| C | 15 | 208 | 37303 | 300.75 | 518 | 520 | 122.3 |
| D | 1 | 52 | 2491690 | 21257.26 | 473 | 459 | 117.2 |
| D | 2 | 250 | 362360 | 3088.04 | 473 | 459 | 117.2 |
| D | 1 | 239 | 171780 | 1461.85 | 473 | 459 | 117.2 |
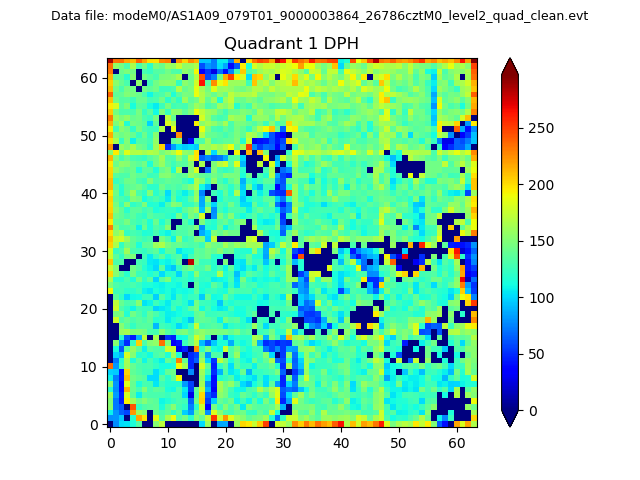
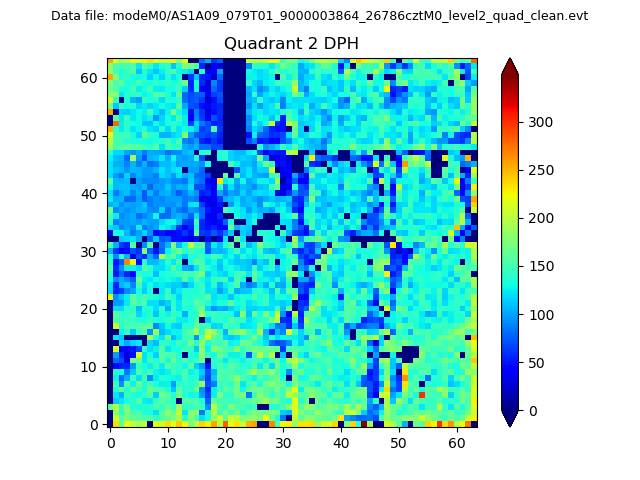
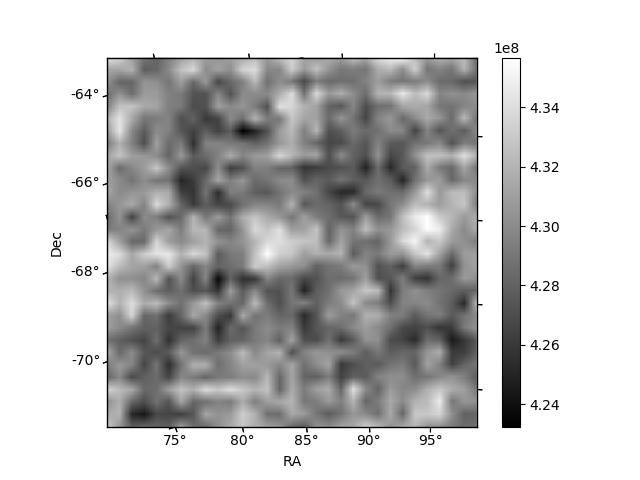
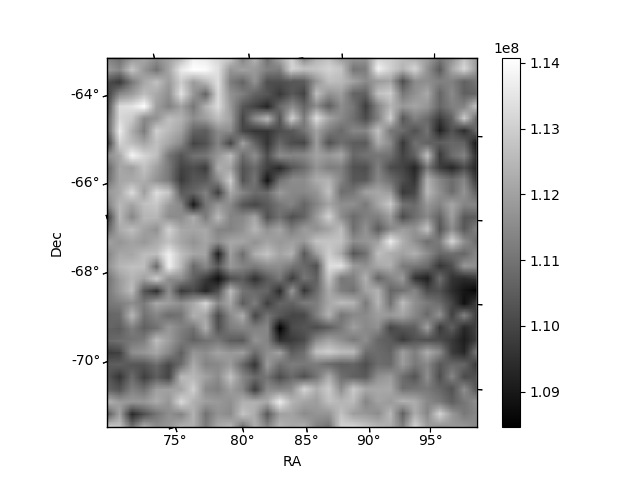
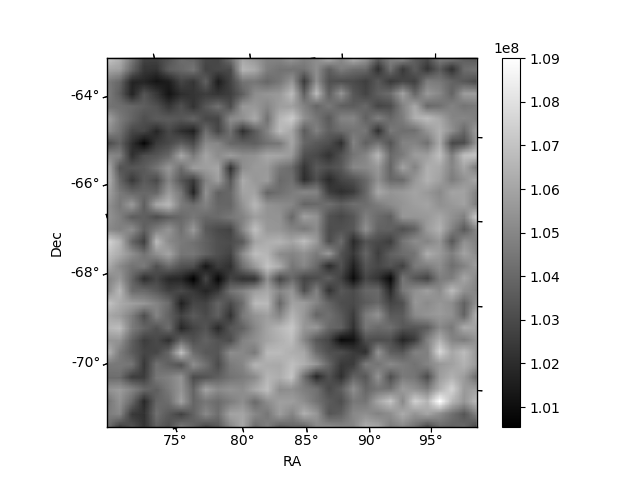
Histogram calculated using DETX and DETY for each event in the final _common_clean file
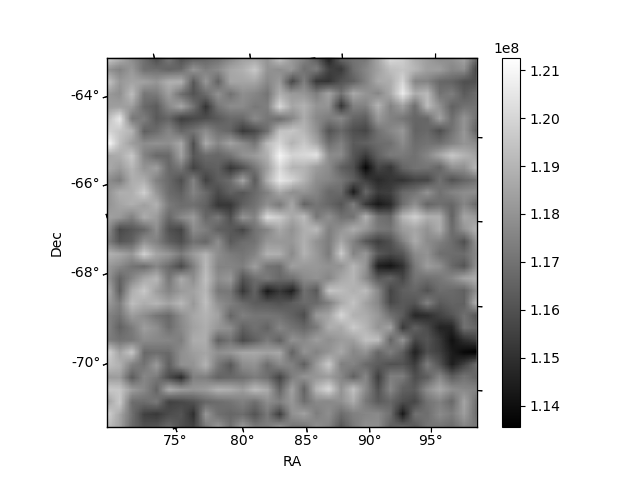
| Quadrant A | 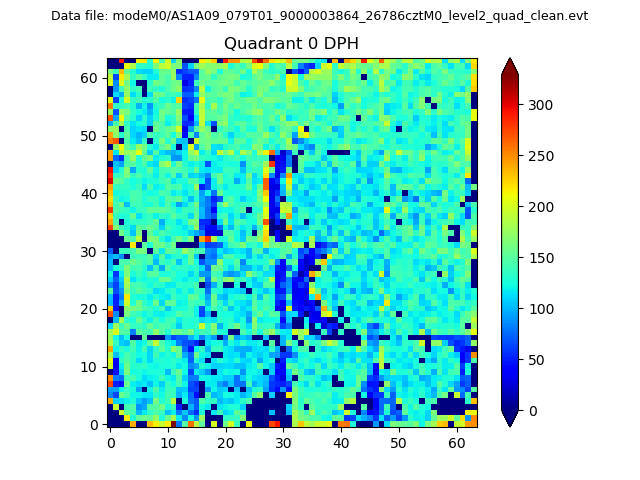 |
 |
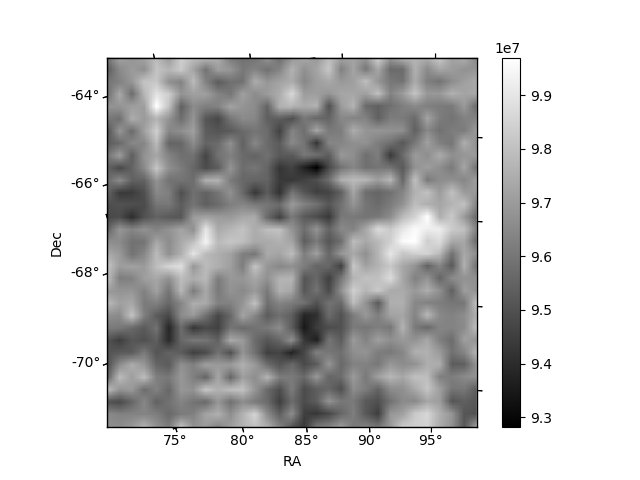
Quadrant B |
|---|---|---|---|
| Quadrant D | 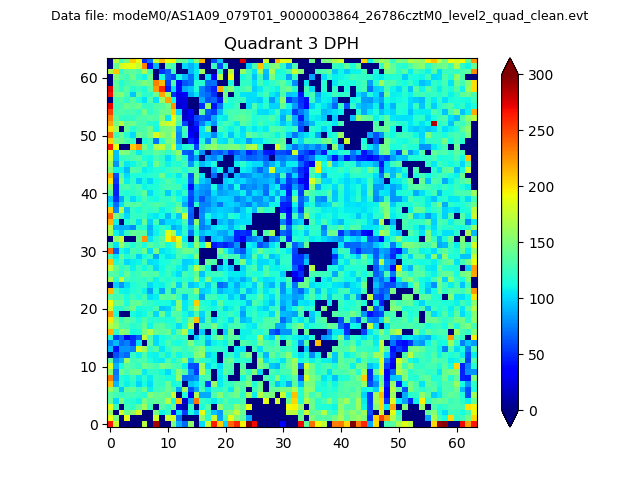 |
 |
Quadrant C |
| Plot type | Count rate plots | Images |
|---|---|---|
| Comparison with Poisson distribution Blue bars denote a histogram of data divided into 1 sec bins. Red curve is a Poisson curve with rate = median count rate of data. |
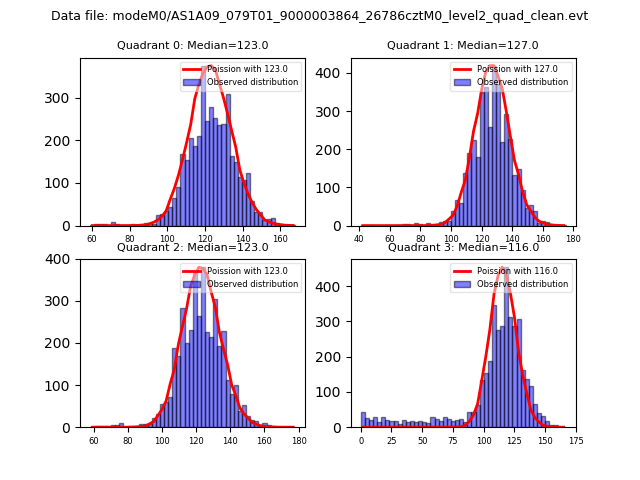 |
 |
| Quadrant-wise count rates Data is divided into 100 sec bins |
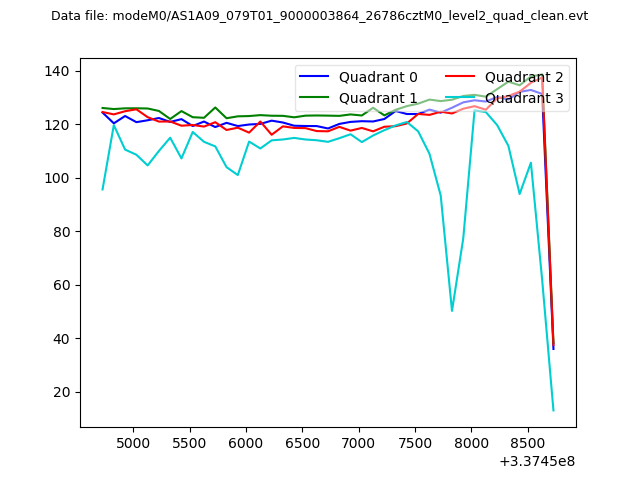 |
|
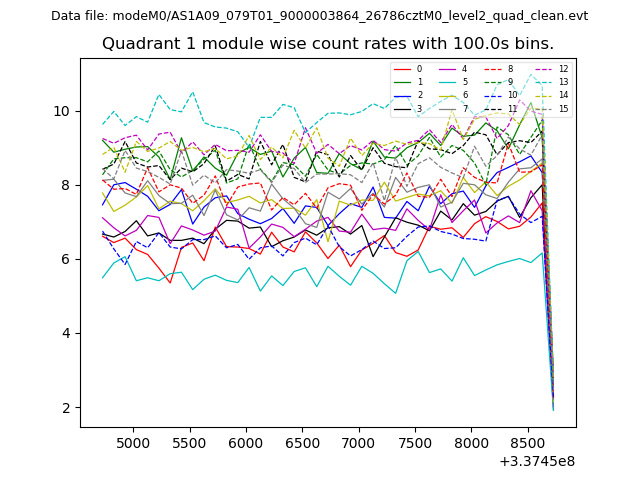
| Module-wise count rates for Quadrant A Data is divided into 100 sec bins |
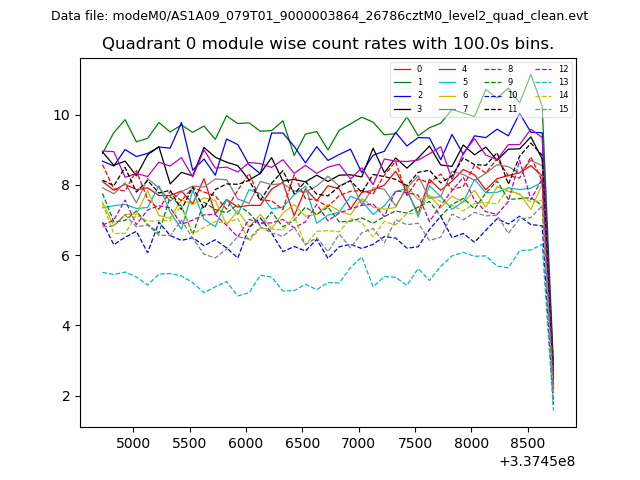 |
 |
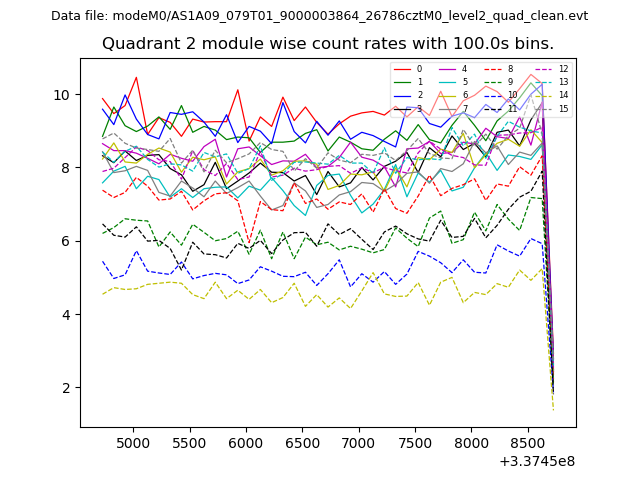
| Module-wise count rates for Quadrant B Data is divided into 100 sec bins |
 |
 |
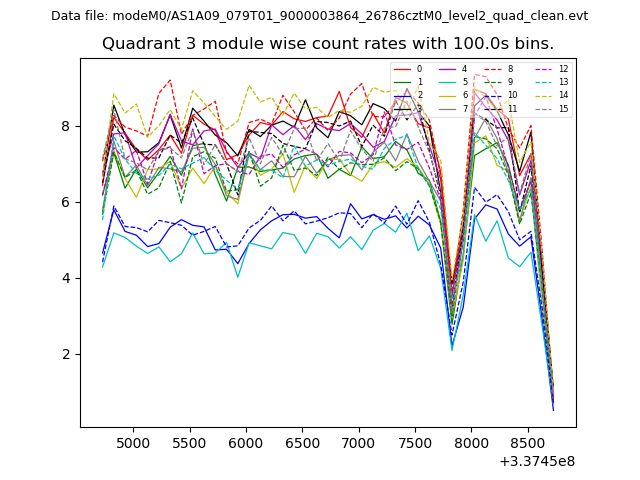
| Module-wise count rates for Quadrant C Data is divided into 100 sec bins |
 |
 |
| Module-wise count rates for Quadrant D Data is divided into 100 sec bins |
 |
 |
| Parameter | Plot |
|---|---|
| CZT HV Monitor | 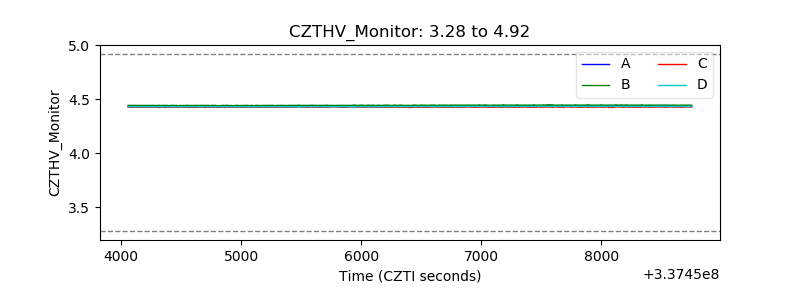 |
| D_VDD | 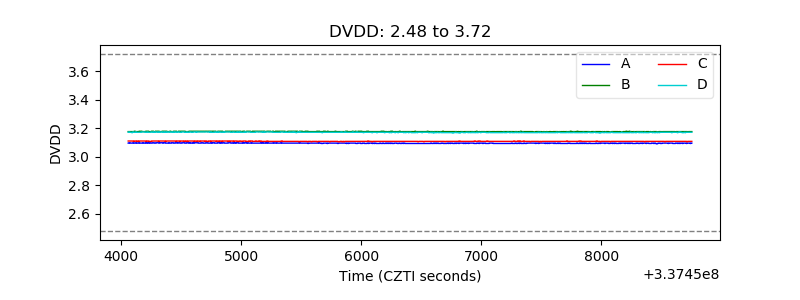 |
| Temperature 1 | 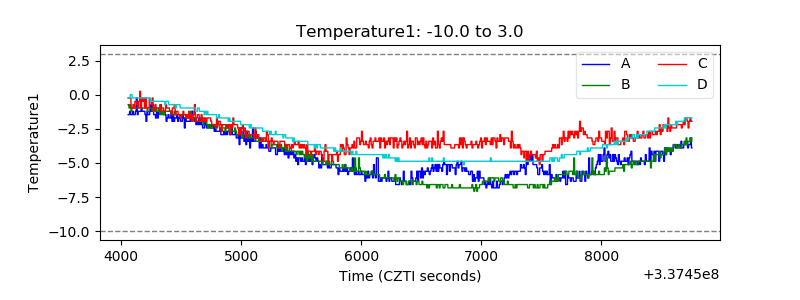 |
| Veto HV Monitor | 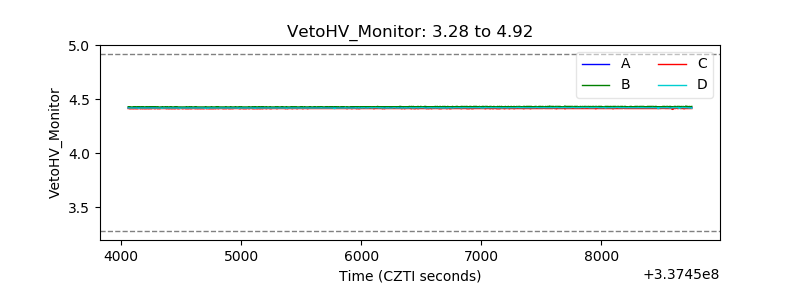 |
| Veto LLD | 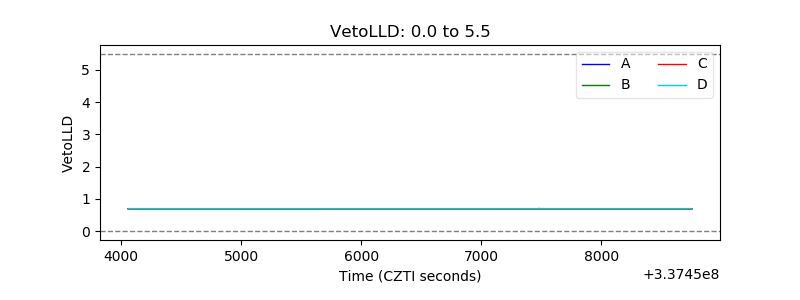 |
| Alpha Counter | 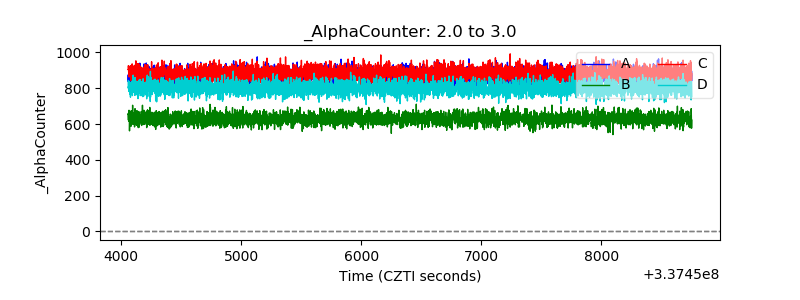 |
| _CPM_Rate | 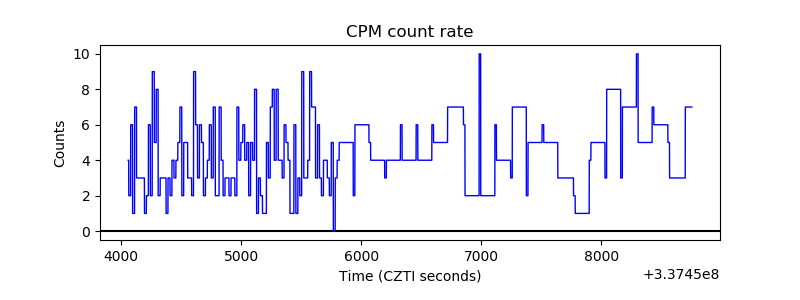 |
| CZT Counter | 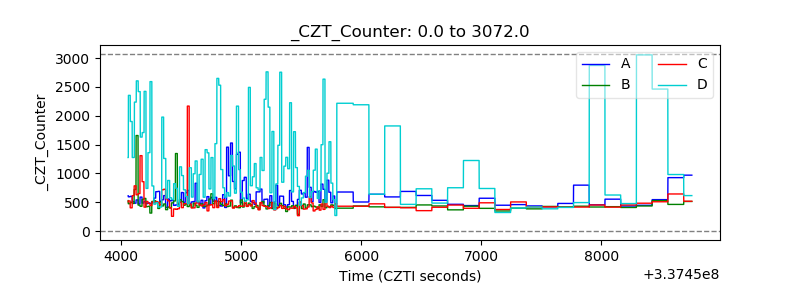 |
| +2.5 Volts monitor | 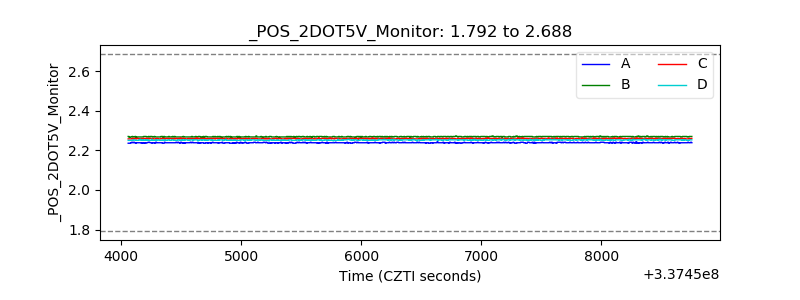 |
| +5 Volts monitor | 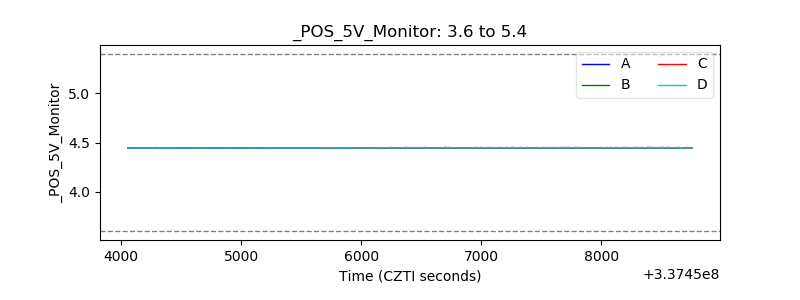 |
| _ROLL_ROT | 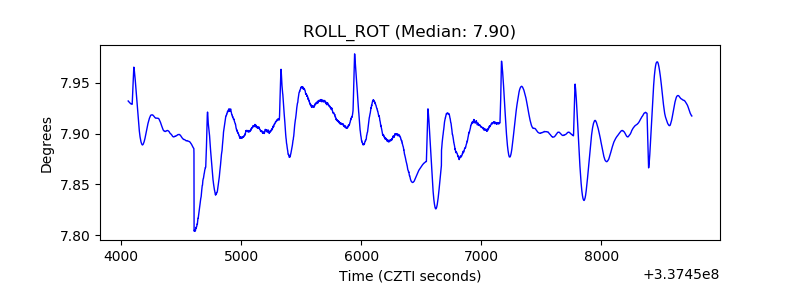 |
| _Roll_DEC | 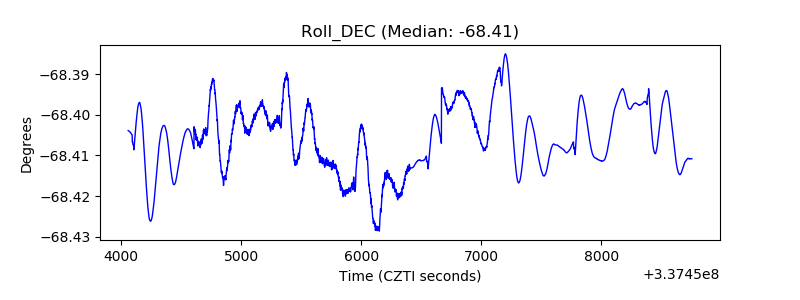 |
| _Roll_RA | 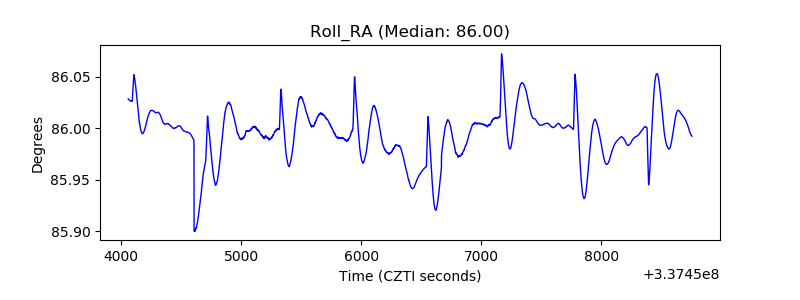 |
| Veto Counter | 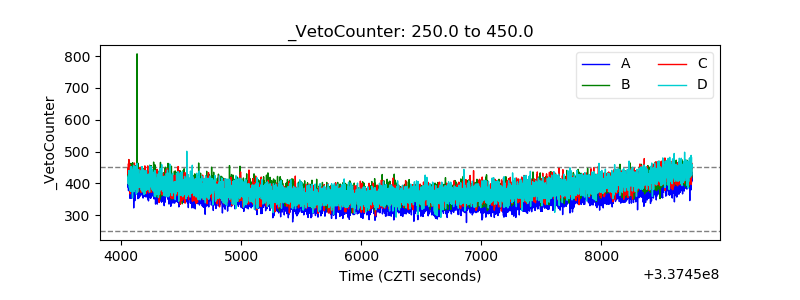 |