| Param | Original file | Final file |
|---|---|---|
| Filename | modeM0/AS1A09_079T01_9000003864_26787cztM0_level2.evt | modeM0/AS1A09_079T01_9000003864_26787cztM0_level2_quad_clean.evt |
| Size (bytes) | 1,189,494,720 | 223,513,920 |
| Size | 1.1 GB | 213.2 MB |
| Events in quadrant A | 9,383,698 | 1,482,667 |
| Events in quadrant B | 6,471,730 | 1,530,253 |
| Events in quadrant C | 6,713,534 | 1,481,848 |
| Events in quadrant D | 12,561,384 | 1,359,492 |
| Mode M9 | |||
|---|---|---|---|
| Quadrant | BADHDUFLAG | Total packets | Discarded packets |
| A | 0 | 21 | 0 |
| B | 0 | 21 | 0 |
| C | 0 | 21 | 0 |
| D | 0 | 21 | 0 |
| Mode M0 | |||
|---|---|---|---|
| Quadrant | BADHDUFLAG | Total packets | Discarded packets |
| A | 0 | 37008 | 0 |
| B | 0 | 27655 | 0 |
| C | 0 | 28386 | 0 |
| D | 0 | 46349 | 0 |
| Quadrant | Total seconds | Saturated seconds | Saturation percentage |
|---|---|---|---|
| A | 13244 | 413 | 3.118393% |
| B | 13245 | 177 | 1.336353% |
| C | 13245 | 241 | 1.819555% |
| D | 13245 | 1842 | 13.907135% |
Noise dominated data is calculated using 1-second bins in cleaned event files. If a bin has >2000 counts, and if more than 50% of those come from <1% of pixels, then it is considered to be noise-dominated and hence unusable.
| Quadrant | # 1 sec bins | Bins with >0 counts | Bins with >2000 counts | High rate bins dominated by noise | Noise dominated (total time) | Noise dominated (detector-on time) | Marked lightcurve |
|---|---|---|---|---|---|---|---|
| A | 15354 | 13247 | 100 | 100 | 0.65% | 0.75% | 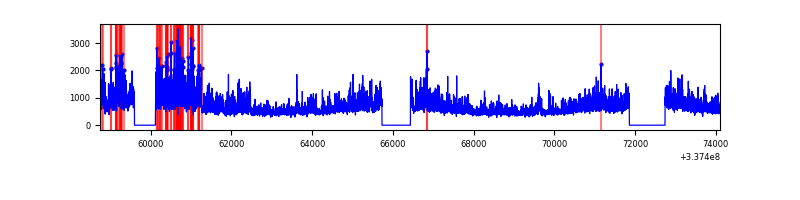 |
| B | 15355 | 13248 | 23 | 23 | 0.15% | 0.17% | 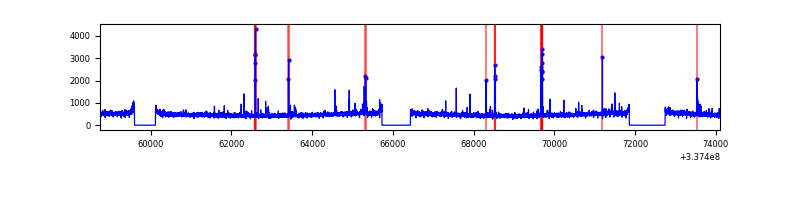 |
| C | 15355 | 13248 | 40 | 40 | 0.26% | 0.30% | 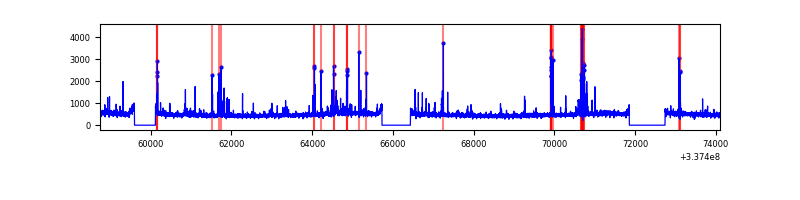 |
| D | 15355 | 13247 | 1473 | 1473 | 9.59% | 11.12% | 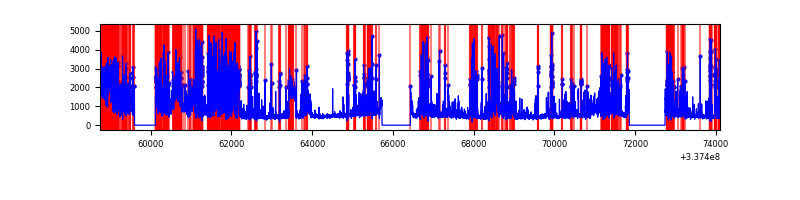 |
Top three noisy pixels from each quadrant. If the there are fewer than three noisy pixels in the level2.evt file, extra rows are filled as -1
| Pixel properties | Quadrant properties | ||||||
|---|---|---|---|---|---|---|---|
| Quadrant | DetID | PixID | Counts | Sigma | Mean | Median | Sigma |
| A | 0 | 13 | 3245456 | 10159.47 | 1586 | 1550 | 319.3 |
| A | 13 | 254 | 22989 | 67.14 | 1586 | 1550 | 319.3 |
| A | 3 | 137 | 14986 | 42.08 | 1586 | 1550 | 319.3 |
| B | 10 | 246 | 120297 | 396.3 | 1591 | 1550 | 299.6 |
| B | 3 | 64 | 55001 | 178.38 | 1591 | 1550 | 299.6 |
| B | 0 | 229 | 44665 | 143.89 | 1591 | 1550 | 299.6 |
| C | 14 | 238 | 246102 | 682.43 | 1540 | 1548 | 358.4 |
| C | 15 | 208 | 233054 | 646.02 | 1540 | 1548 | 358.4 |
| C | 2 | 16 | 180832 | 500.29 | 1540 | 1548 | 358.4 |
| D | 1 | 52 | 2953529 | 8382.77 | 1464 | 1429 | 352.2 |
| D | 7 | 80 | 2164472 | 6142.17 | 1464 | 1429 | 352.2 |
| D | 1 | 239 | 700525 | 1985.15 | 1464 | 1429 | 352.2 |
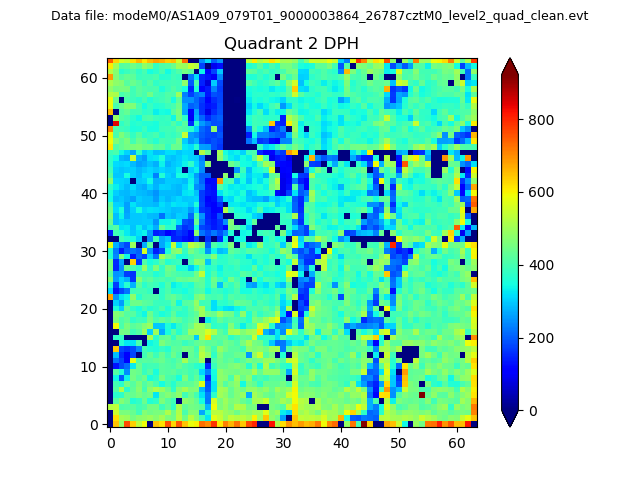
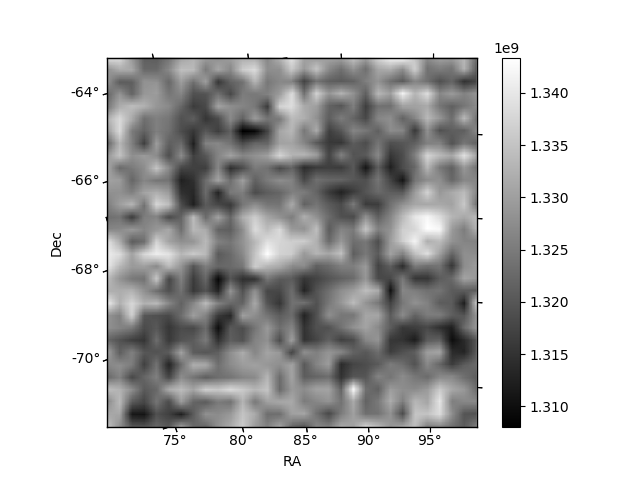
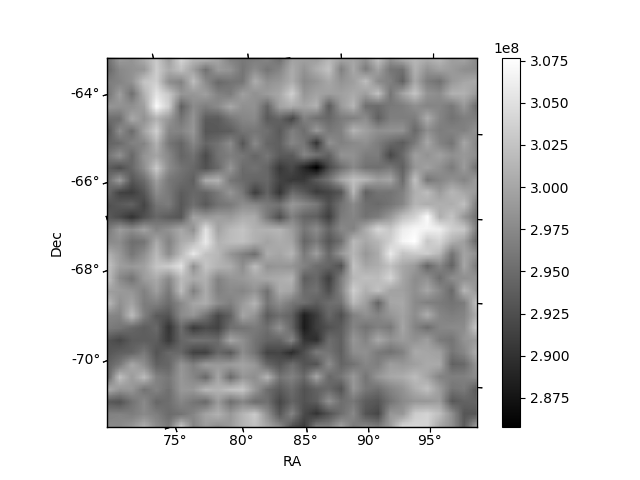
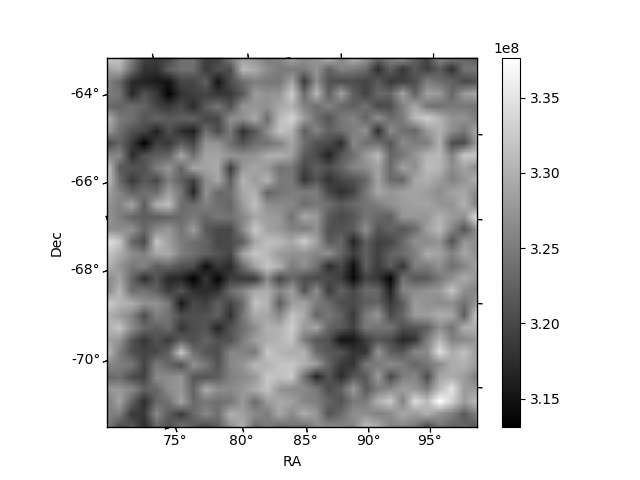
Histogram calculated using DETX and DETY for each event in the final _common_clean file
| Quadrant A | 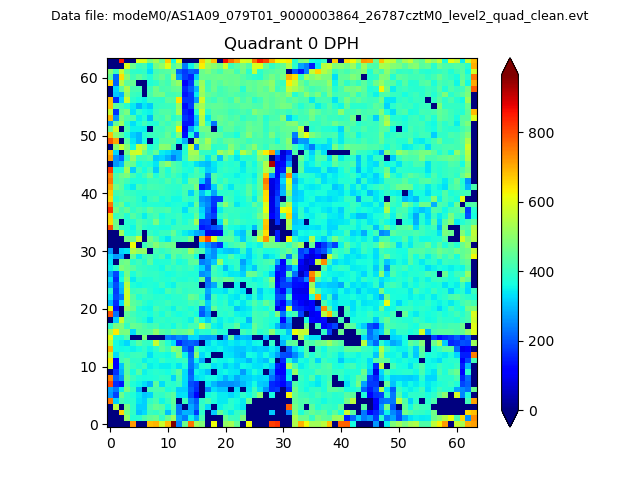 |
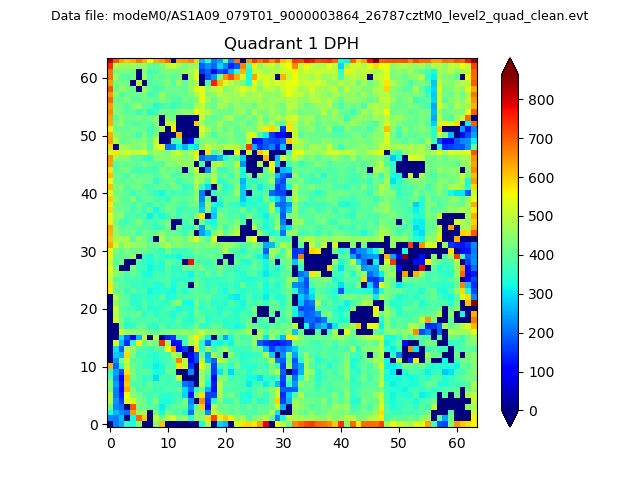 |
Quadrant B |
|---|---|---|---|
| Quadrant D | 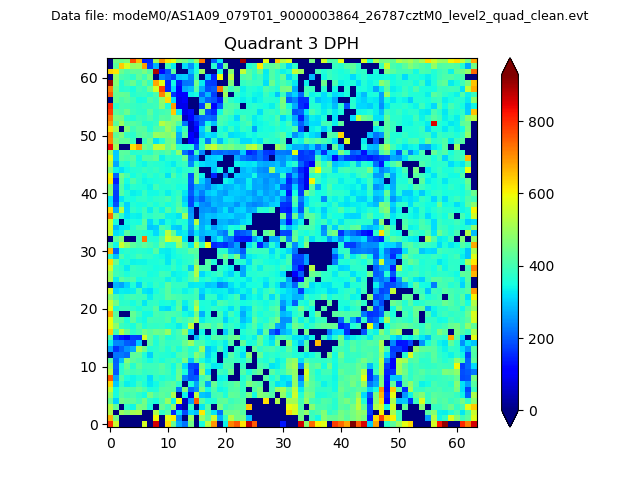 |
 |
Quadrant C |
| Plot type | Count rate plots | Images |
|---|---|---|
| Comparison with Poisson distribution Blue bars denote a histogram of data divided into 1 sec bins. Red curve is a Poisson curve with rate = median count rate of data. |
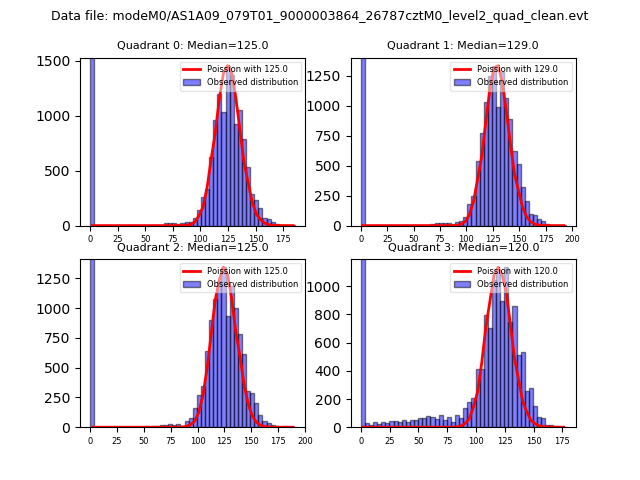 |
 |
| Quadrant-wise count rates Data is divided into 100 sec bins |
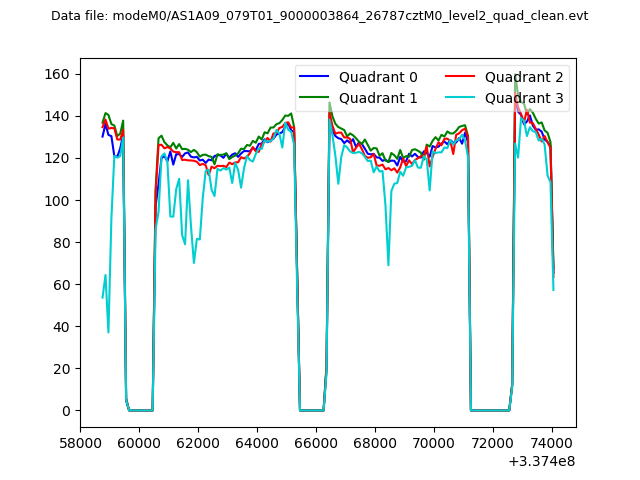 |
|
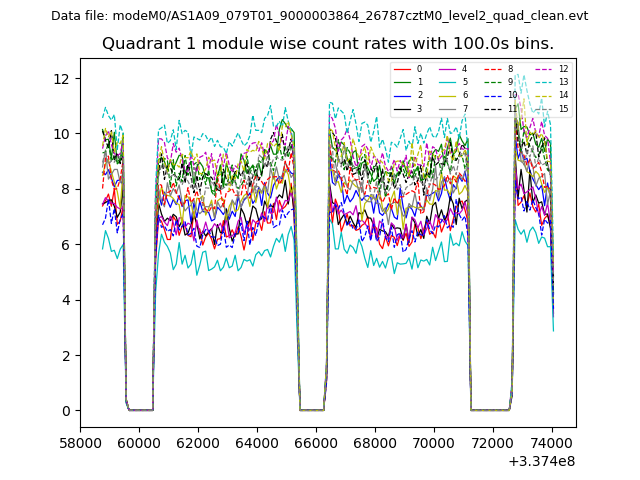
| Module-wise count rates for Quadrant A Data is divided into 100 sec bins |
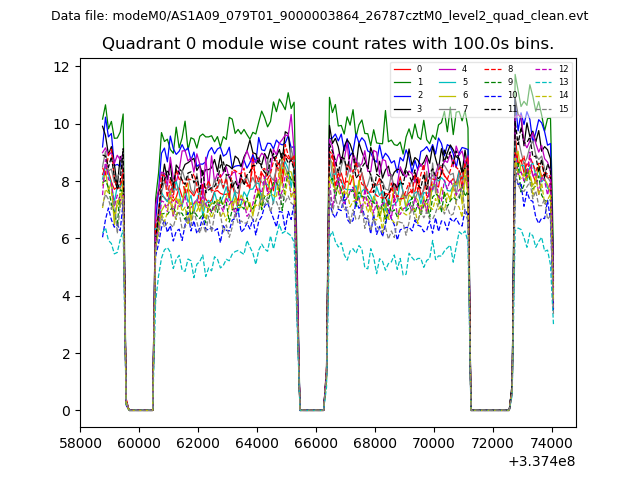 |
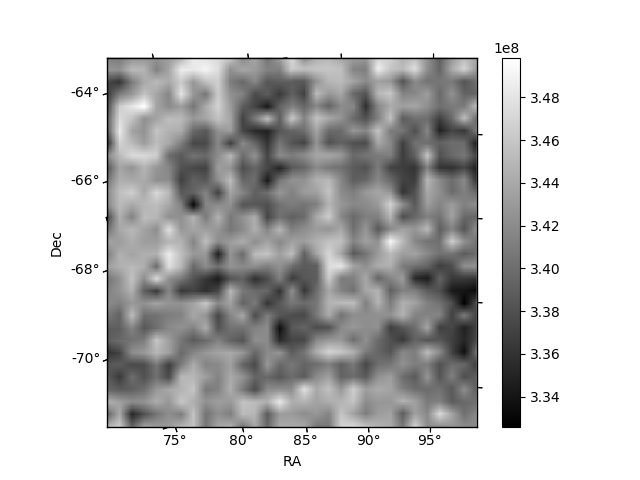 |
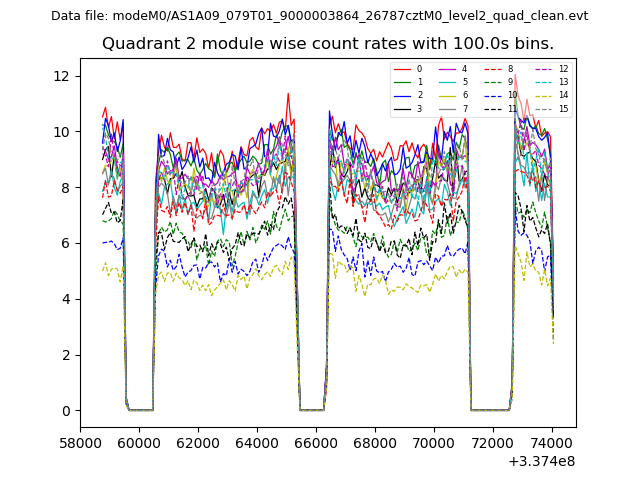
| Module-wise count rates for Quadrant B Data is divided into 100 sec bins |
 |
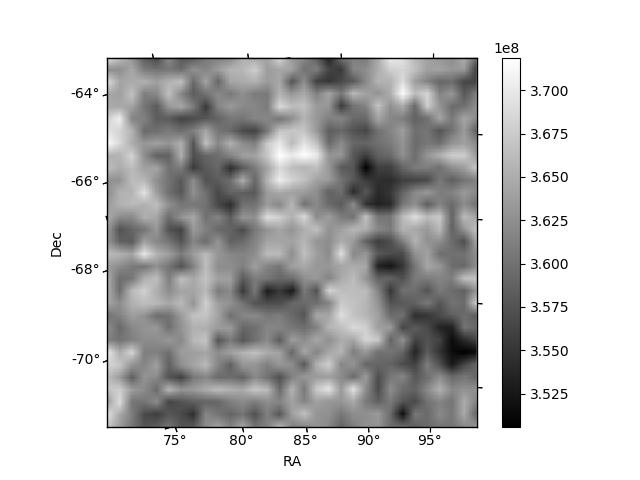 |
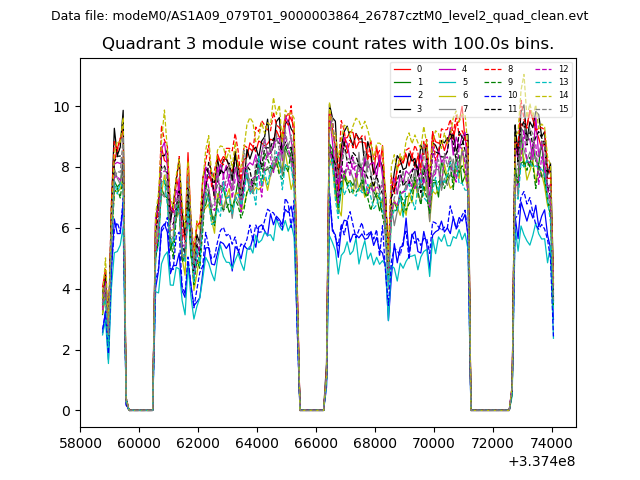
| Module-wise count rates for Quadrant C Data is divided into 100 sec bins |
 |
 |
| Module-wise count rates for Quadrant D Data is divided into 100 sec bins |
 |
 |
| Parameter | Plot |
|---|---|
| CZT HV Monitor | 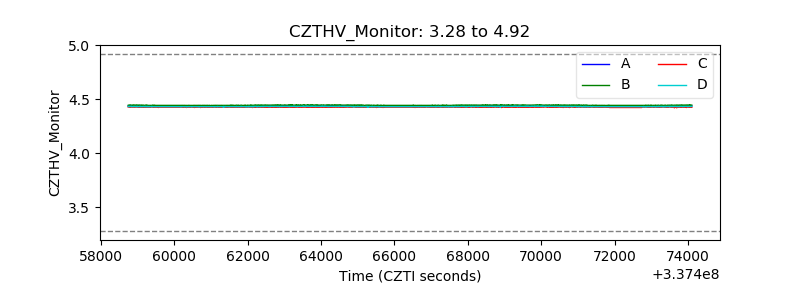 |
| D_VDD | 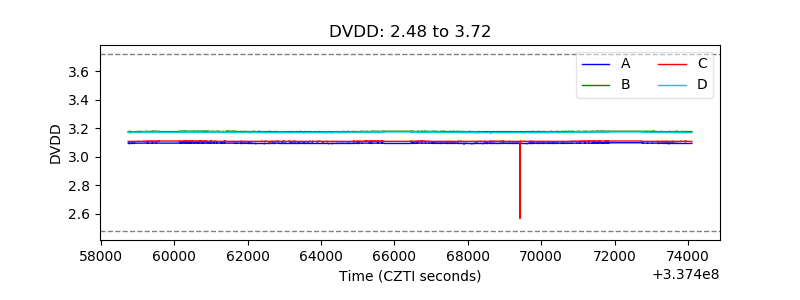 |
| Temperature 1 |  |
| Veto HV Monitor | 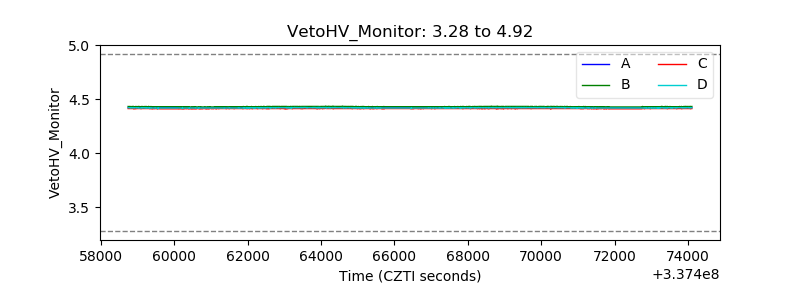 |
| Veto LLD | 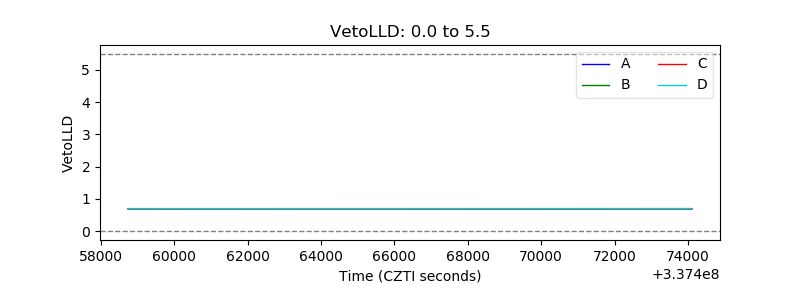 |
| Alpha Counter | 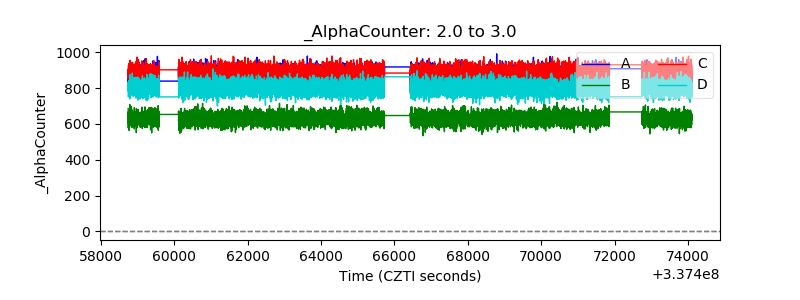 |
| _CPM_Rate | 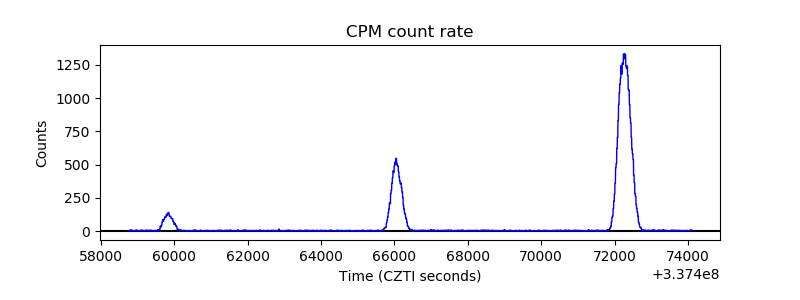 |
| CZT Counter | 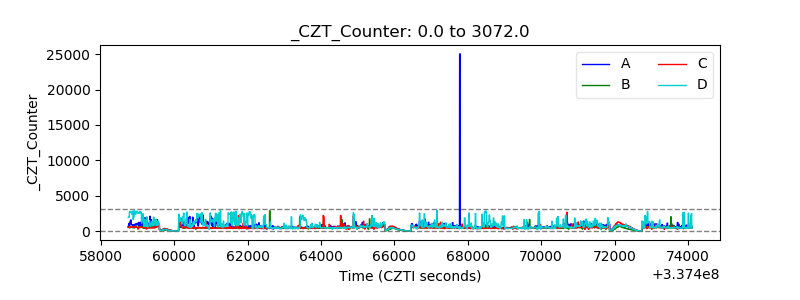 |
| +2.5 Volts monitor |  |
| +5 Volts monitor |  |
| _ROLL_ROT | 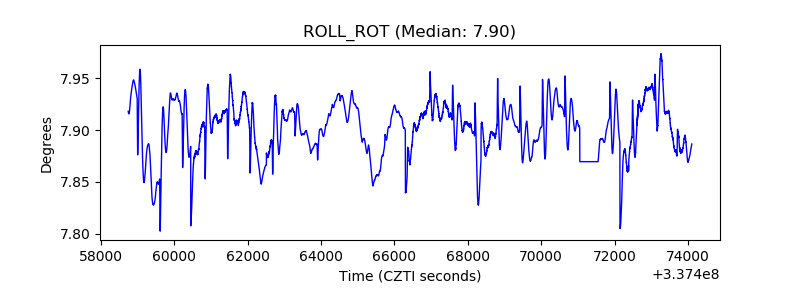 |
| _Roll_DEC |  |
| _Roll_RA | 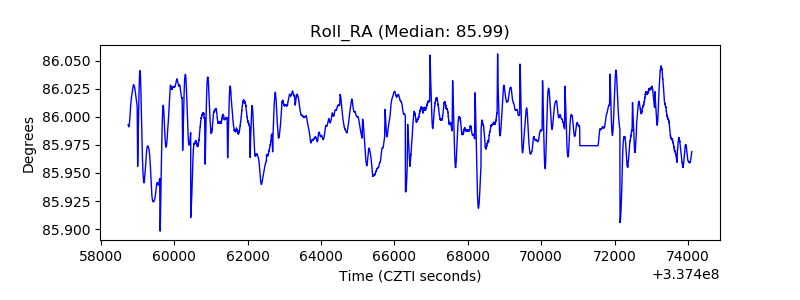 |
| Veto Counter | 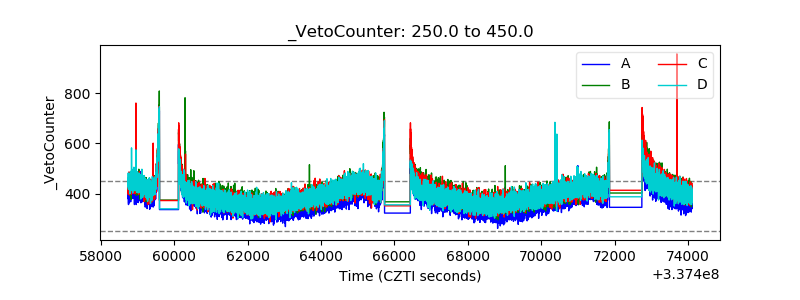 |