| Param | Original file | Final file |
|---|---|---|
| Filename | modeM0/AS1A09_079T01_9000003864_26788cztM0_level2.evt | modeM0/AS1A09_079T01_9000003864_26788cztM0_level2_quad_clean.evt |
| Size (bytes) | 548,049,600 | 119,977,920 |
| Size | 522.7 MB | 114.4 MB |
| Events in quadrant A | 4,618,354 | 787,751 |
| Events in quadrant B | 3,449,631 | 815,642 |
| Events in quadrant C | 3,467,299 | 790,921 |
| Events in quadrant D | 4,596,656 | 760,789 |
| Mode M9 | |||
|---|---|---|---|
| Quadrant | BADHDUFLAG | Total packets | Discarded packets |
| A | 0 | 17 | 0 |
| B | 0 | 18 | 0 |
| C | 0 | 18 | 0 |
| D | 0 | 18 | 0 |
| Mode M0 | |||
|---|---|---|---|
| Quadrant | BADHDUFLAG | Total packets | Discarded packets |
| A | 0 | 18512 | 0 |
| B | 0 | 14597 | 0 |
| C | 0 | 14610 | 0 |
| D | 0 | 18330 | 0 |
| Quadrant | Total seconds | Saturated seconds | Saturation percentage |
|---|---|---|---|
| A | 6869 | 37 | 0.538652% |
| B | 6869 | 56 | 0.815257% |
| C | 6869 | 102 | 1.484932% |
| D | 6869 | 367 | 5.342845% |
Noise dominated data is calculated using 1-second bins in cleaned event files. If a bin has >2000 counts, and if more than 50% of those come from <1% of pixels, then it is considered to be noise-dominated and hence unusable.
| Quadrant | # 1 sec bins | Bins with >0 counts | Bins with >2000 counts | High rate bins dominated by noise | Noise dominated (total time) | Noise dominated (detector-on time) | Marked lightcurve |
|---|---|---|---|---|---|---|---|
| A | 7904 | 6870 | 0 | 0 | 0.00% | 0.00% | 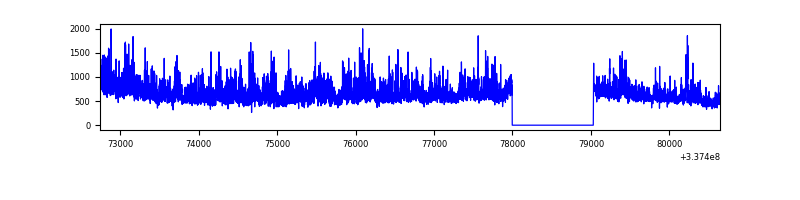 |
| B | 7904 | 6870 | 11 | 11 | 0.14% | 0.16% | 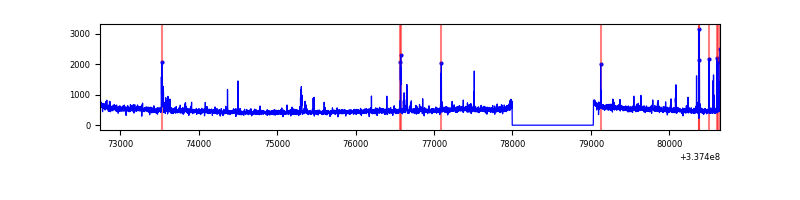 |
| C | 7904 | 6870 | 24 | 24 | 0.30% | 0.35% | 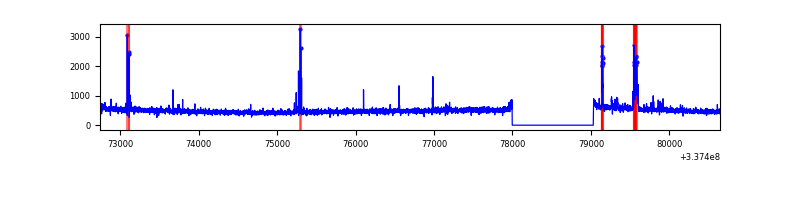 |
| D | 7904 | 6870 | 273 | 273 | 3.45% | 3.97% | 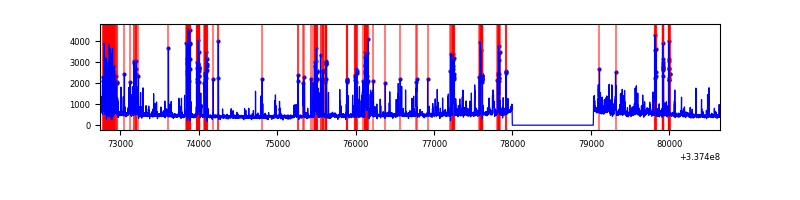 |
Top three noisy pixels from each quadrant. If the there are fewer than three noisy pixels in the level2.evt file, extra rows are filled as -1
| Pixel properties | Quadrant properties | ||||||
|---|---|---|---|---|---|---|---|
| Quadrant | DetID | PixID | Counts | Sigma | Mean | Median | Sigma |
| A | 0 | 13 | 1392324 | 8375.03 | 831 | 814 | 166.1 |
| A | 6 | 16 | 18392 | 105.8 | 831 | 814 | 166.1 |
| A | 13 | 254 | 11646 | 65.19 | 831 | 814 | 166.1 |
| B | 3 | 64 | 87900 | 547.98 | 839 | 817 | 158.9 |
| B | 10 | 246 | 44012 | 271.81 | 839 | 817 | 158.9 |
| B | 0 | 229 | 25953 | 158.17 | 839 | 817 | 158.9 |
| C | 14 | 238 | 131479 | 684.24 | 816 | 820 | 191.0 |
| C | 15 | 208 | 71843 | 371.94 | 816 | 820 | 191.0 |
| C | 3 | 233 | 64950 | 335.84 | 816 | 820 | 191.0 |
| D | 1 | 52 | 679872 | 3574.37 | 801 | 784 | 190.0 |
| D | 7 | 80 | 582905 | 3063.98 | 801 | 784 | 190.0 |
| D | 2 | 250 | 189775 | 994.75 | 801 | 784 | 190.0 |
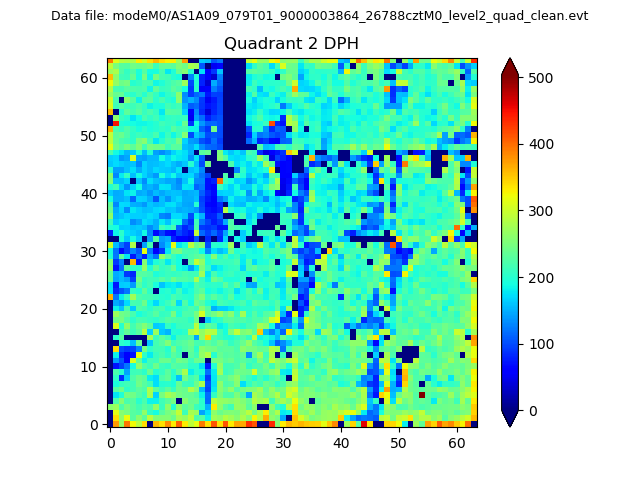
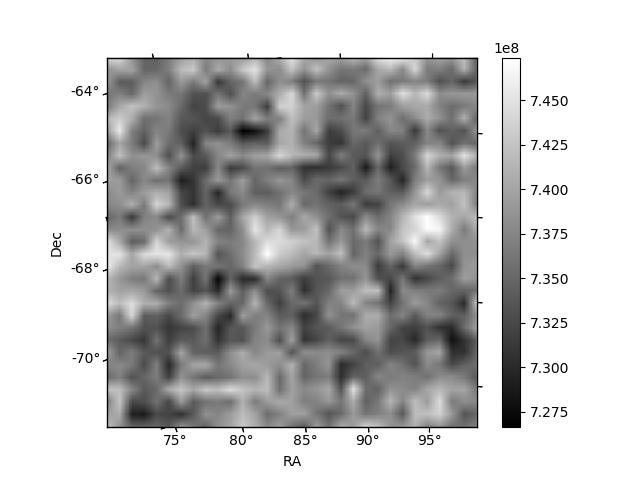
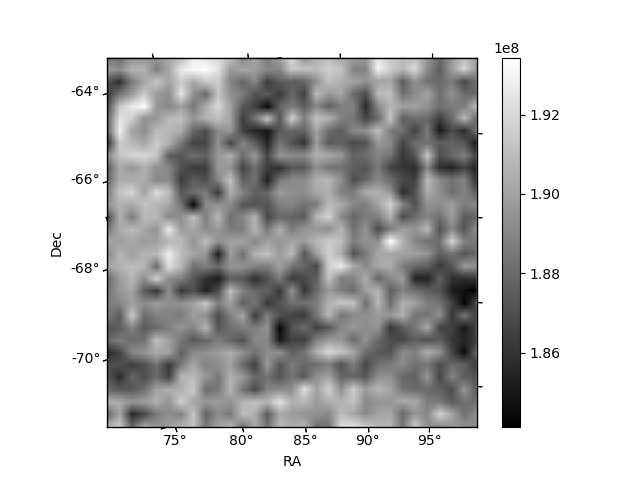
Histogram calculated using DETX and DETY for each event in the final _common_clean file
| Quadrant A | 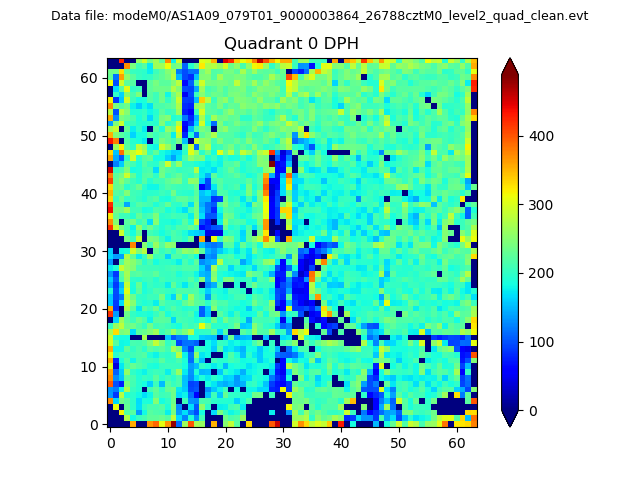 |
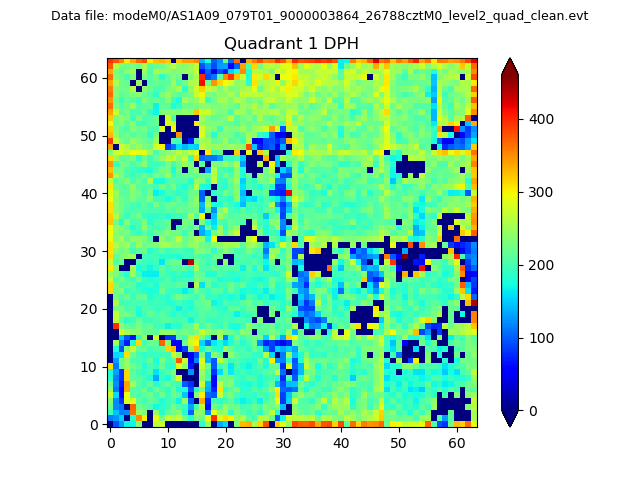 |
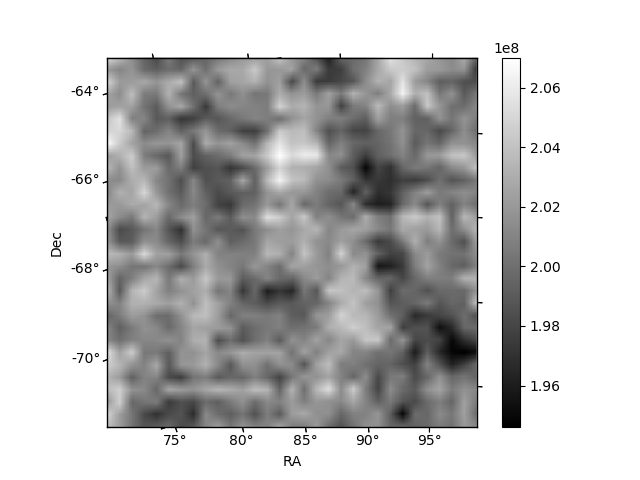
Quadrant B |
|---|---|---|---|
| Quadrant D | 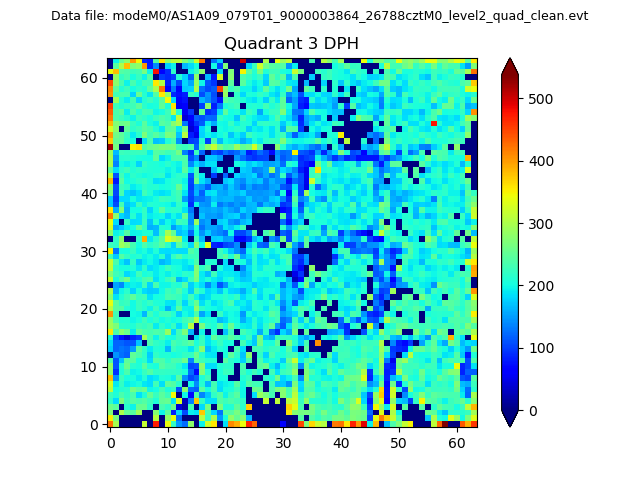 |
 |
Quadrant C |
| Plot type | Count rate plots | Images |
|---|---|---|
| Comparison with Poisson distribution Blue bars denote a histogram of data divided into 1 sec bins. Red curve is a Poisson curve with rate = median count rate of data. |
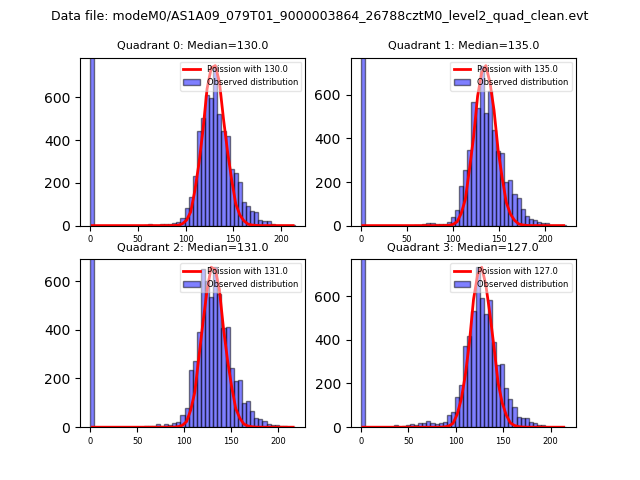 |
 |
| Quadrant-wise count rates Data is divided into 100 sec bins |
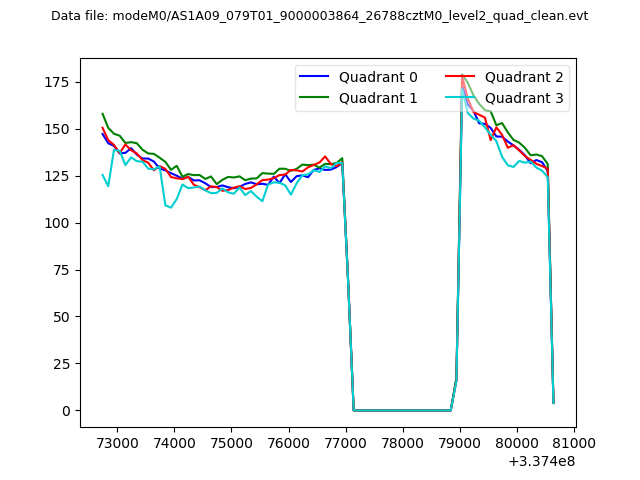 |
|
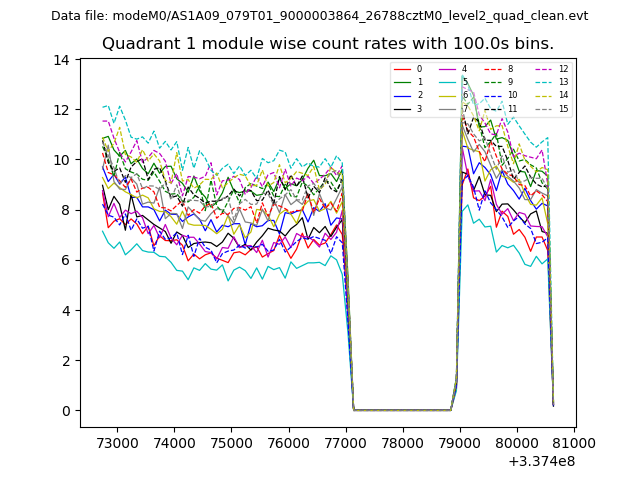
| Module-wise count rates for Quadrant A Data is divided into 100 sec bins |
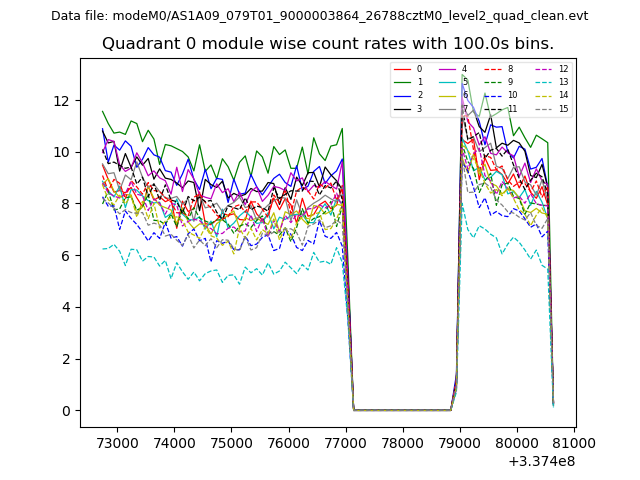 |
 |
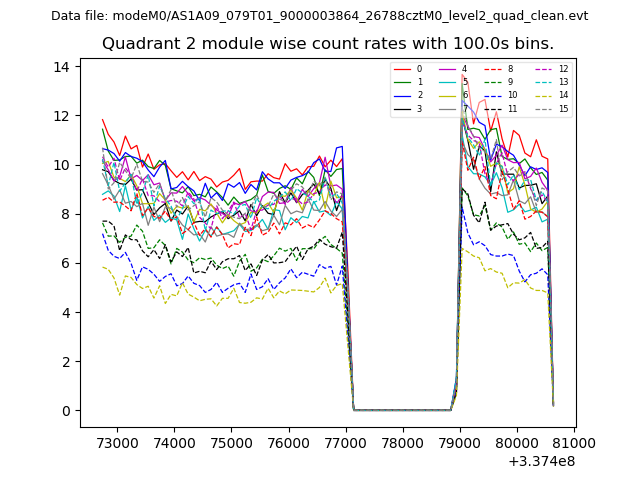
| Module-wise count rates for Quadrant B Data is divided into 100 sec bins |
 |
 |
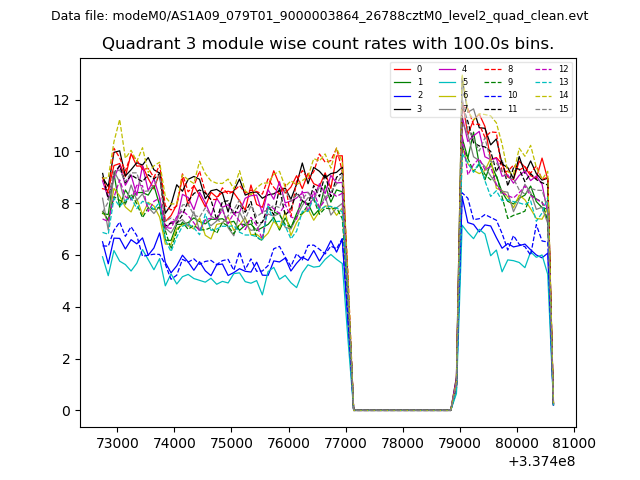
| Module-wise count rates for Quadrant C Data is divided into 100 sec bins |
 |
 |
| Module-wise count rates for Quadrant D Data is divided into 100 sec bins |
 |
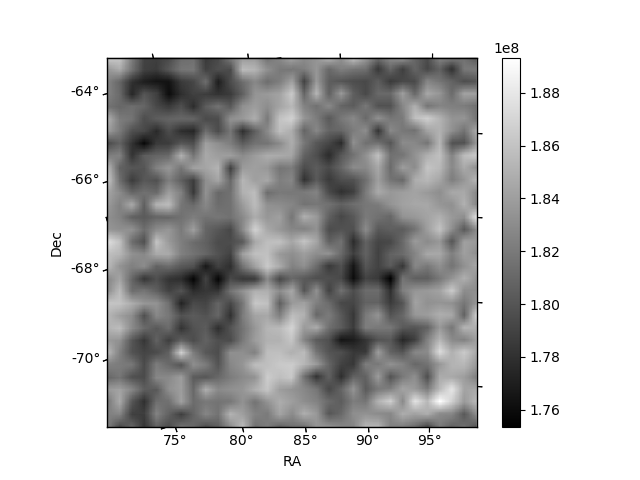 |
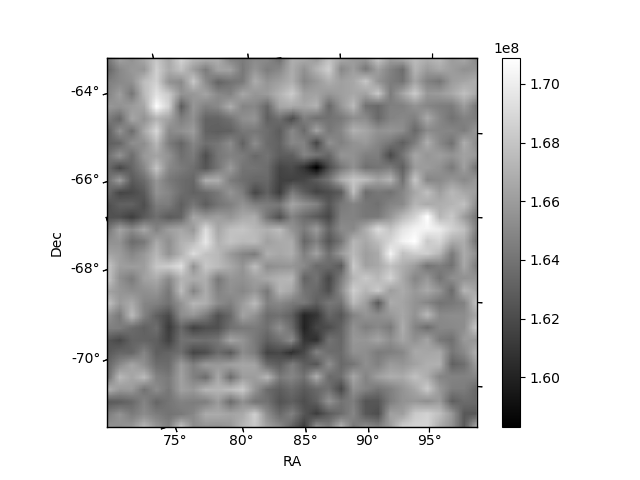
| Parameter | Plot |
|---|---|
| CZT HV Monitor | 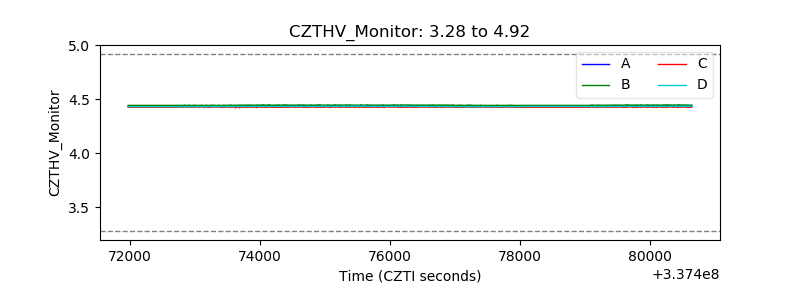 |
| D_VDD |  |
| Temperature 1 | 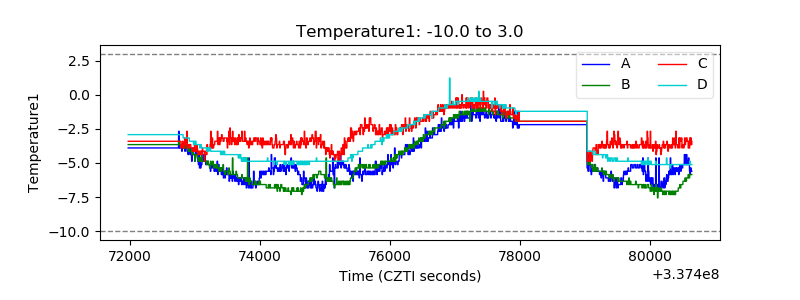 |
| Veto HV Monitor | 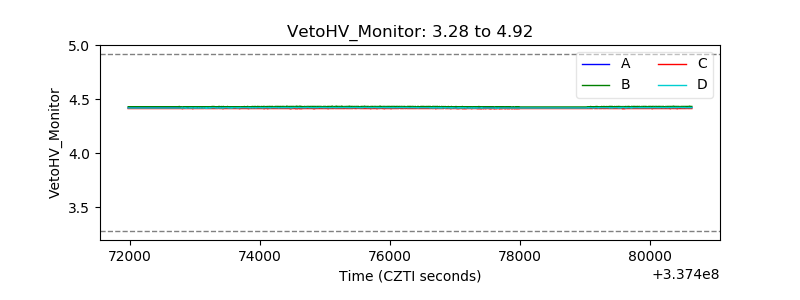 |
| Veto LLD |  |
| Alpha Counter | 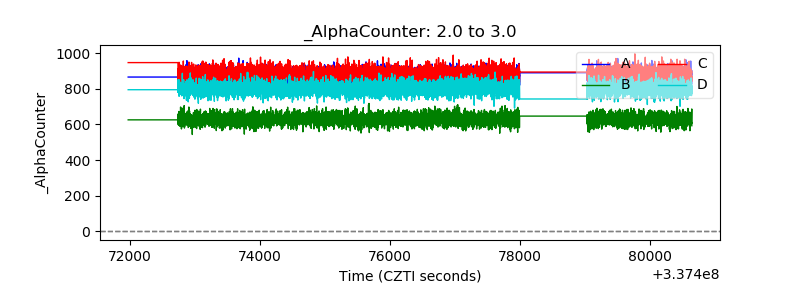 |
| _CPM_Rate | 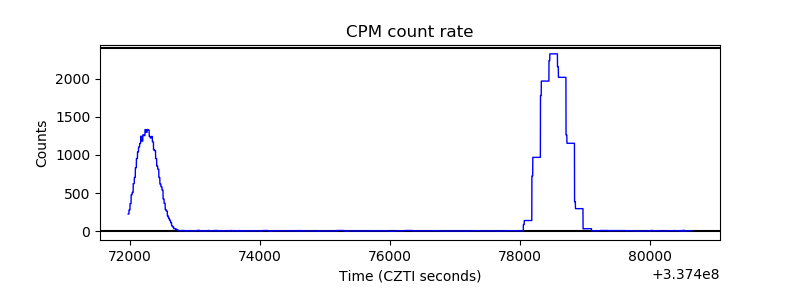 |
| CZT Counter | 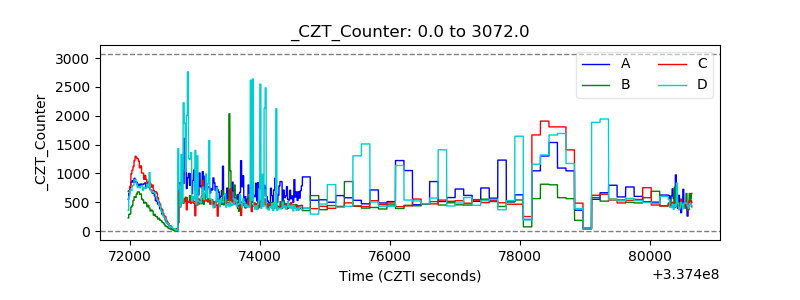 |
| +2.5 Volts monitor |  |
| +5 Volts monitor |  |
| _ROLL_ROT | 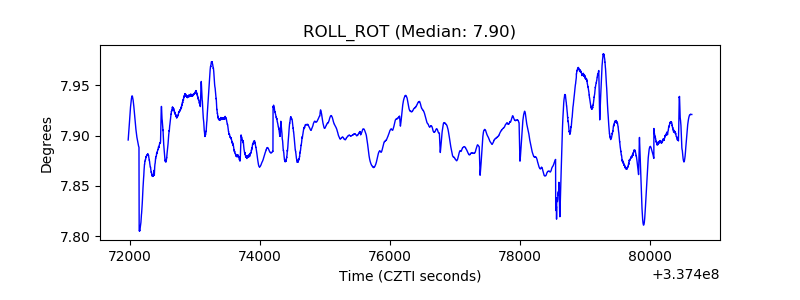 |
| _Roll_DEC | 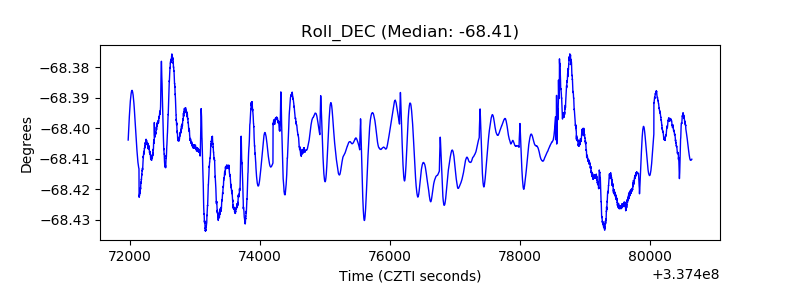 |
| _Roll_RA | 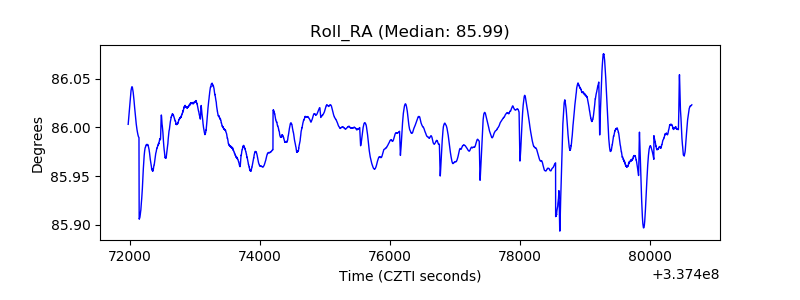 |
| Veto Counter | 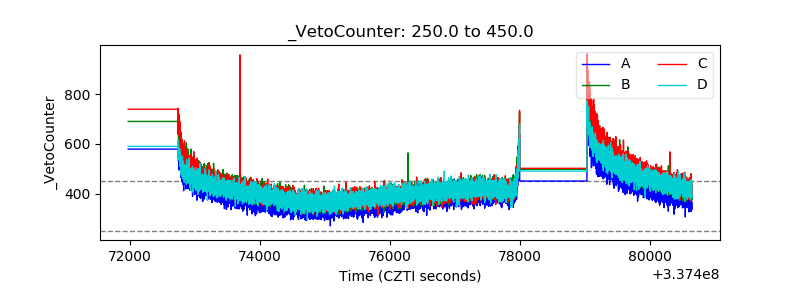 |