| Param | Original file | Final file |
|---|---|---|
| Filename | modeM0/AS1A09_079T01_9000003864_26790cztM0_level2.evt | modeM0/AS1A09_079T01_9000003864_26790cztM0_level2_quad_clean.evt |
| Size (bytes) | 528,503,040 | 117,797,760 |
| Size | 504.0 MB | 112.3 MB |
| Events in quadrant A | 4,081,278 | 776,703 |
| Events in quadrant B | 3,497,390 | 805,556 |
| Events in quadrant C | 3,411,350 | 785,598 |
| Events in quadrant D | 4,580,368 | 751,683 |
| Mode M9 | |||
|---|---|---|---|
| Quadrant | BADHDUFLAG | Total packets | Discarded packets |
| A | 0 | 16 | 0 |
| B | 0 | 17 | 0 |
| C | 0 | 17 | 0 |
| D | 0 | 17 | 0 |
| Mode M0 | |||
|---|---|---|---|
| Quadrant | BADHDUFLAG | Total packets | Discarded packets |
| A | 0 | 16568 | 0 |
| B | 0 | 14451 | 0 |
| C | 0 | 14125 | 0 |
| D | 0 | 18063 | 0 |
| Quadrant | Total seconds | Saturated seconds | Saturation percentage |
|---|---|---|---|
| A | 6426 | 26 | 0.404606% |
| B | 6426 | 80 | 1.244942% |
| C | 6426 | 95 | 1.478369% |
| D | 6425 | 255 | 3.968872% |
Noise dominated data is calculated using 1-second bins in cleaned event files. If a bin has >2000 counts, and if more than 50% of those come from <1% of pixels, then it is considered to be noise-dominated and hence unusable.
| Quadrant | # 1 sec bins | Bins with >0 counts | Bins with >2000 counts | High rate bins dominated by noise | Noise dominated (total time) | Noise dominated (detector-on time) | Marked lightcurve |
|---|---|---|---|---|---|---|---|
| A | 7601 | 6427 | 4 | 4 | 0.05% | 0.06% | 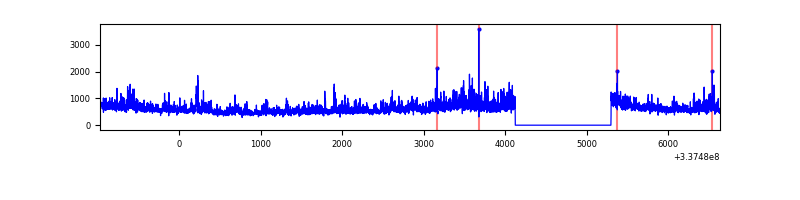 |
| B | 7601 | 6427 | 37 | 37 | 0.49% | 0.58% | 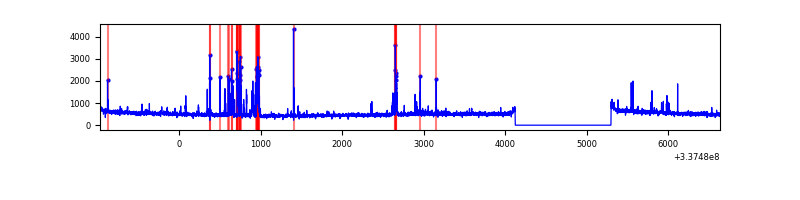 |
| C | 7601 | 6427 | 22 | 22 | 0.29% | 0.34% | 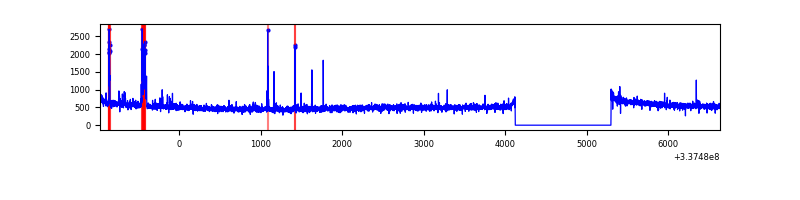 |
| D | 7600 | 6425 | 197 | 197 | 2.59% | 3.07% | 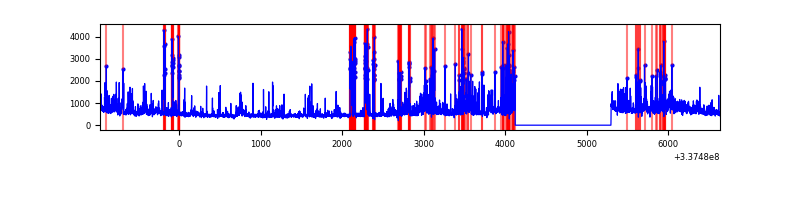 |
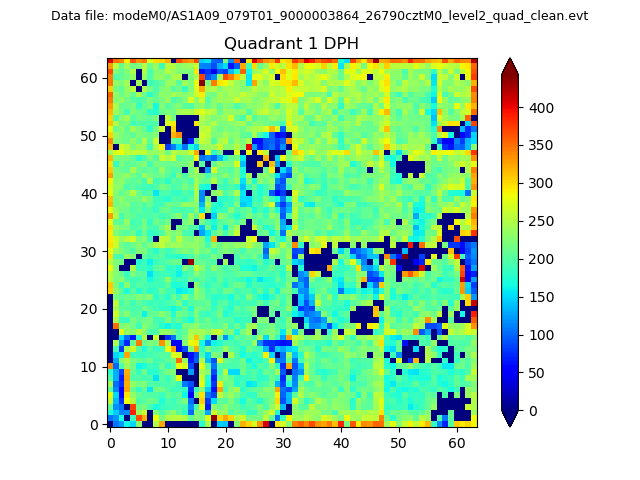
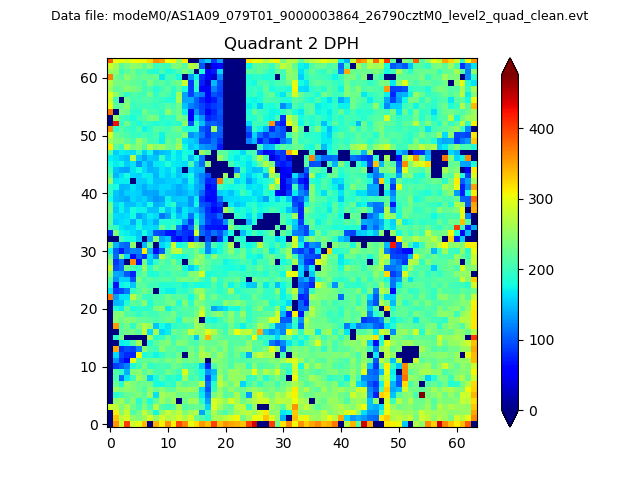
Top three noisy pixels from each quadrant. If the there are fewer than three noisy pixels in the level2.evt file, extra rows are filled as -1
| Pixel properties | Quadrant properties | ||||||
|---|---|---|---|---|---|---|---|
| Quadrant | DetID | PixID | Counts | Sigma | Mean | Median | Sigma |
| A | 0 | 13 | 945606 | 5876.57 | 806 | 789 | 160.8 |
| A | 6 | 16 | 27477 | 165.99 | 806 | 789 | 160.8 |
| A | 13 | 254 | 10414 | 59.87 | 806 | 789 | 160.8 |
| B | 3 | 64 | 245379 | 1612.65 | 813 | 793 | 151.7 |
| B | 10 | 246 | 30668 | 196.98 | 813 | 793 | 151.7 |
| B | 0 | 229 | 24114 | 153.76 | 813 | 793 | 151.7 |
| C | 14 | 238 | 130869 | 696.8 | 803 | 808 | 186.7 |
| C | 3 | 233 | 75661 | 401.02 | 803 | 808 | 186.7 |
| C | 15 | 208 | 56866 | 300.33 | 803 | 808 | 186.7 |
| D | 1 | 52 | 825218 | 4420.26 | 789 | 773 | 186.5 |
| D | 7 | 80 | 379390 | 2029.95 | 789 | 773 | 186.5 |
| D | 15 | 21 | 255753 | 1367.07 | 789 | 773 | 186.5 |
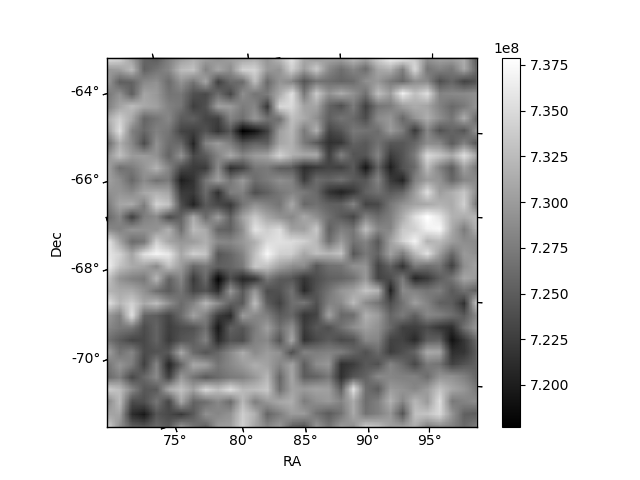
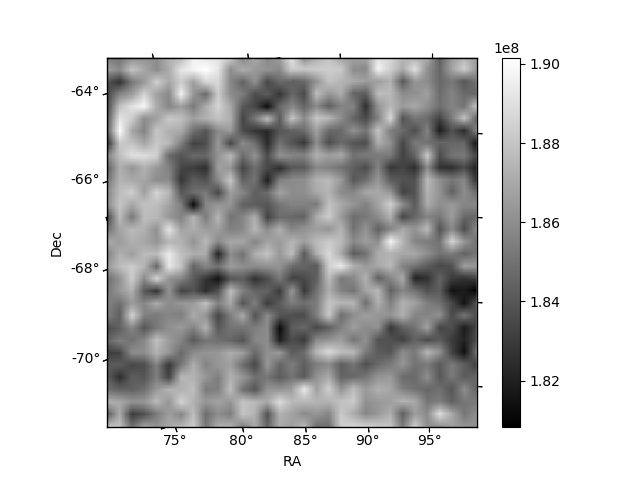
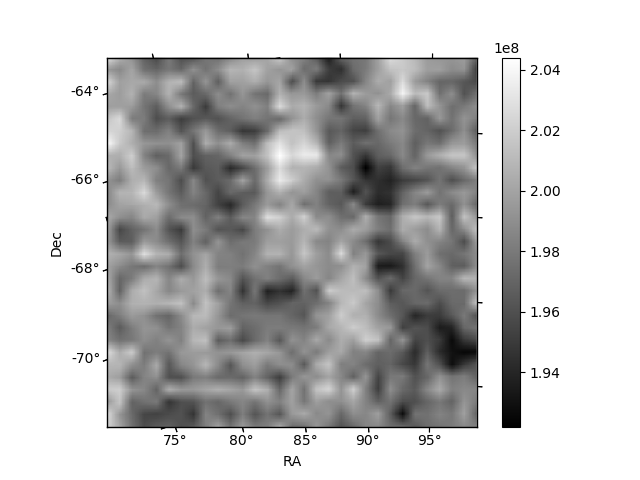
Histogram calculated using DETX and DETY for each event in the final _common_clean file
| Quadrant A | 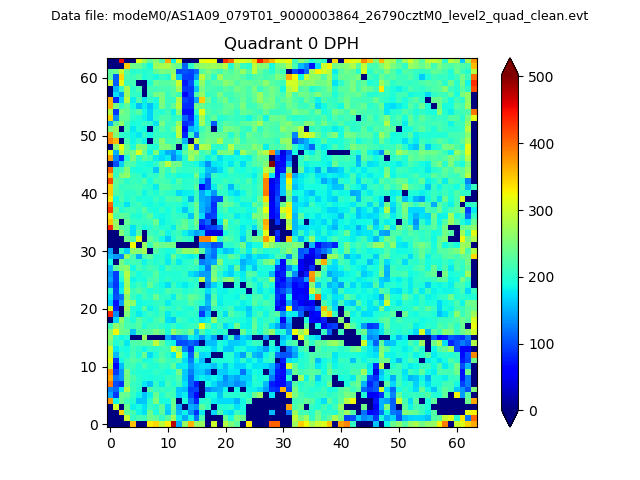 |
 |
Quadrant B |
|---|---|---|---|
| Quadrant D | 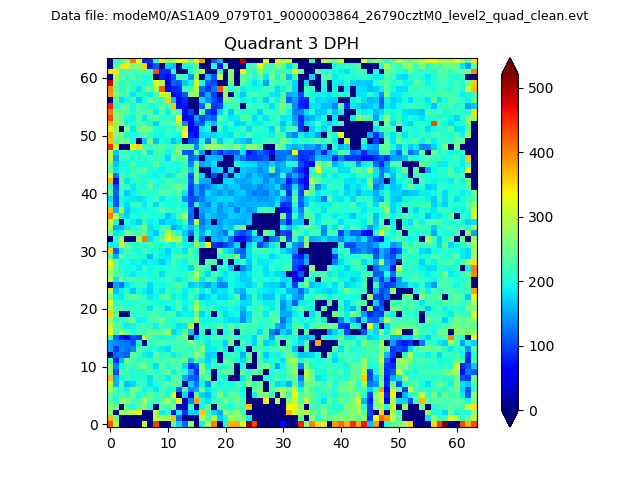 |
 |
Quadrant C |
| Plot type | Count rate plots | Images |
|---|---|---|
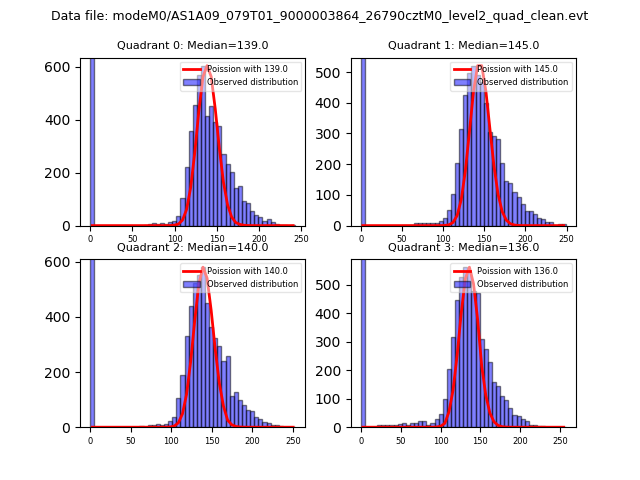
| Comparison with Poisson distribution Blue bars denote a histogram of data divided into 1 sec bins. Red curve is a Poisson curve with rate = median count rate of data. |
 |
 |
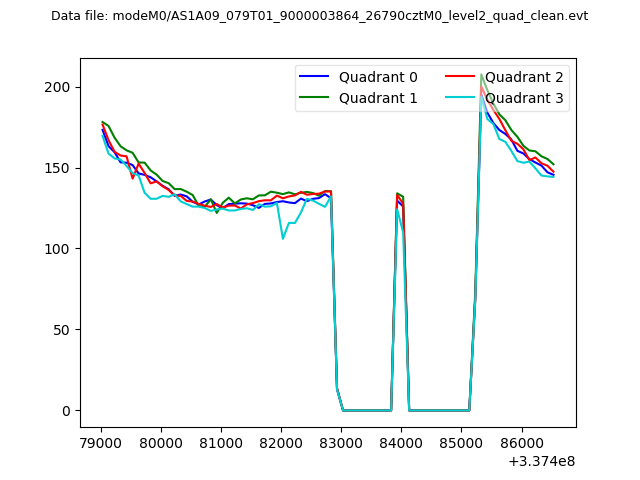
| Quadrant-wise count rates Data is divided into 100 sec bins |
 |
|
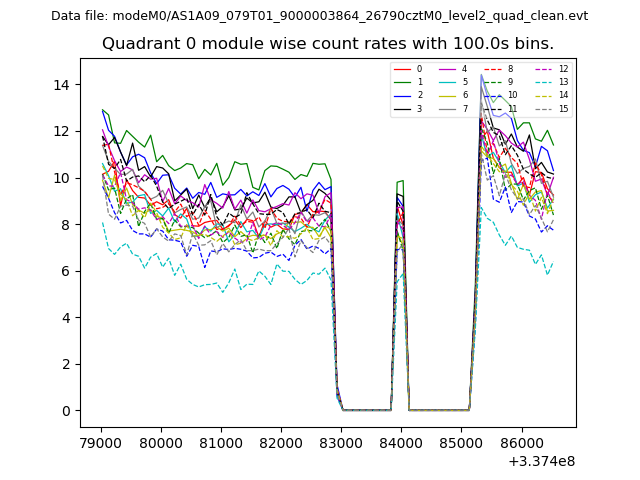
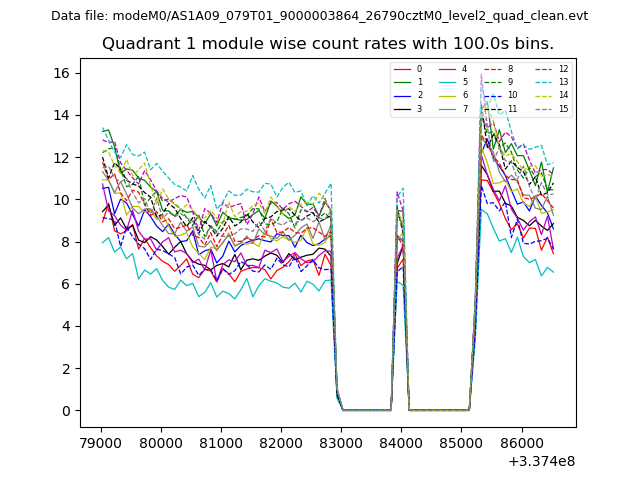
| Module-wise count rates for Quadrant A Data is divided into 100 sec bins |
 |
 |
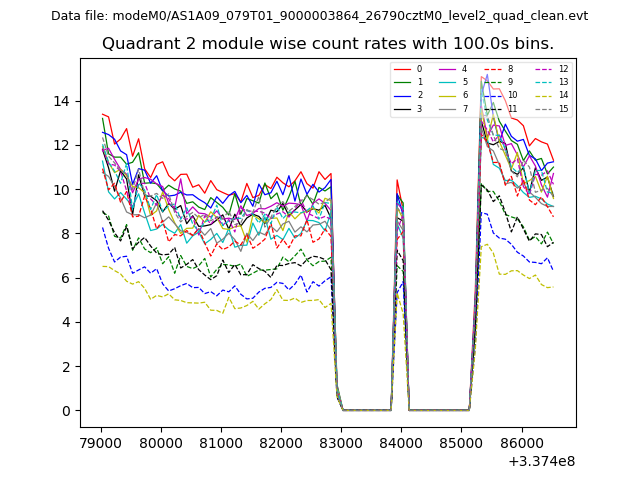
| Module-wise count rates for Quadrant B Data is divided into 100 sec bins |
 |
 |
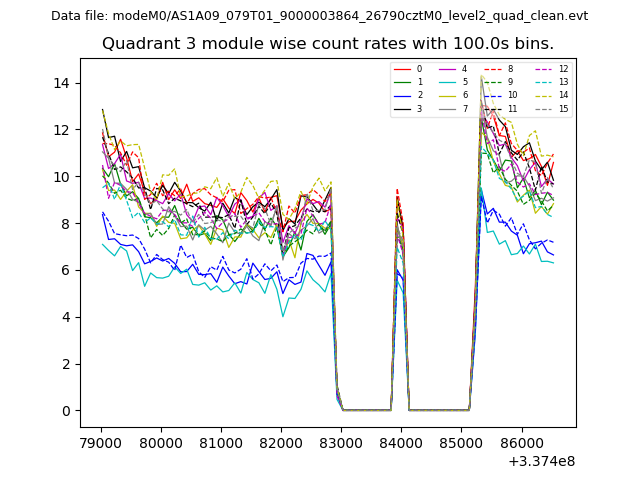
| Module-wise count rates for Quadrant C Data is divided into 100 sec bins |
 |
 |
| Module-wise count rates for Quadrant D Data is divided into 100 sec bins |
 |
 |
| Parameter | Plot |
|---|---|
| CZT HV Monitor | 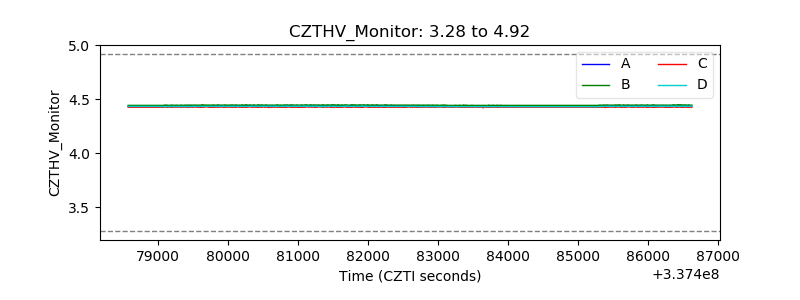 |
| D_VDD | 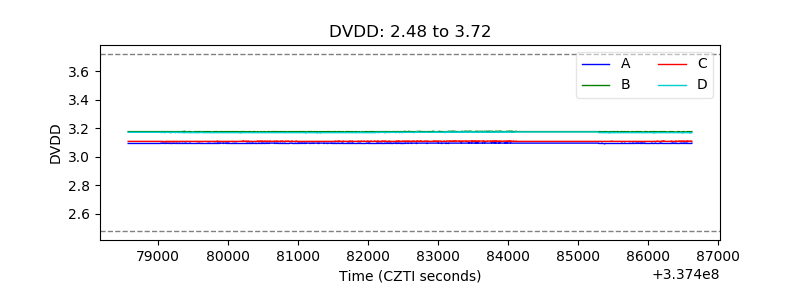 |
| Temperature 1 | 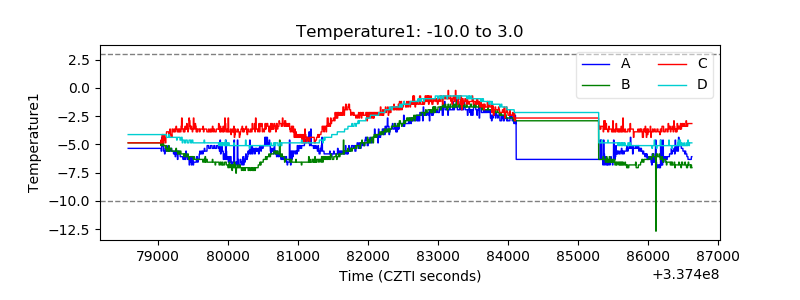 |
| Veto HV Monitor | 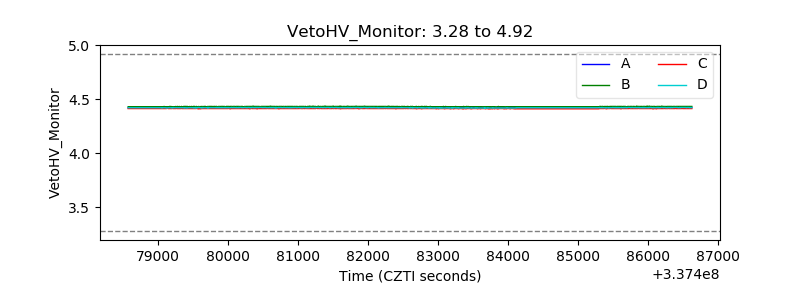 |
| Veto LLD |  |
| Alpha Counter | 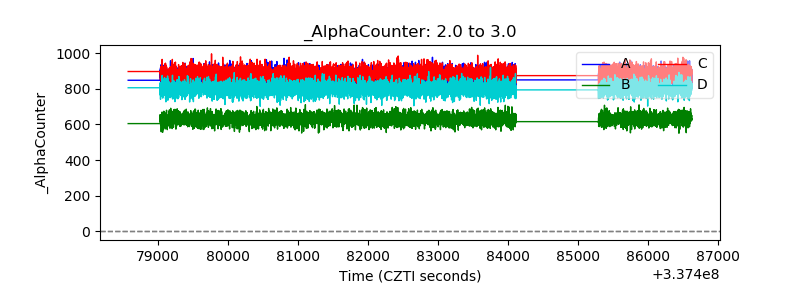 |
| _CPM_Rate | 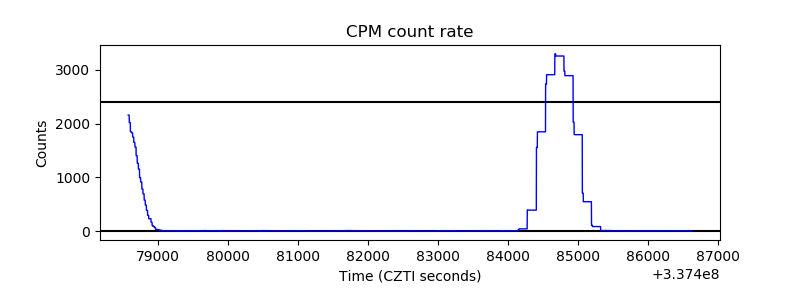 |
| CZT Counter | 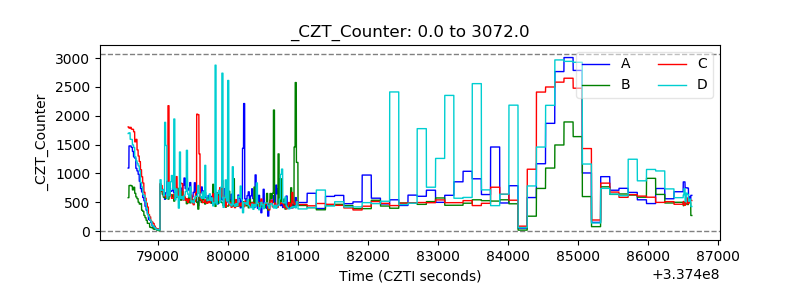 |
| +2.5 Volts monitor |  |
| +5 Volts monitor | 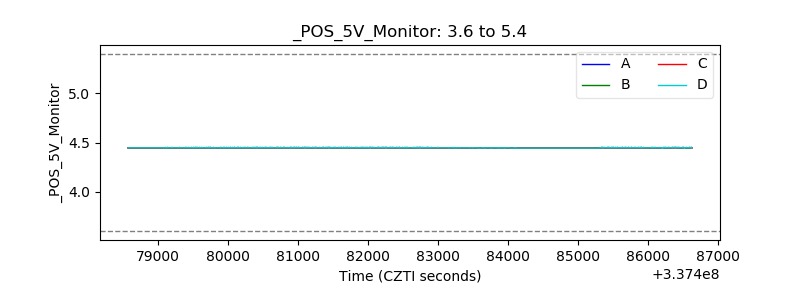 |
| _ROLL_ROT | 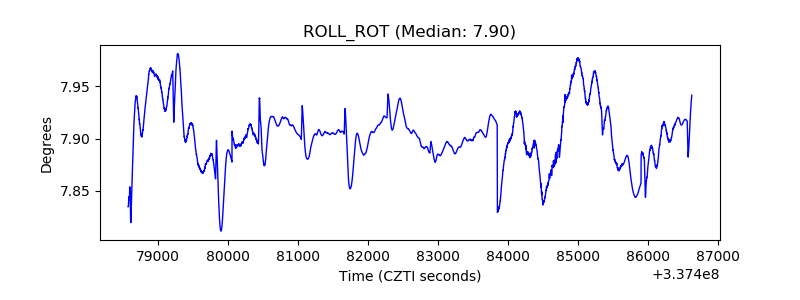 |
| _Roll_DEC | 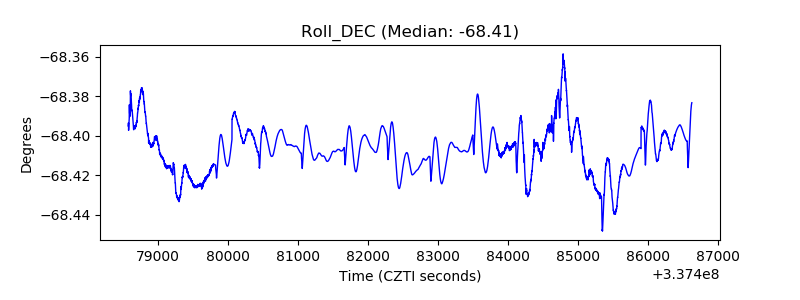 |
| _Roll_RA | 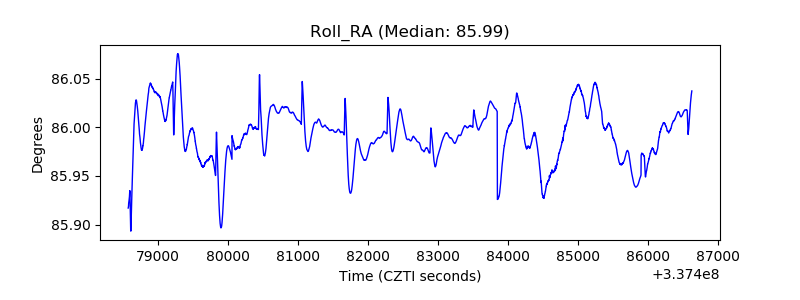 |
| Veto Counter | 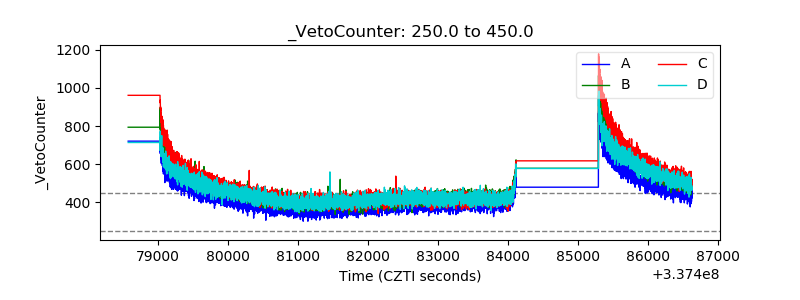 |