| Param | Original file | Final file |
|---|---|---|
| Filename | modeM0/AS1A09_079T01_9000003864_26791cztM0_level2.evt | modeM0/AS1A09_079T01_9000003864_26791cztM0_level2_quad_clean.evt |
| Size (bytes) | 529,309,440 | 124,142,400 |
| Size | 504.8 MB | 118.4 MB |
| Events in quadrant A | 4,661,168 | 813,043 |
| Events in quadrant B | 3,383,309 | 857,371 |
| Events in quadrant C | 3,500,764 | 838,058 |
| Events in quadrant D | 4,058,438 | 811,998 |
| Mode M9 | |||
|---|---|---|---|
| Quadrant | BADHDUFLAG | Total packets | Discarded packets |
| A | 0 | 16 | 0 |
| B | 0 | 17 | 0 |
| C | 0 | 17 | 0 |
| D | 0 | 17 | 0 |
| Mode M0 | |||
|---|---|---|---|
| Quadrant | BADHDUFLAG | Total packets | Discarded packets |
| A | 0 | 18282 | 0 |
| B | 0 | 13953 | 0 |
| C | 0 | 14294 | 0 |
| D | 0 | 16335 | 0 |
| Quadrant | Total seconds | Saturated seconds | Saturation percentage |
|---|---|---|---|
| A | 6298 | 100 | 1.587806% |
| B | 6298 | 45 | 0.714513% |
| C | 6298 | 90 | 1.429025% |
| D | 6298 | 77 | 1.222610% |
Noise dominated data is calculated using 1-second bins in cleaned event files. If a bin has >2000 counts, and if more than 50% of those come from <1% of pixels, then it is considered to be noise-dominated and hence unusable.
| Quadrant | # 1 sec bins | Bins with >0 counts | Bins with >2000 counts | High rate bins dominated by noise | Noise dominated (total time) | Noise dominated (detector-on time) | Marked lightcurve |
|---|---|---|---|---|---|---|---|
| A | 7583 | 6299 | 32 | 32 | 0.42% | 0.51% | 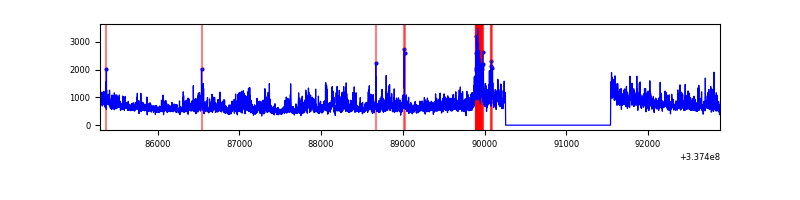 |
| B | 7583 | 6299 | 1 | 1 | 0.01% | 0.02% |  |
| C | 7583 | 6299 | 9 | 9 | 0.12% | 0.14% |  |
| D | 7583 | 6299 | 52 | 52 | 0.69% | 0.83% |  |
Top three noisy pixels from each quadrant. If the there are fewer than three noisy pixels in the level2.evt file, extra rows are filled as -1
| Pixel properties | Quadrant properties | ||||||
|---|---|---|---|---|---|---|---|
| Quadrant | DetID | PixID | Counts | Sigma | Mean | Median | Sigma |
| A | 0 | 13 | 1474088 | 8997.71 | 825 | 809 | 163.7 |
| A | 13 | 254 | 9948 | 55.81 | 825 | 809 | 163.7 |
| A | 0 | 226 | 6949 | 37.5 | 825 | 809 | 163.7 |
| B | 3 | 64 | 63619 | 414.89 | 834 | 817 | 151.4 |
| B | 10 | 246 | 33577 | 216.42 | 834 | 817 | 151.4 |
| B | 12 | 111 | 18019 | 113.64 | 834 | 817 | 151.4 |
| C | 14 | 238 | 134834 | 700.07 | 830 | 837 | 191.4 |
| C | 15 | 208 | 104341 | 540.76 | 830 | 837 | 191.4 |
| C | 2 | 16 | 21016 | 105.43 | 830 | 837 | 191.4 |
| D | 15 | 21 | 324246 | 1653.41 | 827 | 810 | 195.6 |
| D | 1 | 52 | 286305 | 1459.46 | 827 | 810 | 195.6 |
| D | 7 | 80 | 187357 | 953.63 | 827 | 810 | 195.6 |
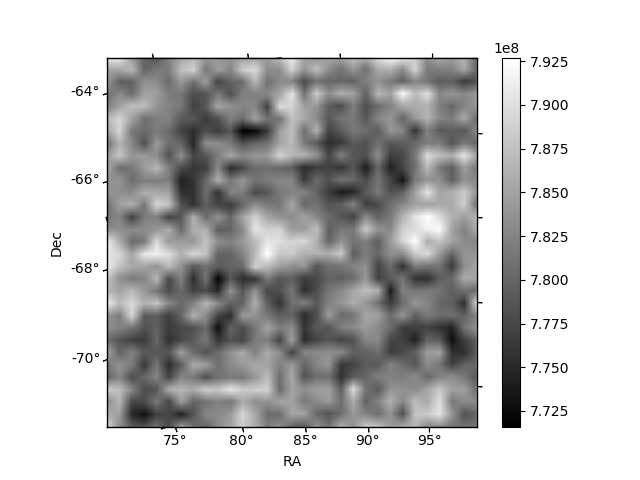
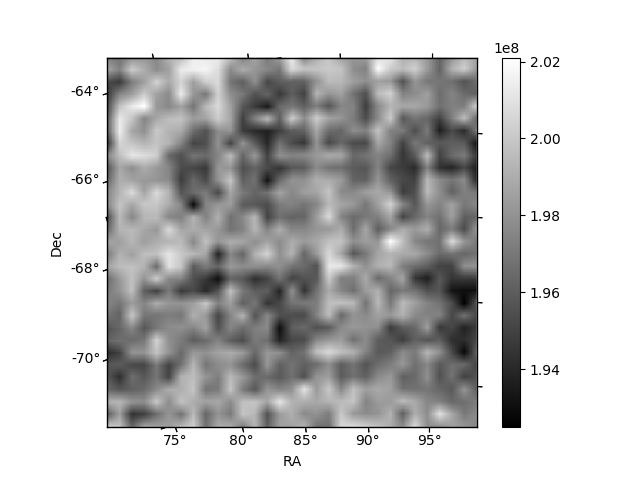
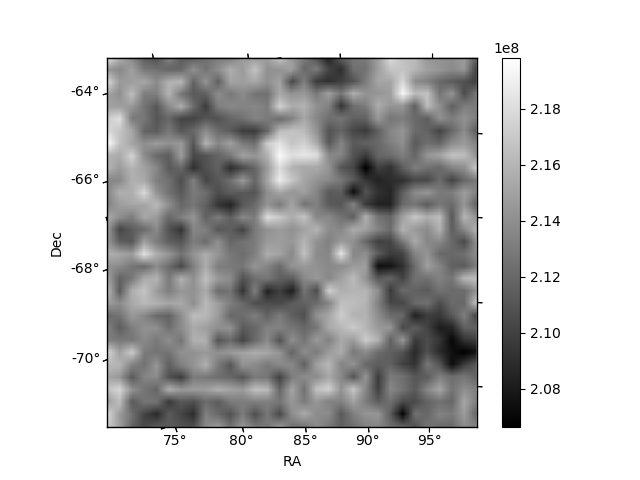
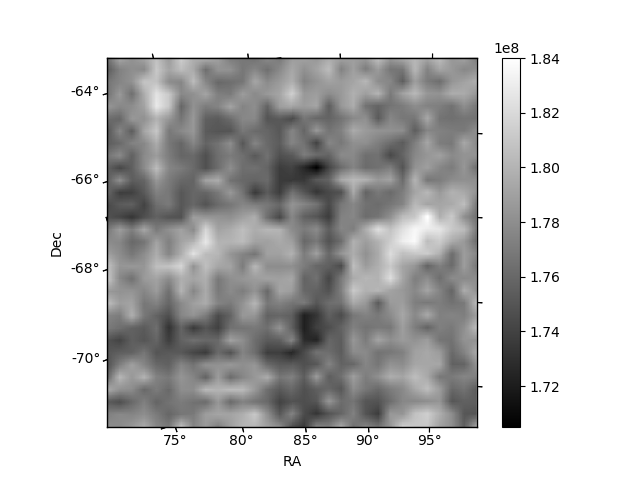
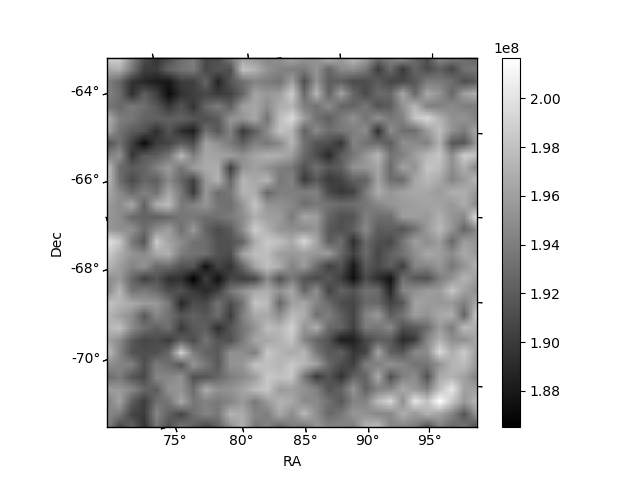
Histogram calculated using DETX and DETY for each event in the final _common_clean file
| Quadrant A | 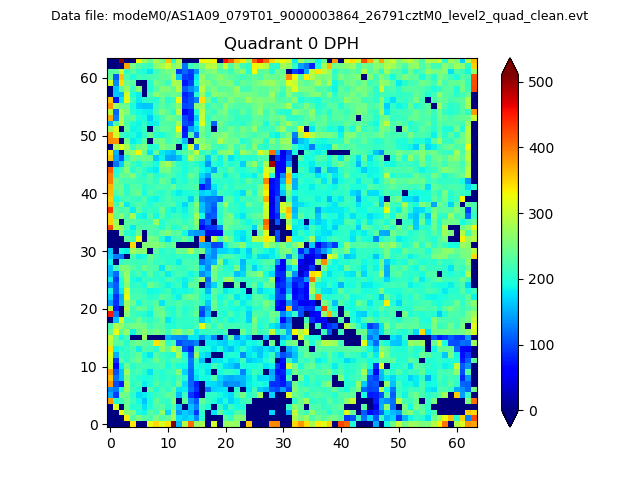 |
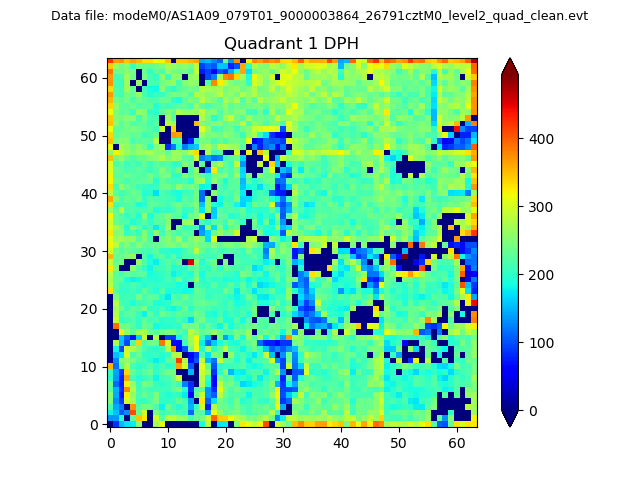 |
Quadrant B |
|---|---|---|---|
| Quadrant D |  |
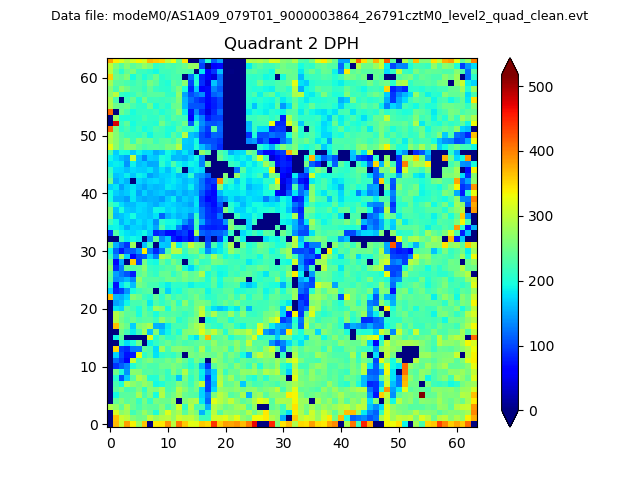 |
Quadrant C |
| Plot type | Count rate plots | Images |
|---|---|---|
| Comparison with Poisson distribution Blue bars denote a histogram of data divided into 1 sec bins. Red curve is a Poisson curve with rate = median count rate of data. |
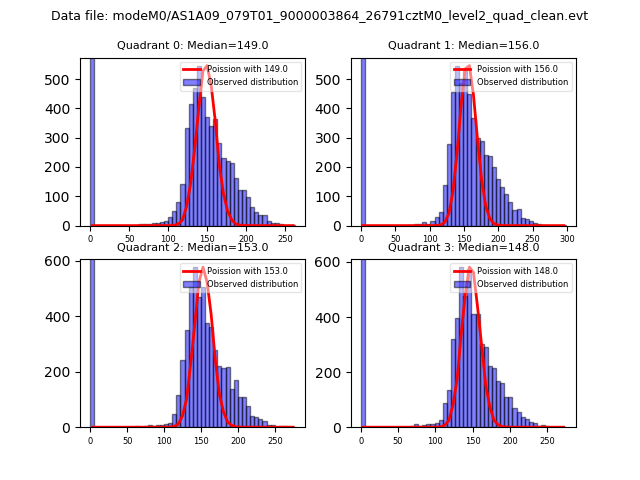 |
 |
| Quadrant-wise count rates Data is divided into 100 sec bins |
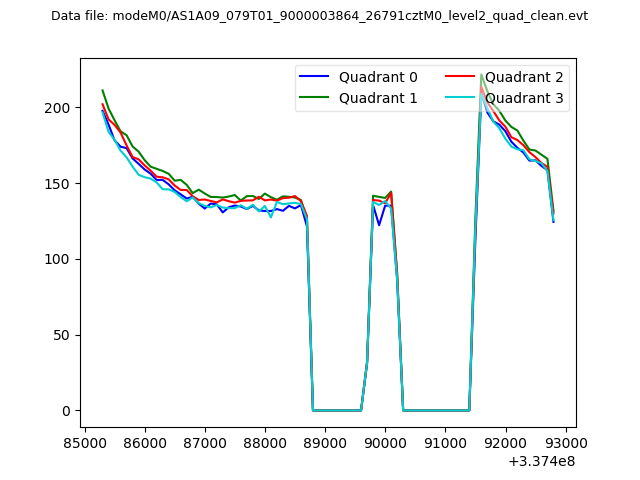 |
|
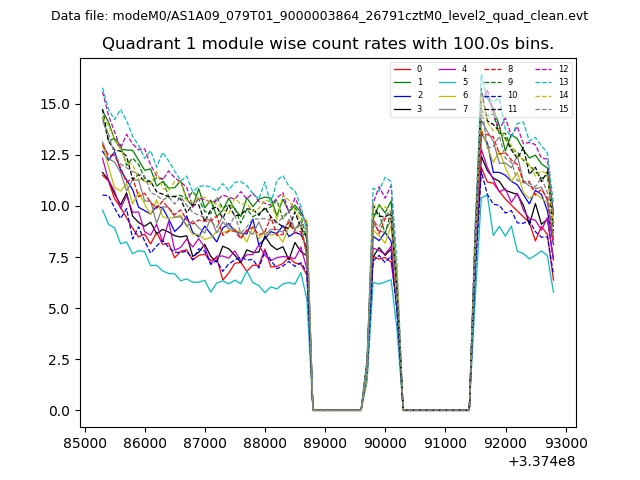
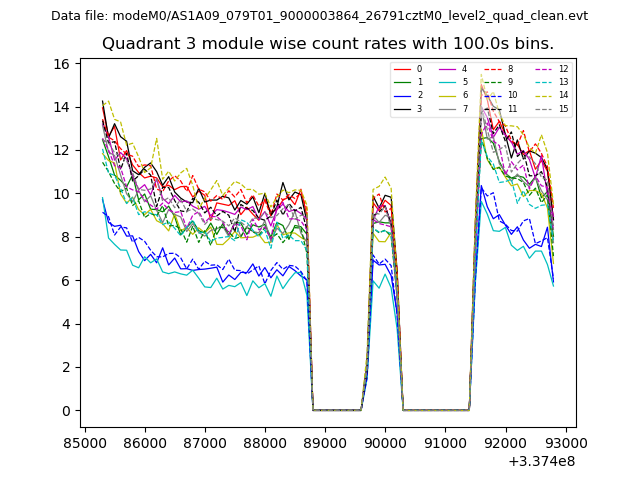
| Module-wise count rates for Quadrant A Data is divided into 100 sec bins |
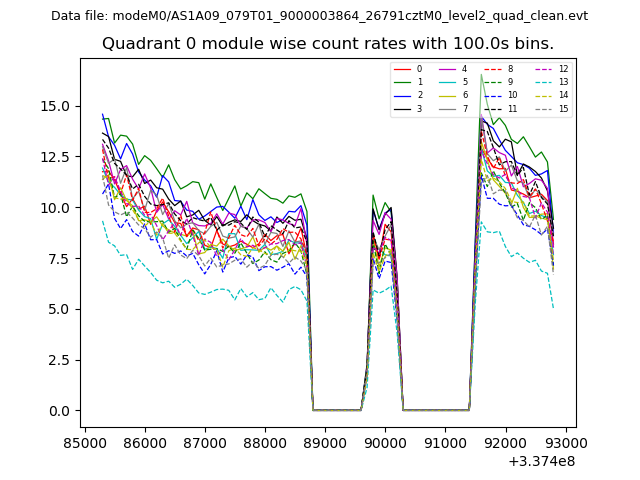 |
 |
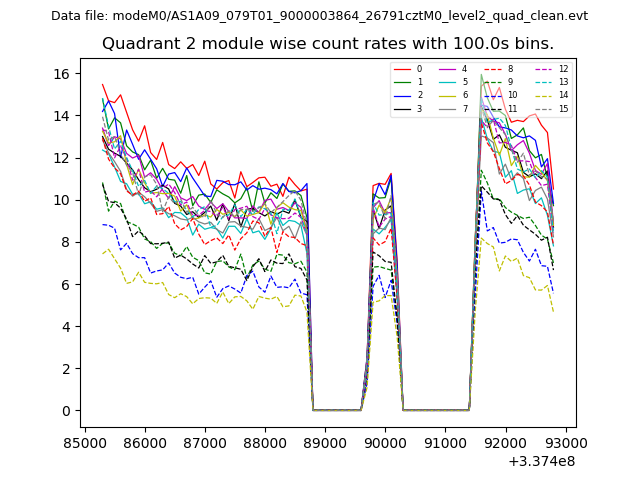
| Module-wise count rates for Quadrant B Data is divided into 100 sec bins |
 |
 |
| Module-wise count rates for Quadrant C Data is divided into 100 sec bins |
 |
 |
| Module-wise count rates for Quadrant D Data is divided into 100 sec bins |
 |
 |
| Parameter | Plot |
|---|---|
| CZT HV Monitor | 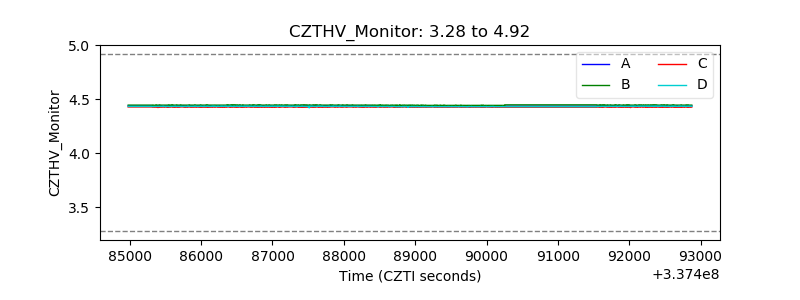 |
| D_VDD | 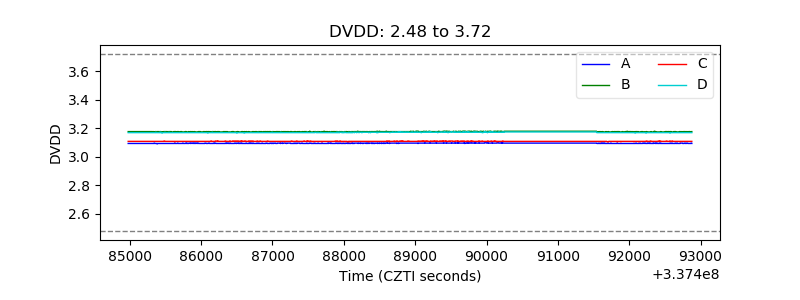 |
| Temperature 1 | 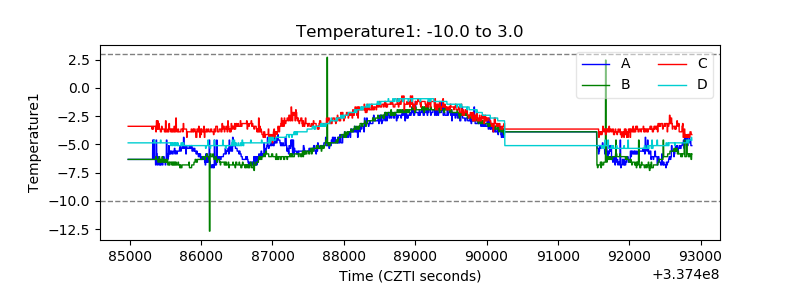 |
| Veto HV Monitor | 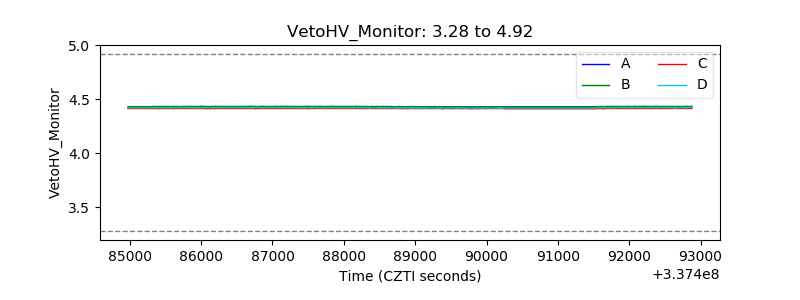 |
| Veto LLD | 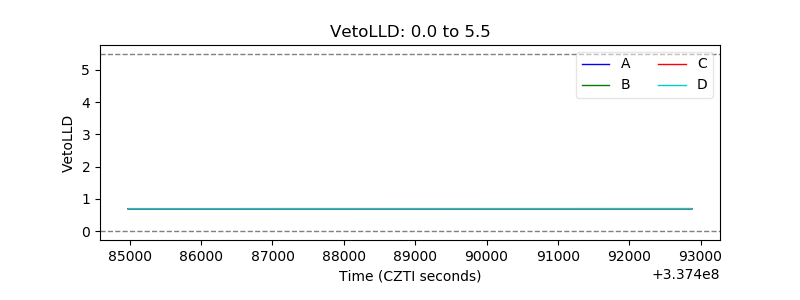 |
| Alpha Counter | 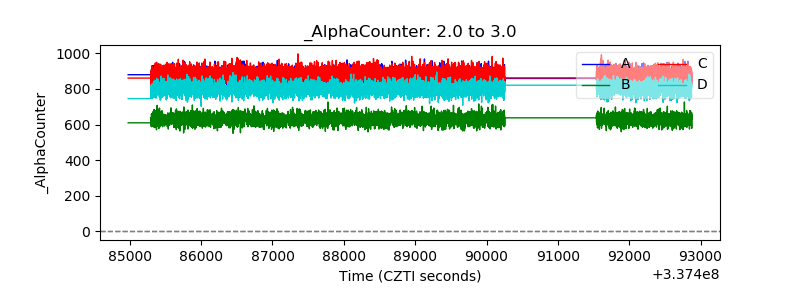 |
| _CPM_Rate | 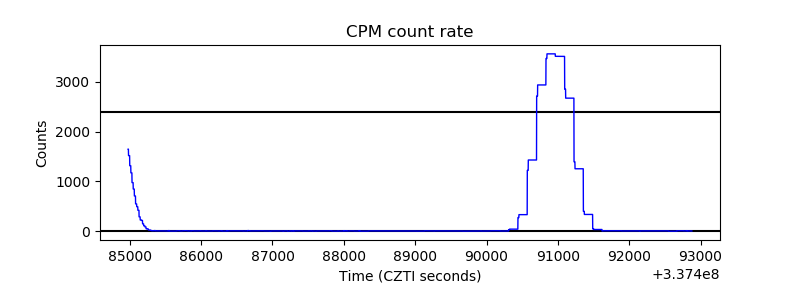 |
| CZT Counter | 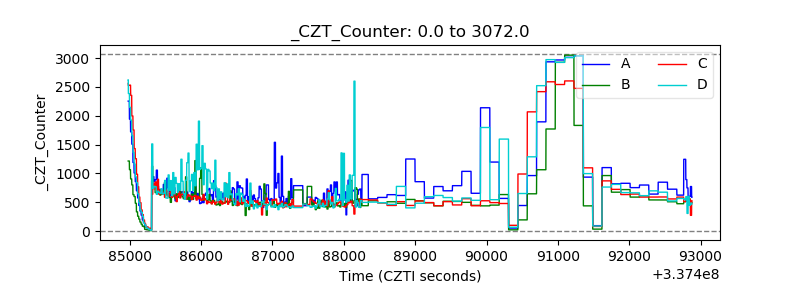 |
| +2.5 Volts monitor |  |
| +5 Volts monitor |  |
| _ROLL_ROT | 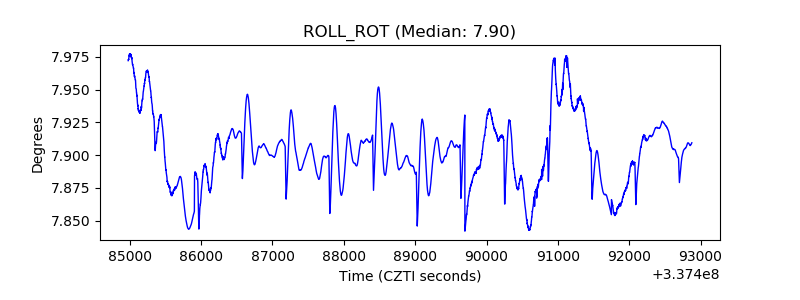 |
| _Roll_DEC | 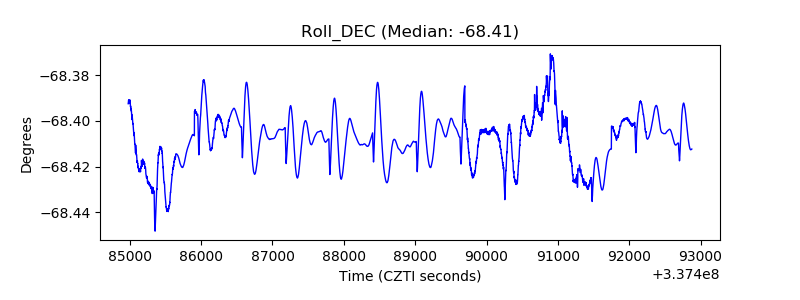 |
| _Roll_RA | 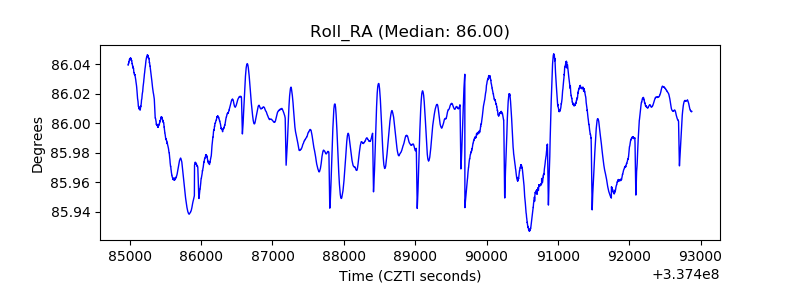 |
| Veto Counter | 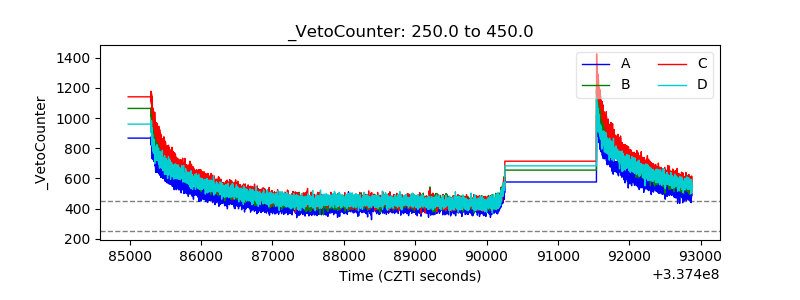 |