| Param | Original file | Final file |
|---|---|---|
| Filename | modeM0/AS1A09_079T01_9000003864_26792cztM0_level2.evt | modeM0/AS1A09_079T01_9000003864_26792cztM0_level2_quad_clean.evt |
| Size (bytes) | 658,630,080 | 121,320,000 |
| Size | 628.1 MB | 115.7 MB |
| Events in quadrant A | 4,712,932 | 840,639 |
| Events in quadrant B | 3,382,183 | 883,346 |
| Events in quadrant C | 3,530,301 | 865,133 |
| Events in quadrant D | 7,902,923 | 652,926 |
| Mode M9 | |||
|---|---|---|---|
| Quadrant | BADHDUFLAG | Total packets | Discarded packets |
| A | 0 | 16 | 0 |
| B | 0 | 17 | 0 |
| C | 0 | 17 | 0 |
| D | 0 | 17 | 0 |
| Mode M0 | |||
|---|---|---|---|
| Quadrant | BADHDUFLAG | Total packets | Discarded packets |
| A | 0 | 18472 | 0 |
| B | 0 | 13809 | 0 |
| C | 0 | 14346 | 0 |
| D | 0 | 27639 | 0 |
| Quadrant | Total seconds | Saturated seconds | Saturation percentage |
|---|---|---|---|
| A | 6184 | 64 | 1.034929% |
| B | 6184 | 42 | 0.679172% |
| C | 6184 | 99 | 1.600906% |
| D | 6184 | 2066 | 33.408797% |
Noise dominated data is calculated using 1-second bins in cleaned event files. If a bin has >2000 counts, and if more than 50% of those come from <1% of pixels, then it is considered to be noise-dominated and hence unusable.
| Quadrant | # 1 sec bins | Bins with >0 counts | Bins with >2000 counts | High rate bins dominated by noise | Noise dominated (total time) | Noise dominated (detector-on time) | Marked lightcurve |
|---|---|---|---|---|---|---|---|
| A | 7569 | 6185 | 2 | 2 | 0.03% | 0.03% | 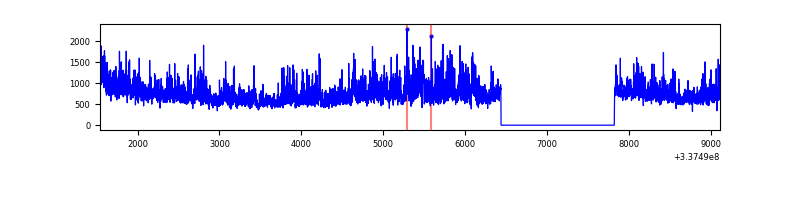 |
| B | 7569 | 6185 | 5 | 5 | 0.07% | 0.08% | 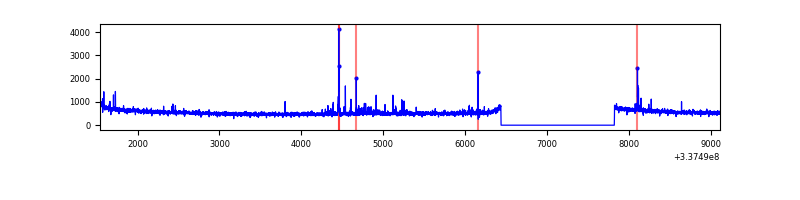 |
| C | 7569 | 6185 | 10 | 10 | 0.13% | 0.16% | 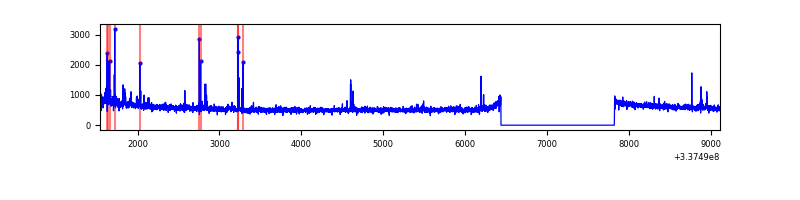 |
| D | 7569 | 6184 | 1689 | 1689 | 22.31% | 27.31% | 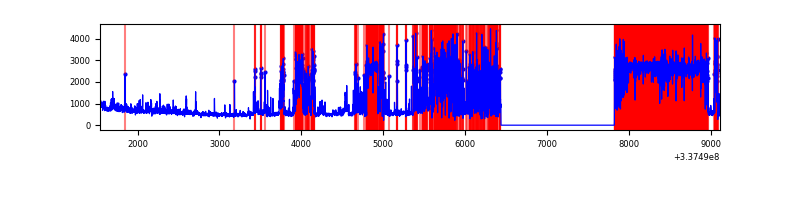 |
Top three noisy pixels from each quadrant. If the there are fewer than three noisy pixels in the level2.evt file, extra rows are filled as -1
| Pixel properties | Quadrant properties | ||||||
|---|---|---|---|---|---|---|---|
| Quadrant | DetID | PixID | Counts | Sigma | Mean | Median | Sigma |
| A | 0 | 13 | 1448829 | 8803.62 | 841 | 828 | 164.5 |
| A | 6 | 16 | 18770 | 109.08 | 841 | 828 | 164.5 |
| A | 13 | 254 | 9625 | 53.48 | 841 | 828 | 164.5 |
| B | 10 | 246 | 56416 | 364.15 | 841 | 823 | 152.7 |
| B | 0 | 229 | 20996 | 132.14 | 841 | 823 | 152.7 |
| B | 12 | 111 | 17554 | 109.59 | 841 | 823 | 152.7 |
| C | 14 | 238 | 135963 | 695.92 | 843 | 851 | 194.1 |
| C | 15 | 208 | 93402 | 476.7 | 843 | 851 | 194.1 |
| C | 2 | 16 | 16046 | 78.26 | 843 | 851 | 194.1 |
| D | 15 | 36 | 3045084 | 19059.02 | 684 | 671 | 159.7 |
| D | 7 | 80 | 1503129 | 9405.88 | 684 | 671 | 159.7 |
| D | 1 | 52 | 512511 | 3204.28 | 684 | 671 | 159.7 |
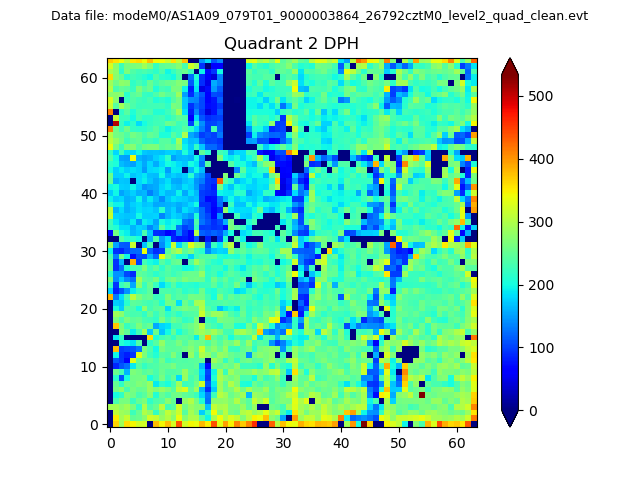
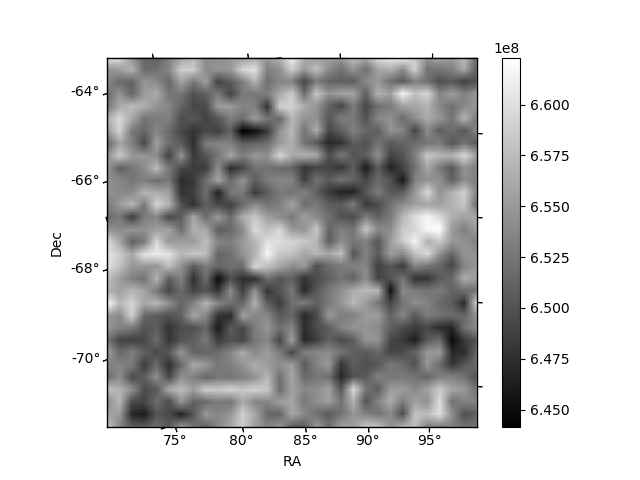
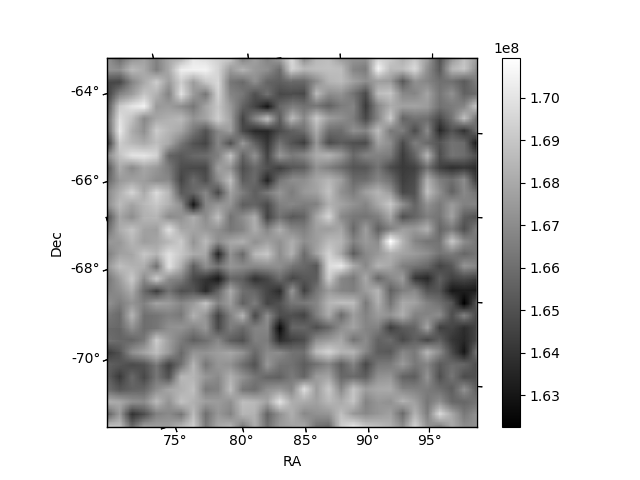
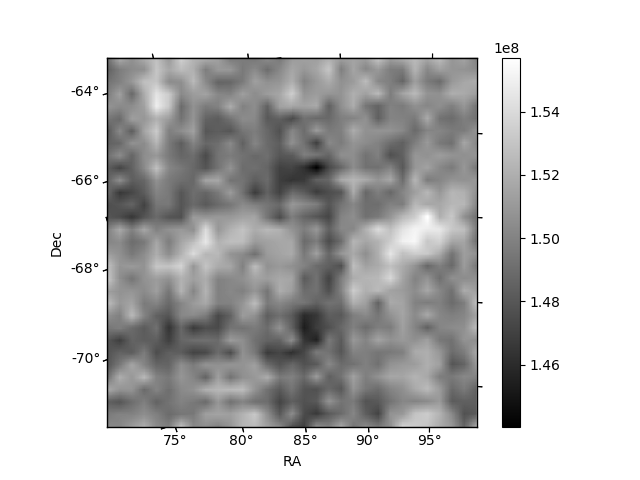
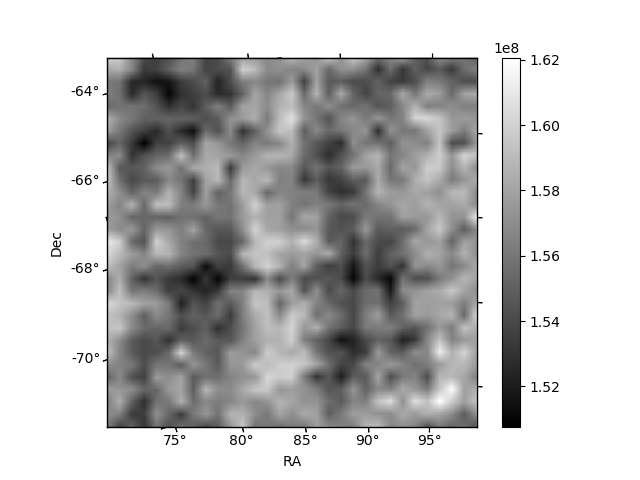
Histogram calculated using DETX and DETY for each event in the final _common_clean file
| Quadrant A | 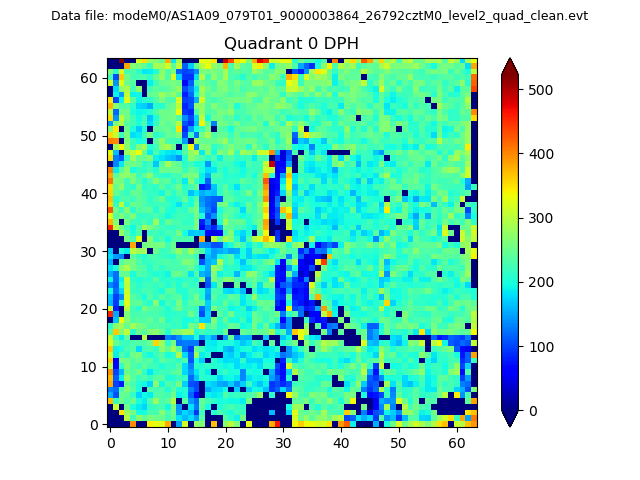 |
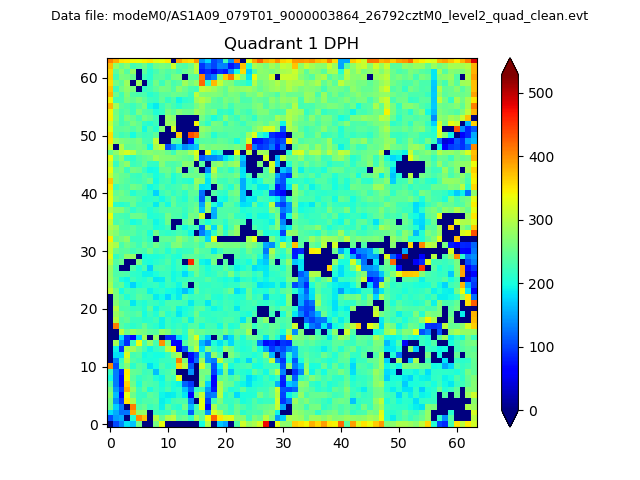 |
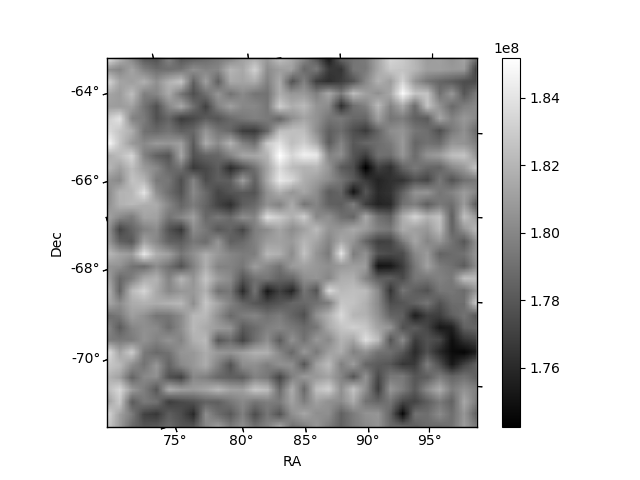
Quadrant B |
|---|---|---|---|
| Quadrant D | 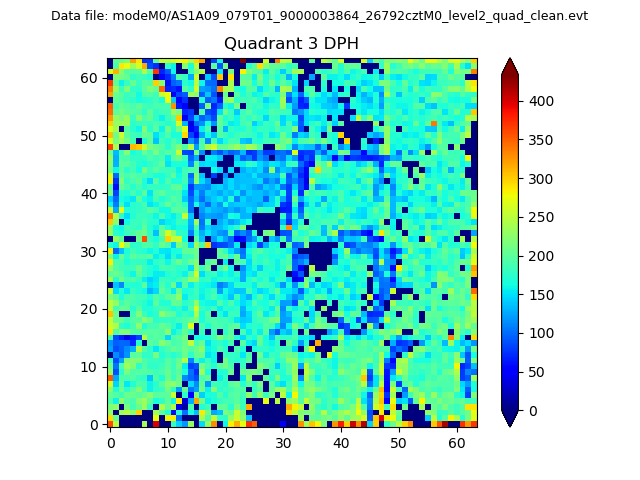 |
 |
Quadrant C |
| Plot type | Count rate plots | Images |
|---|---|---|
| Comparison with Poisson distribution Blue bars denote a histogram of data divided into 1 sec bins. Red curve is a Poisson curve with rate = median count rate of data. |
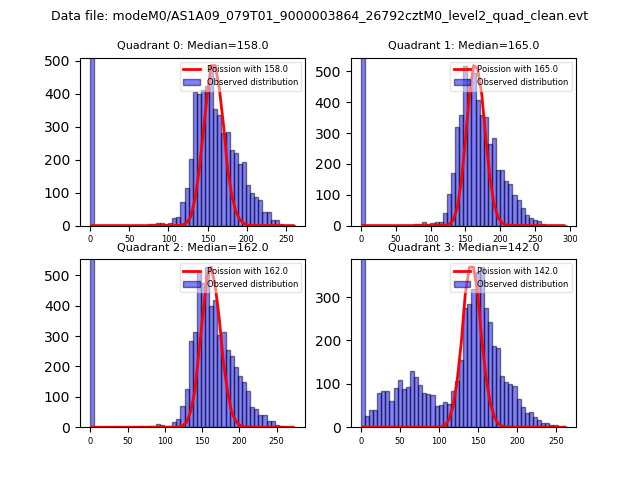 |
 |
| Quadrant-wise count rates Data is divided into 100 sec bins |
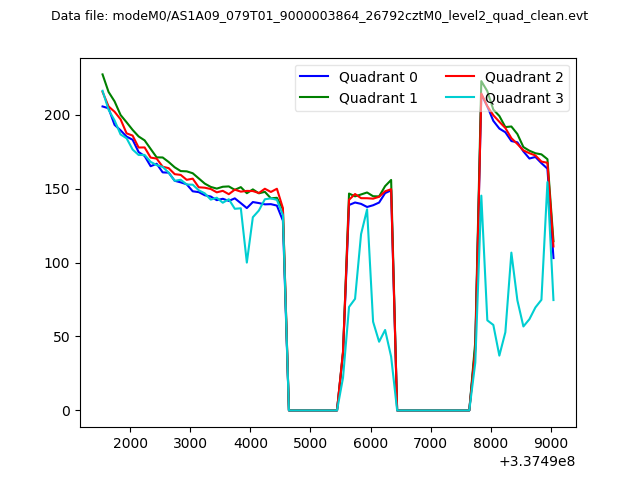 |
|
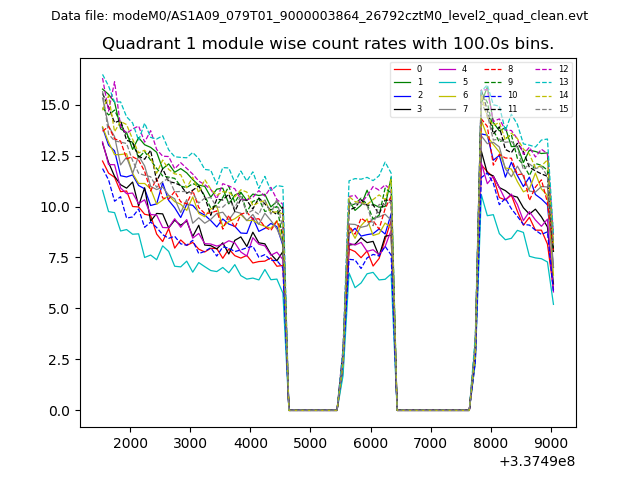
| Module-wise count rates for Quadrant A Data is divided into 100 sec bins |
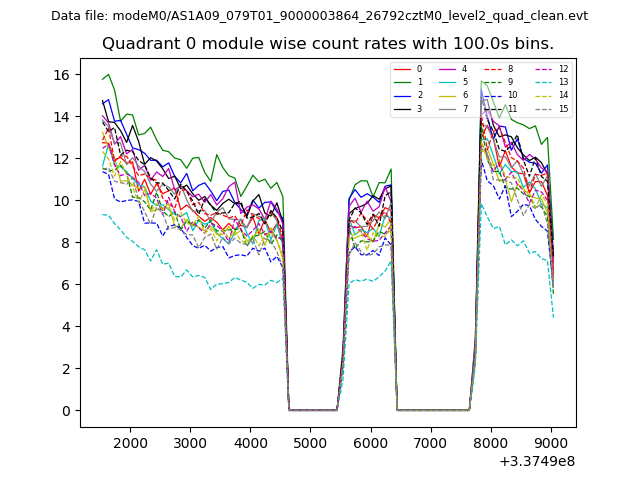 |
 |
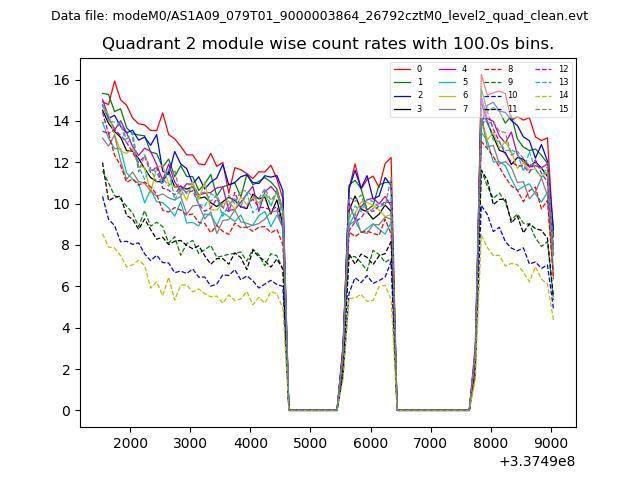
| Module-wise count rates for Quadrant B Data is divided into 100 sec bins |
 |
 |
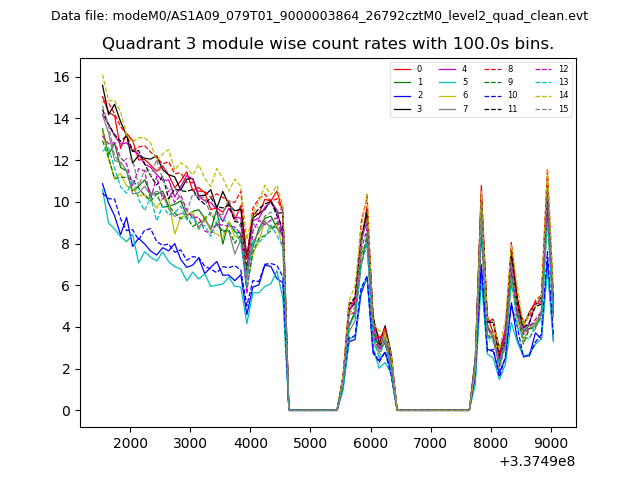
| Module-wise count rates for Quadrant C Data is divided into 100 sec bins |
 |
 |
| Module-wise count rates for Quadrant D Data is divided into 100 sec bins |
 |
 |
| Parameter | Plot |
|---|---|
| CZT HV Monitor | 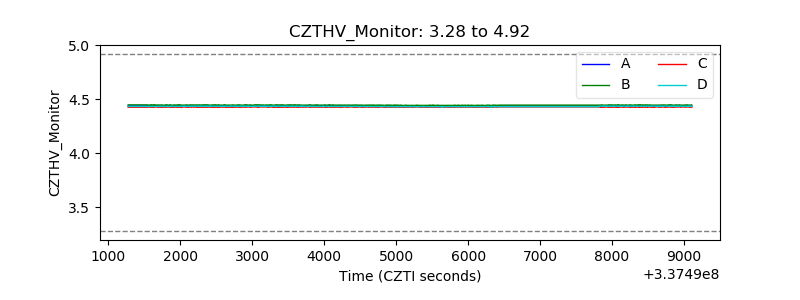 |
| D_VDD |  |
| Temperature 1 | 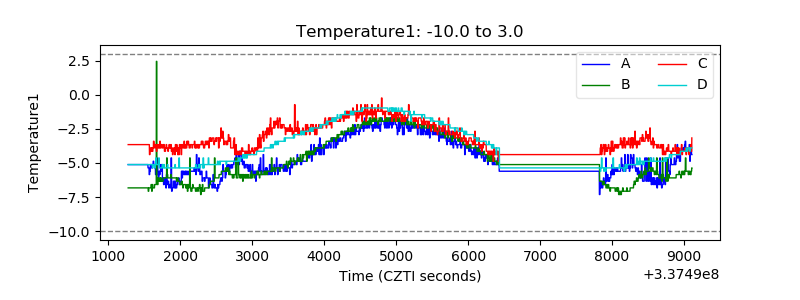 |
| Veto HV Monitor | 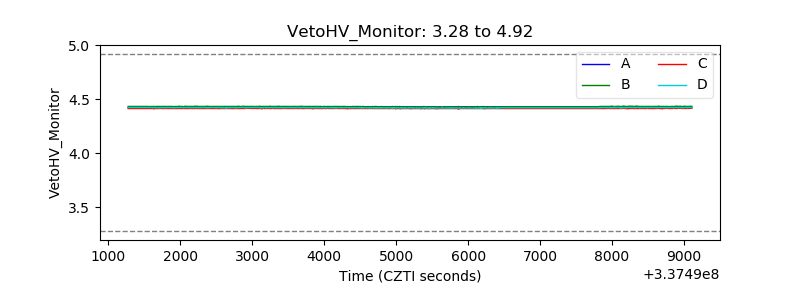 |
| Veto LLD | 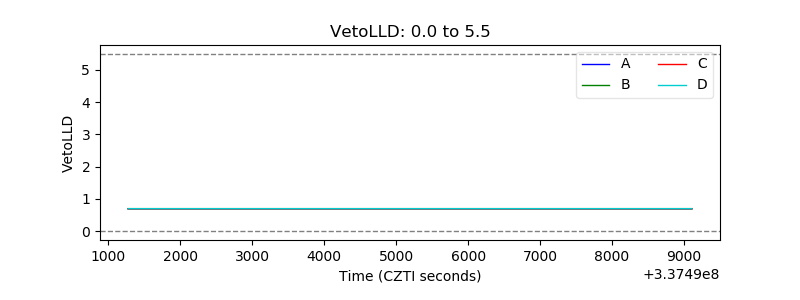 |
| Alpha Counter | 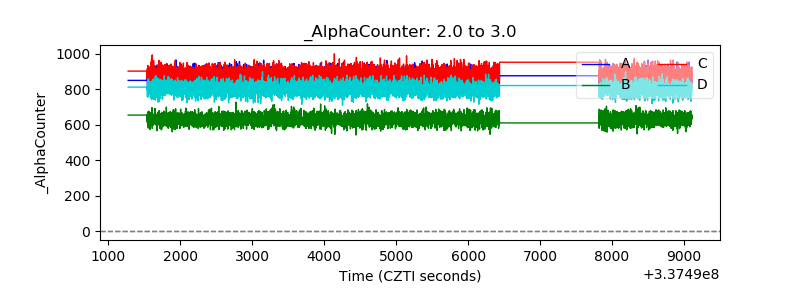 |
| _CPM_Rate | 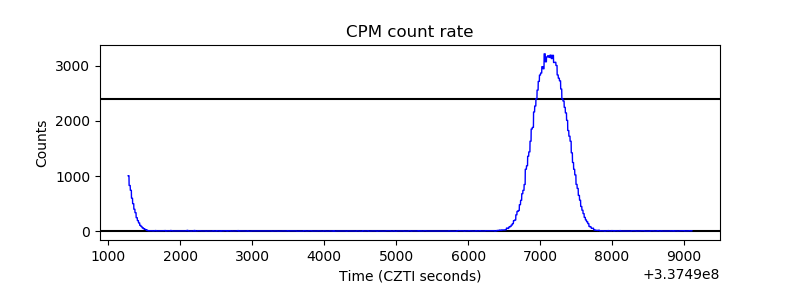 |
| CZT Counter | 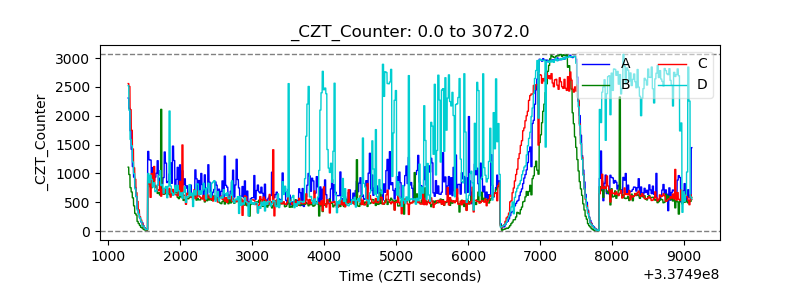 |
| +2.5 Volts monitor |  |
| +5 Volts monitor |  |
| _ROLL_ROT | 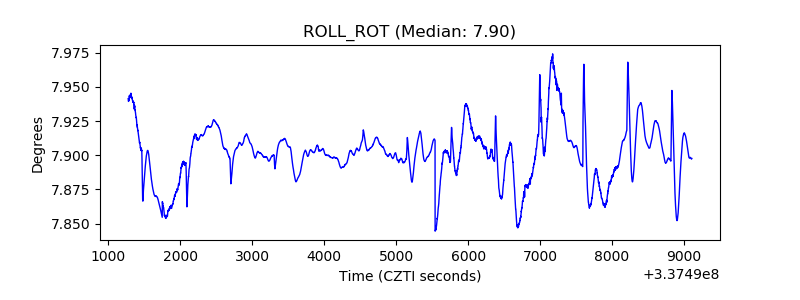 |
| _Roll_DEC |  |
| _Roll_RA | 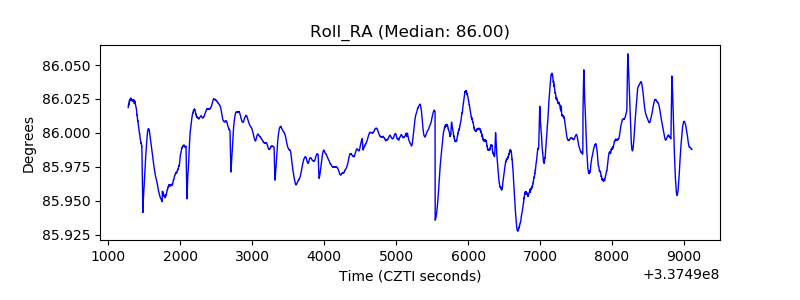 |
| Veto Counter | 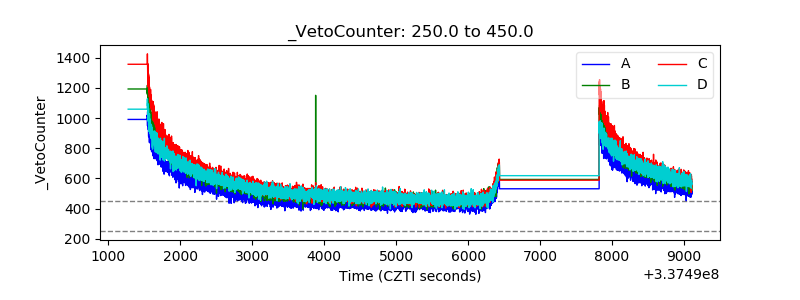 |