| Param | Original file | Final file |
|---|---|---|
| Filename | modeM0/AS1A09_079T01_9000003864_26793cztM0_level2.evt | modeM0/AS1A09_079T01_9000003864_26793cztM0_level2_quad_clean.evt |
| Size (bytes) | 748,627,200 | 106,263,360 |
| Size | 713.9 MB | 101.3 MB |
| Events in quadrant A | 4,422,152 | 746,458 |
| Events in quadrant B | 3,005,656 | 776,667 |
| Events in quadrant C | 3,288,246 | 759,278 |
| Events in quadrant D | 11,572,868 | 537,421 |
| Mode M9 | |||
|---|---|---|---|
| Quadrant | BADHDUFLAG | Total packets | Discarded packets |
| A | 0 | 14 | 0 |
| B | 0 | 14 | 0 |
| C | 0 | 14 | 0 |
| D | 0 | 14 | 0 |
| Mode M0 | |||
|---|---|---|---|
| Quadrant | BADHDUFLAG | Total packets | Discarded packets |
| A | 0 | 17290 | 0 |
| B | 0 | 12167 | 0 |
| C | 0 | 13145 | 0 |
| D | 0 | 38246 | 0 |
| Quadrant | Total seconds | Saturated seconds | Saturation percentage |
|---|---|---|---|
| A | 5677 | 102 | 1.796724% |
| B | 5677 | 48 | 0.845517% |
| C | 5678 | 147 | 2.588940% |
| D | 5678 | 3491 | 61.482917% |
Noise dominated data is calculated using 1-second bins in cleaned event files. If a bin has >2000 counts, and if more than 50% of those come from <1% of pixels, then it is considered to be noise-dominated and hence unusable.
| Quadrant | # 1 sec bins | Bins with >0 counts | Bins with >2000 counts | High rate bins dominated by noise | Noise dominated (total time) | Noise dominated (detector-on time) | Marked lightcurve |
|---|---|---|---|---|---|---|---|
| A | 7037 | 5678 | 17 | 17 | 0.24% | 0.30% | 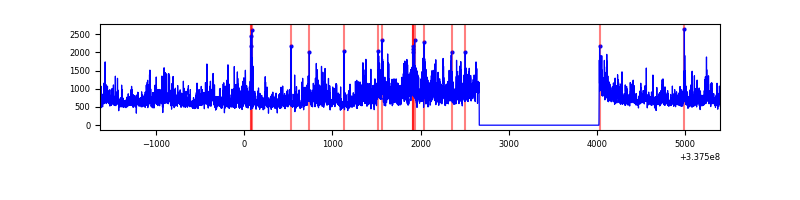 |
| B | 7037 | 5678 | 1 | 1 | 0.01% | 0.02% | 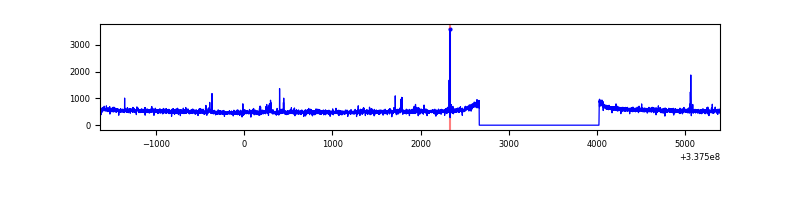 |
| C | 7038 | 5679 | 24 | 24 | 0.34% | 0.42% | 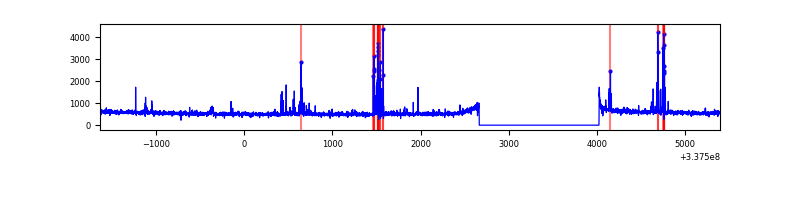 |
| D | 7038 | 5679 | 3305 | 3305 | 46.96% | 58.20% | 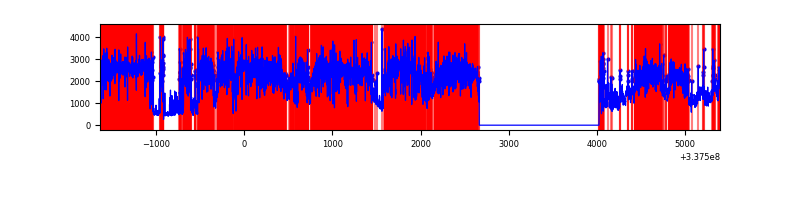 |
Top three noisy pixels from each quadrant. If the there are fewer than three noisy pixels in the level2.evt file, extra rows are filled as -1
| Pixel properties | Quadrant properties | ||||||
|---|---|---|---|---|---|---|---|
| Quadrant | DetID | PixID | Counts | Sigma | Mean | Median | Sigma |
| A | 0 | 13 | 1453405 | 9653.59 | 764 | 751 | 150.5 |
| A | 6 | 16 | 24883 | 160.37 | 764 | 751 | 150.5 |
| A | 13 | 254 | 8504 | 51.52 | 764 | 751 | 150.5 |
| B | 0 | 229 | 15856 | 108.64 | 757 | 740 | 139.1 |
| B | 12 | 111 | 15659 | 107.22 | 757 | 740 | 139.1 |
| B | 0 | 190 | 14570 | 99.39 | 757 | 740 | 139.1 |
| C | 15 | 208 | 143473 | 821.65 | 753 | 759 | 173.7 |
| C | 14 | 238 | 122322 | 699.88 | 753 | 759 | 173.7 |
| C | 2 | 16 | 76246 | 434.6 | 753 | 759 | 173.7 |
| D | 15 | 36 | 7898844 | 56586.22 | 596 | 586 | 139.6 |
| D | 7 | 80 | 767328 | 5493.24 | 596 | 586 | 139.6 |
| D | 1 | 52 | 532486 | 3810.74 | 596 | 586 | 139.6 |
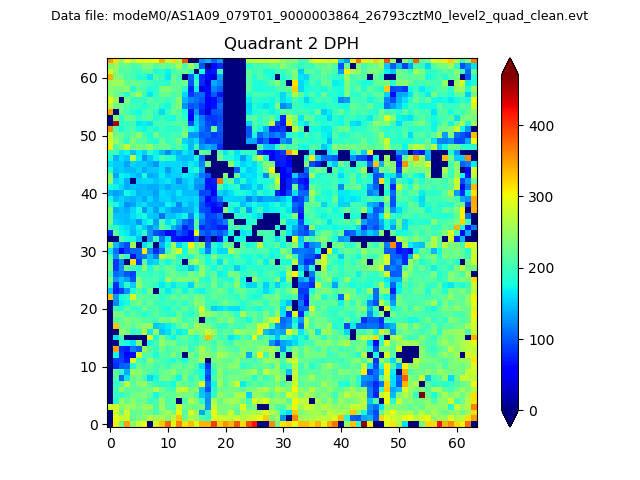
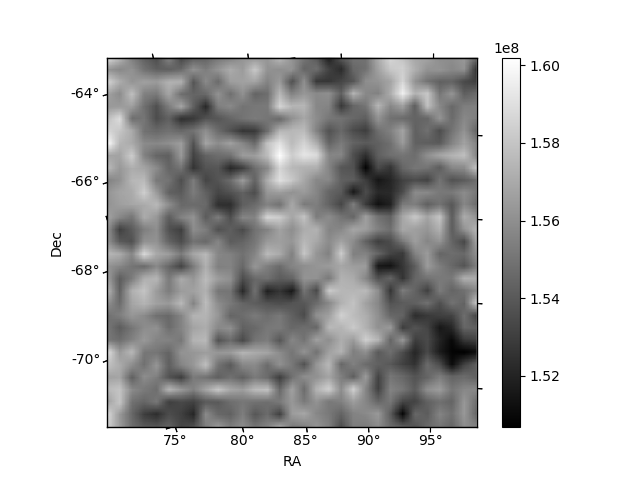
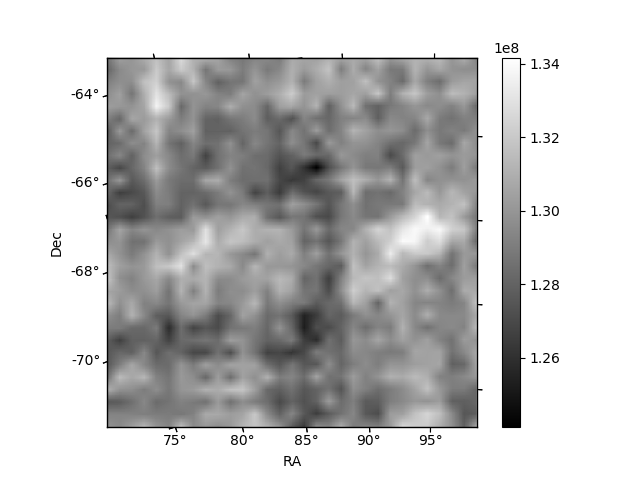
Histogram calculated using DETX and DETY for each event in the final _common_clean file
| Quadrant A | 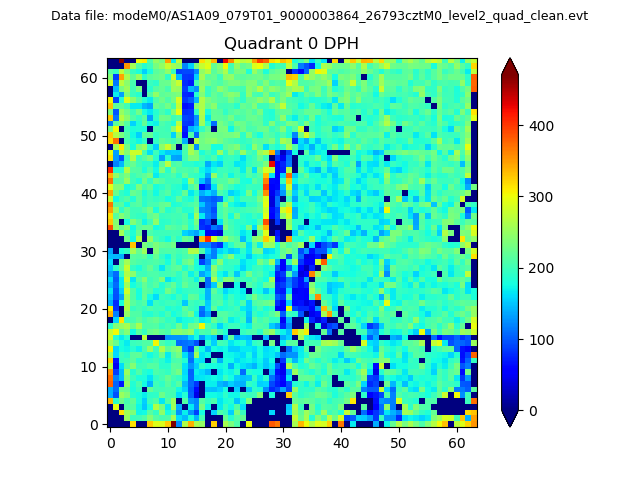 |
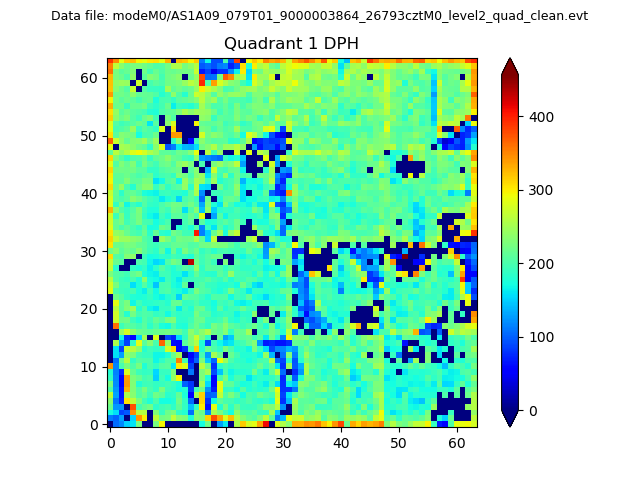 |
Quadrant B |
|---|---|---|---|
| Quadrant D | 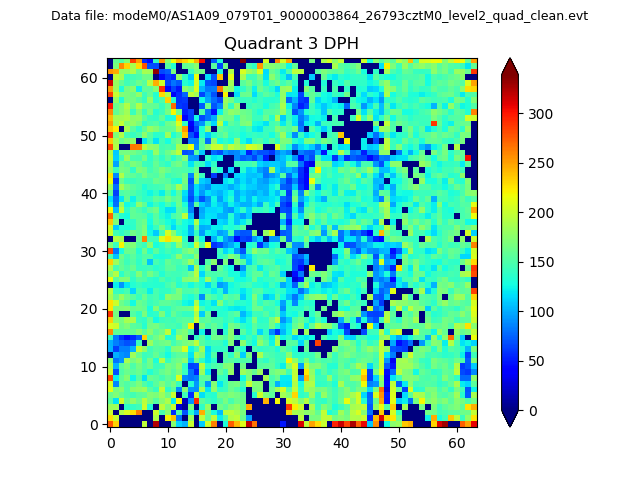 |
 |
Quadrant C |
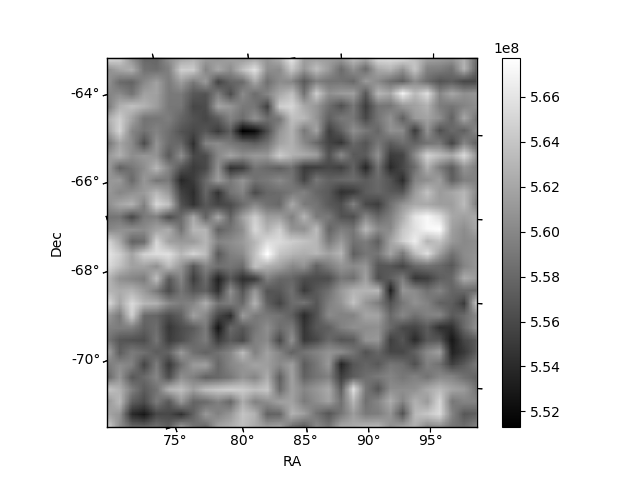
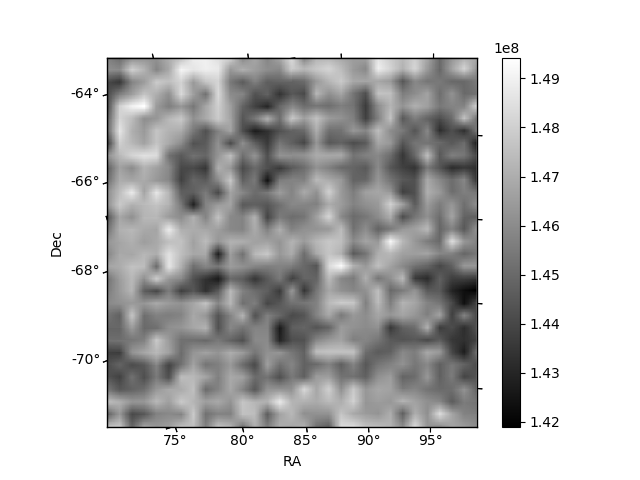
| Plot type | Count rate plots | Images |
|---|---|---|
| Comparison with Poisson distribution Blue bars denote a histogram of data divided into 1 sec bins. Red curve is a Poisson curve with rate = median count rate of data. |
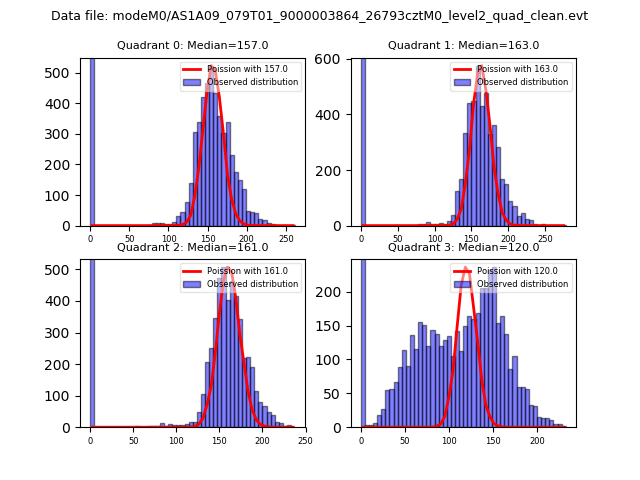 |
 |
| Quadrant-wise count rates Data is divided into 100 sec bins |
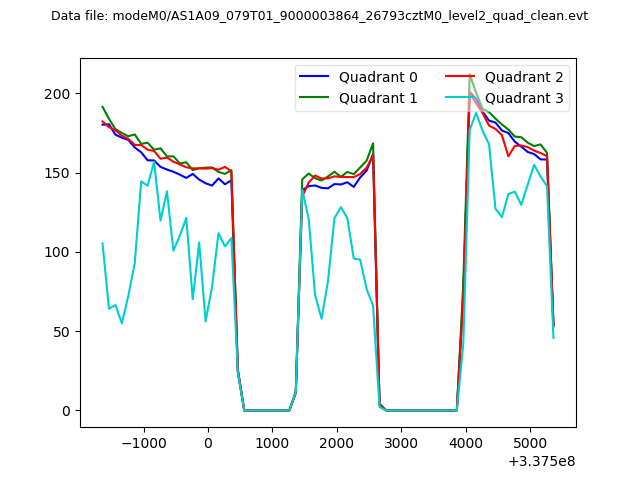 |
|
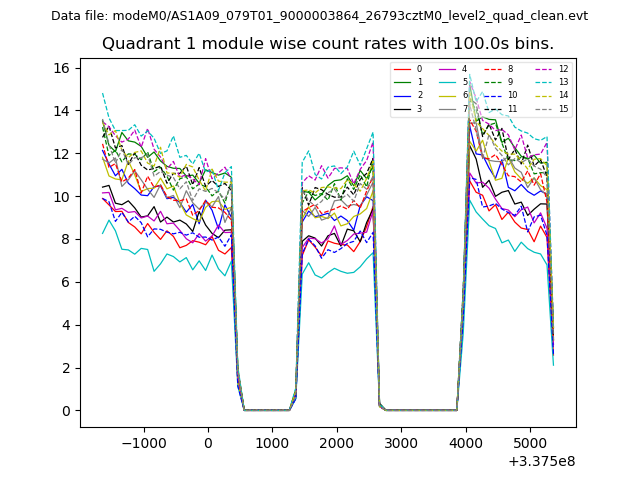
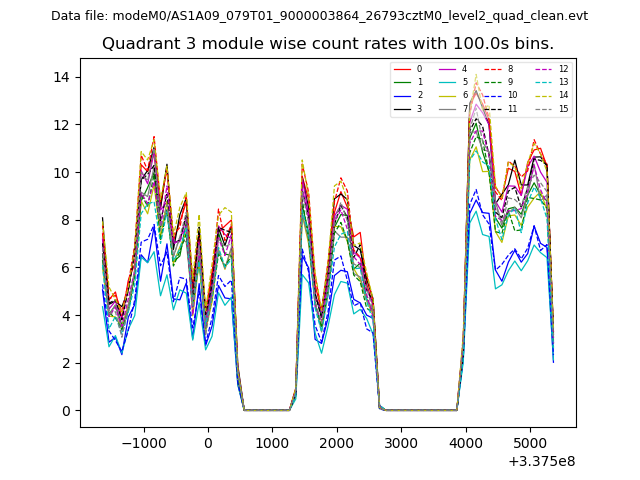
| Module-wise count rates for Quadrant A Data is divided into 100 sec bins |
 |
 |
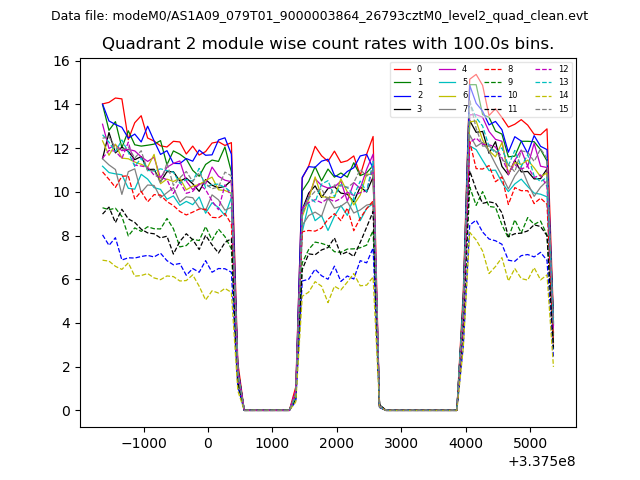
| Module-wise count rates for Quadrant B Data is divided into 100 sec bins |
 |
 |
| Module-wise count rates for Quadrant C Data is divided into 100 sec bins |
 |
 |
| Module-wise count rates for Quadrant D Data is divided into 100 sec bins |
 |
 |
| Parameter | Plot |
|---|---|
| CZT HV Monitor | 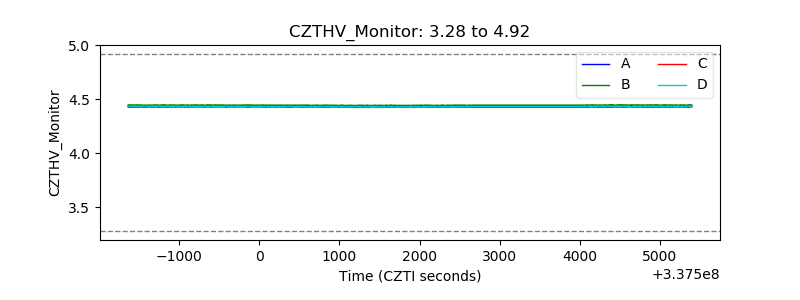 |
| D_VDD |  |
| Temperature 1 | 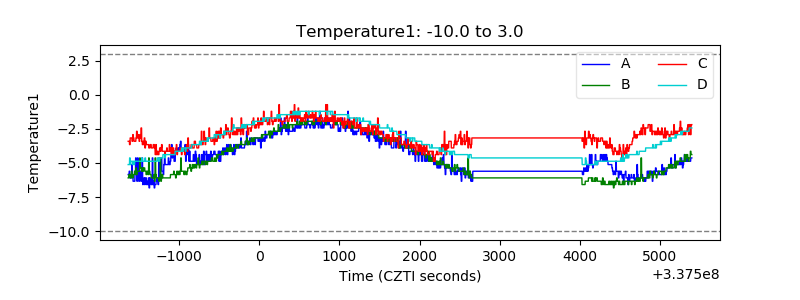 |
| Veto HV Monitor | 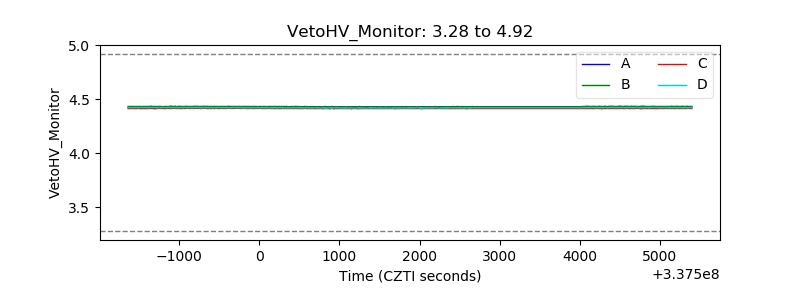 |
| Veto LLD | 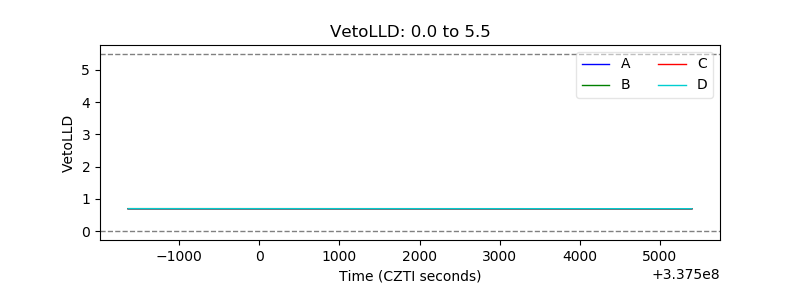 |
| Alpha Counter | 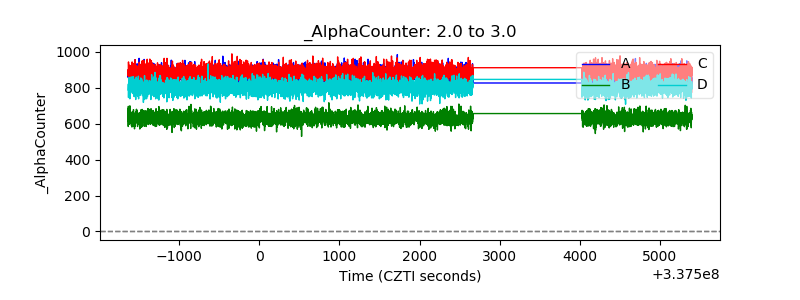 |
| _CPM_Rate | 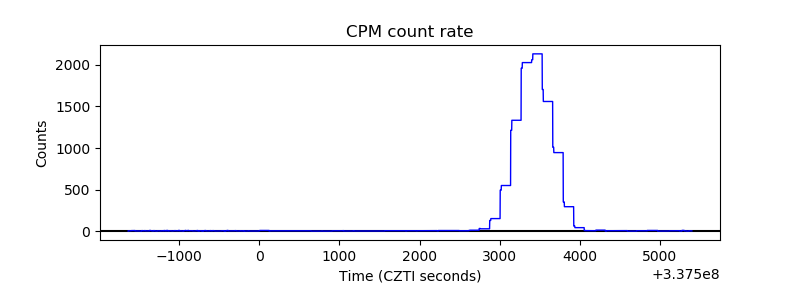 |
| CZT Counter | 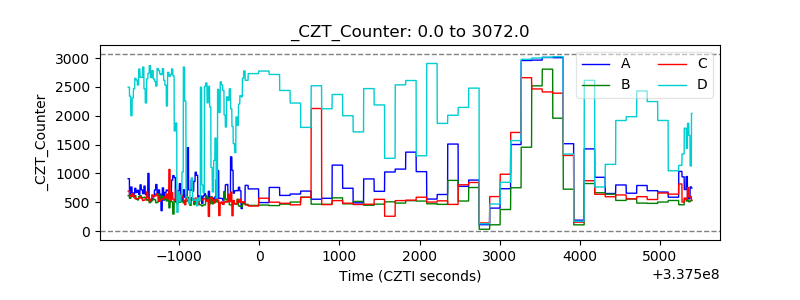 |
| +2.5 Volts monitor |  |
| +5 Volts monitor |  |
| _ROLL_ROT | 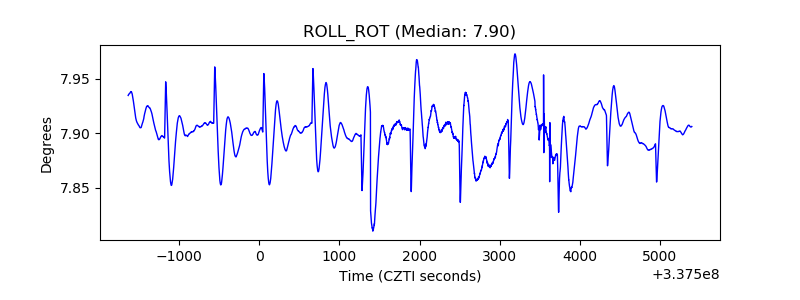 |
| _Roll_DEC | 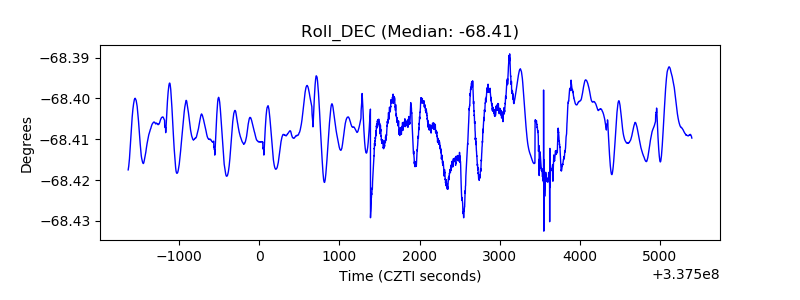 |
| _Roll_RA | 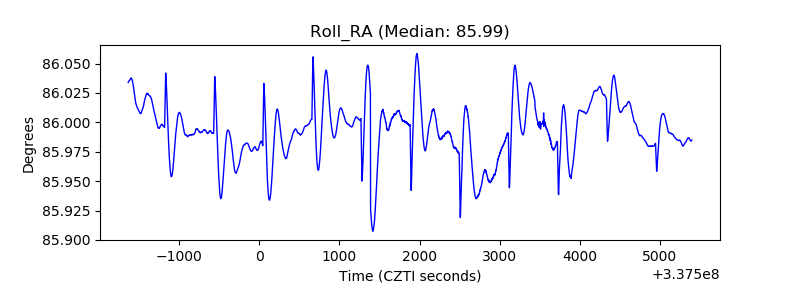 |
| Veto Counter | 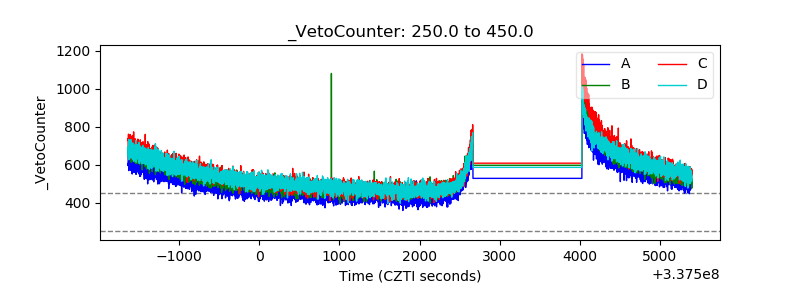 |