| Param | Original file | Final file |
|---|---|---|
| Filename | modeM0/AS1A09_079T01_9000003864_26794cztM0_level2.evt | modeM0/AS1A09_079T01_9000003864_26794cztM0_level2_quad_clean.evt |
| Size (bytes) | 485,112,960 | 91,339,200 |
| Size | 462.6 MB | 87.1 MB |
| Events in quadrant A | 2,903,380 | 616,447 |
| Events in quadrant B | 2,648,268 | 635,069 |
| Events in quadrant C | 2,797,241 | 615,709 |
| Events in quadrant D | 5,998,915 | 543,099 |
| Mode M9 | |||
|---|---|---|---|
| Quadrant | BADHDUFLAG | Total packets | Discarded packets |
| A | 0 | 12 | 0 |
| B | 0 | 12 | 0 |
| C | 0 | 13 | 1 |
| D | 0 | 12 | 0 |
| Mode M0 | |||
|---|---|---|---|
| Quadrant | BADHDUFLAG | Total packets | Discarded packets |
| A | 0 | 11697 | 0 |
| B | 0 | 10799 | 0 |
| C | 0 | 11244 | 0 |
| D | 0 | 21348 | 0 |
| Quadrant | Total seconds | Saturated seconds | Saturation percentage |
|---|---|---|---|
| A | 5006 | 79 | 1.578106% |
| B | 5033 | 85 | 1.688854% |
| C | 5004 | 177 | 3.537170% |
| D | 5015 | 1017 | 20.279163% |
Noise dominated data is calculated using 1-second bins in cleaned event files. If a bin has >2000 counts, and if more than 50% of those come from <1% of pixels, then it is considered to be noise-dominated and hence unusable.
| Quadrant | # 1 sec bins | Bins with >0 counts | Bins with >2000 counts | High rate bins dominated by noise | Noise dominated (total time) | Noise dominated (detector-on time) | Marked lightcurve |
|---|---|---|---|---|---|---|---|
| A | 6974 | 5103 | 2 | 2 | 0.03% | 0.04% | 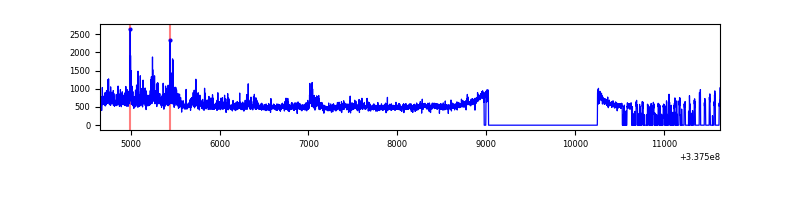 |
| B | 6975 | 5149 | 3 | 3 | 0.04% | 0.06% | 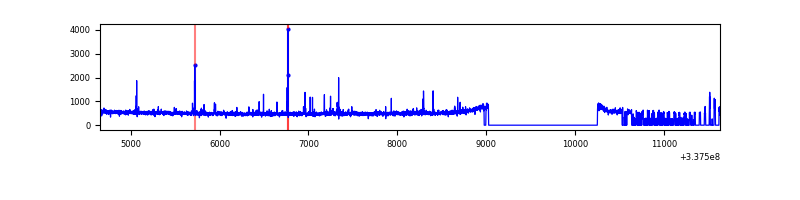 |
| C | 6975 | 5103 | 27 | 27 | 0.39% | 0.53% | 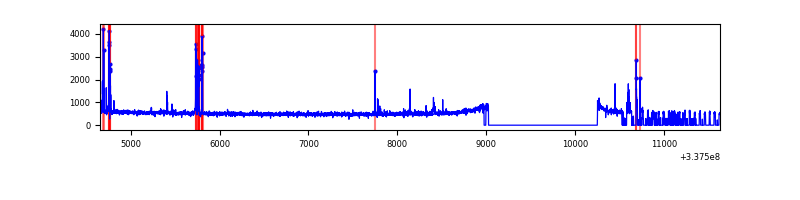 |
| D | 6975 | 5113 | 891 | 891 | 12.77% | 17.43% | 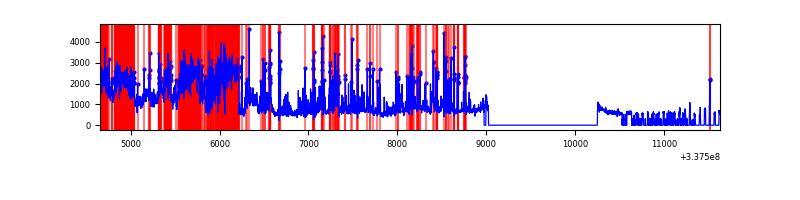 |
Top three noisy pixels from each quadrant. If the there are fewer than three noisy pixels in the level2.evt file, extra rows are filled as -1
| Pixel properties | Quadrant properties | ||||||
|---|---|---|---|---|---|---|---|
| Quadrant | DetID | PixID | Counts | Sigma | Mean | Median | Sigma |
| A | 0 | 13 | 335674 | 2555.32 | 660 | 647 | 131.1 |
| A | 6 | 16 | 20000 | 147.61 | 660 | 647 | 131.1 |
| A | 13 | 254 | 7360 | 51.2 | 660 | 647 | 131.1 |
| B | 10 | 246 | 43642 | 354.94 | 653 | 636 | 121.2 |
| B | 10 | 251 | 17605 | 140.05 | 653 | 636 | 121.2 |
| B | 0 | 229 | 15085 | 119.25 | 653 | 636 | 121.2 |
| C | 15 | 208 | 169288 | 1137.82 | 642 | 648 | 148.2 |
| C | 14 | 238 | 103986 | 697.22 | 642 | 648 | 148.2 |
| C | 2 | 16 | 11905 | 75.95 | 642 | 648 | 148.2 |
| D | 15 | 36 | 1584075 | 10985.95 | 612 | 597 | 144.1 |
| D | 7 | 80 | 1465263 | 10161.65 | 612 | 597 | 144.1 |
| D | 1 | 52 | 412307 | 2856.39 | 612 | 597 | 144.1 |
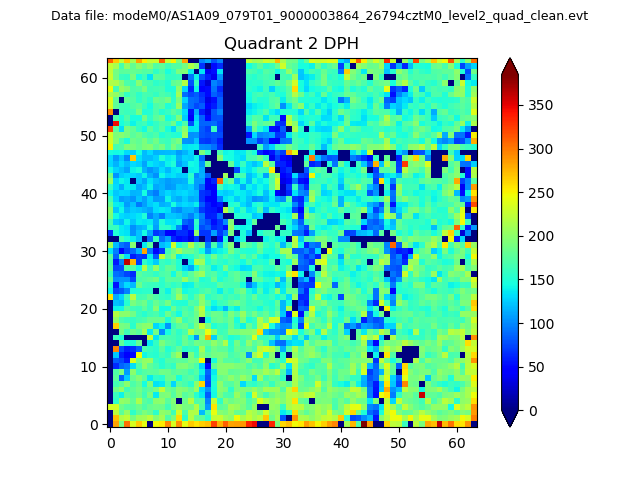
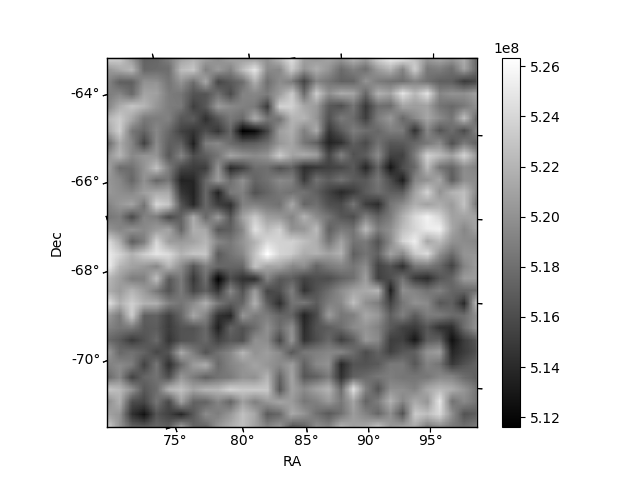
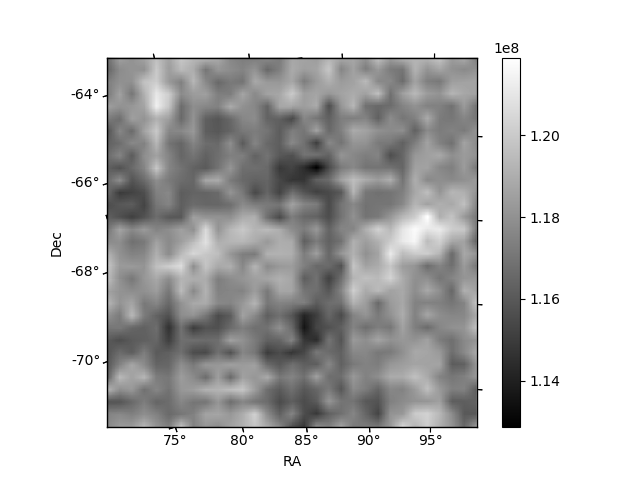
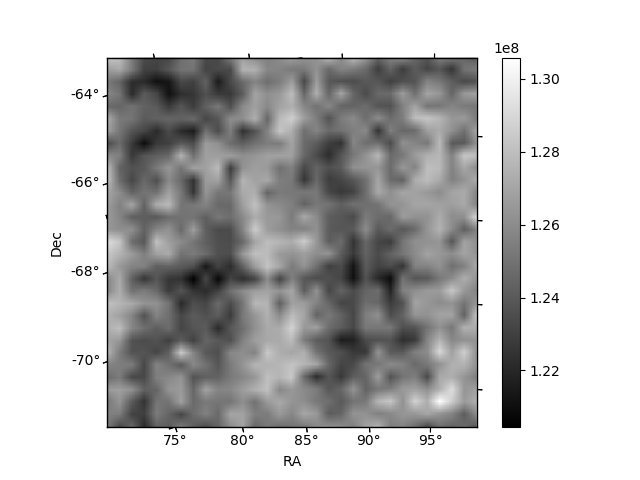
Histogram calculated using DETX and DETY for each event in the final _common_clean file
| Quadrant A | 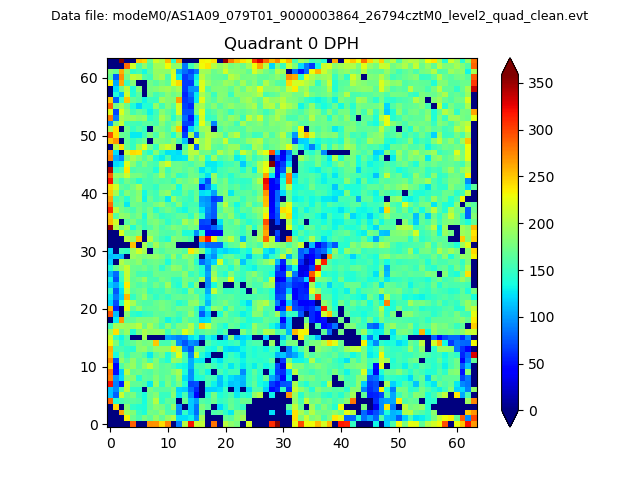 |
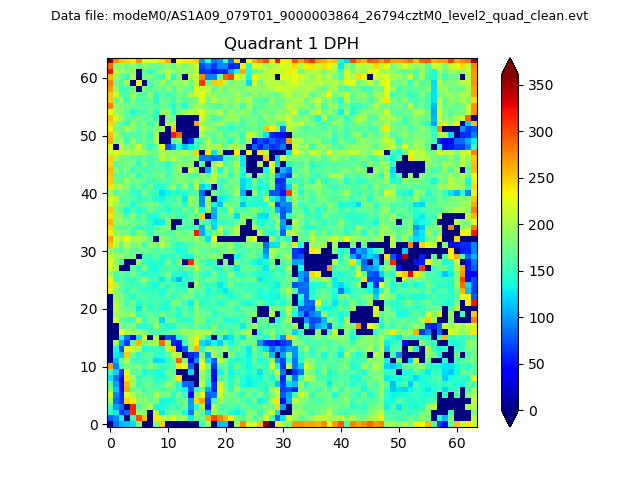 |
Quadrant B |
|---|---|---|---|
| Quadrant D | 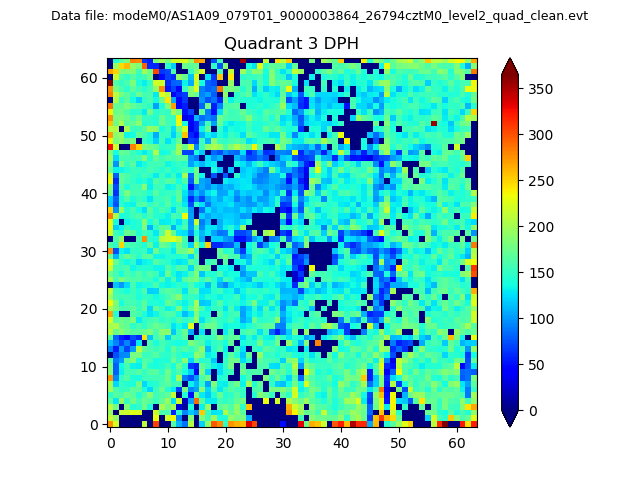 |
 |
Quadrant C |
| Plot type | Count rate plots | Images |
|---|---|---|
| Comparison with Poisson distribution Blue bars denote a histogram of data divided into 1 sec bins. Red curve is a Poisson curve with rate = median count rate of data. |
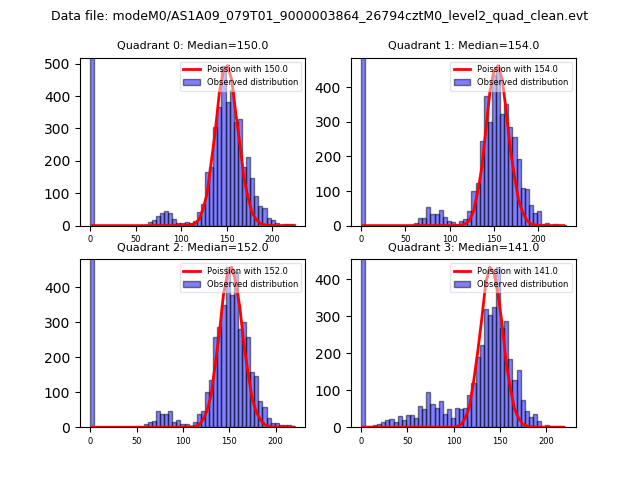 |
 |
| Quadrant-wise count rates Data is divided into 100 sec bins |
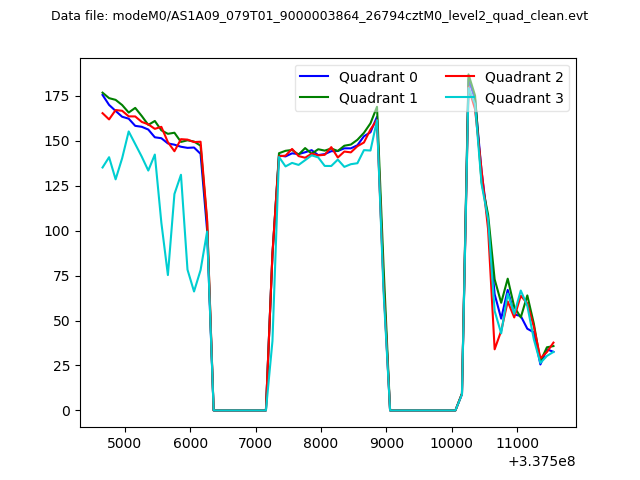 |
|
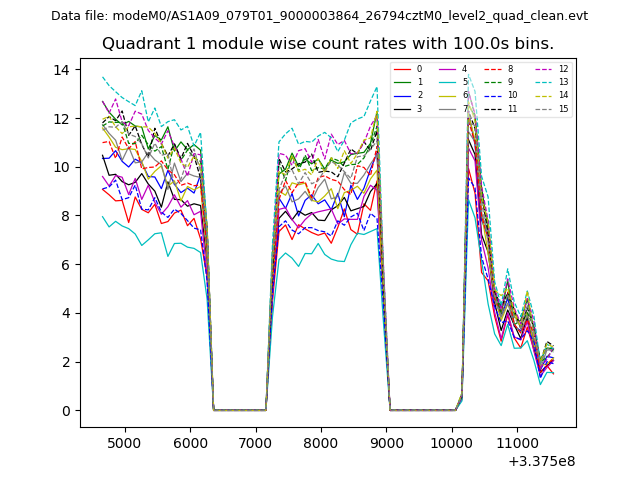
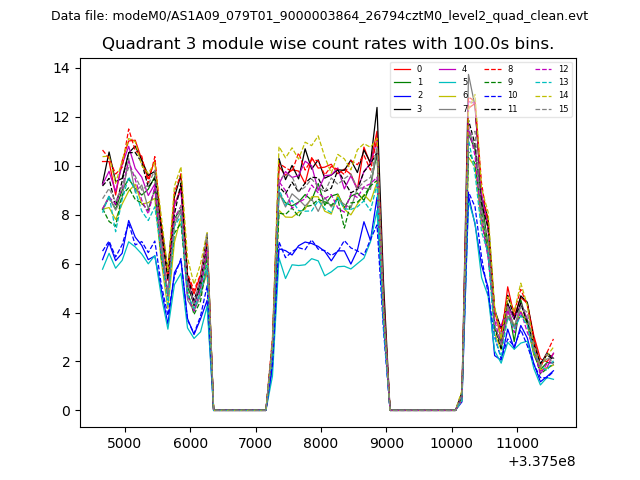
| Module-wise count rates for Quadrant A Data is divided into 100 sec bins |
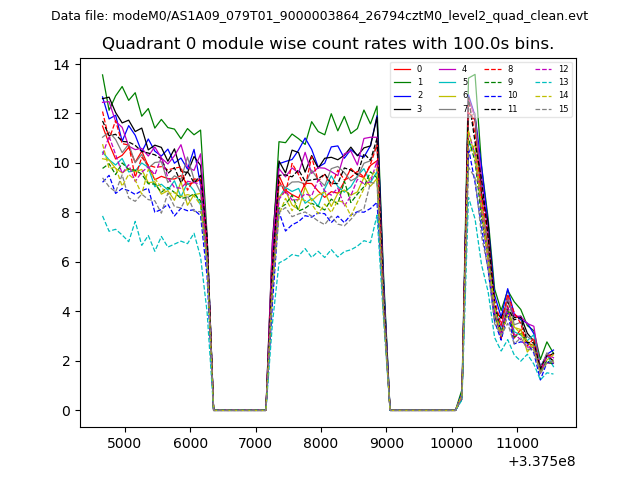 |
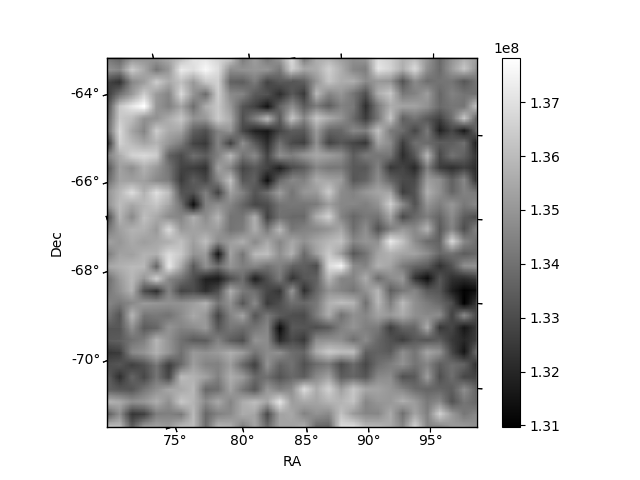 |
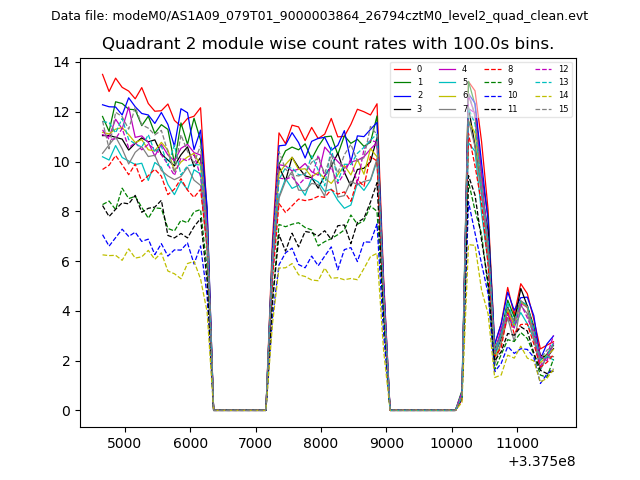
| Module-wise count rates for Quadrant B Data is divided into 100 sec bins |
 |
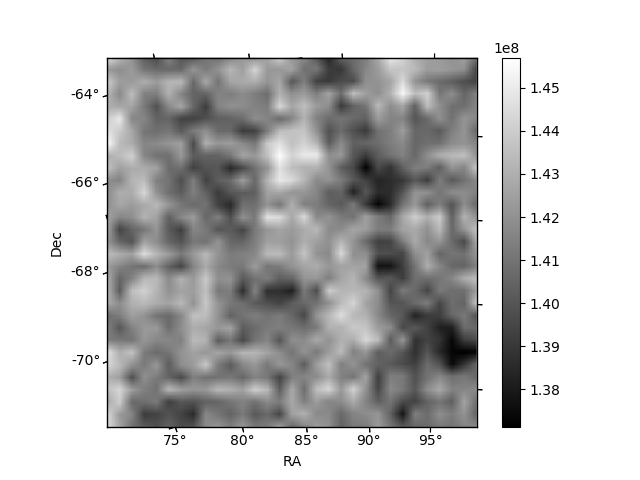 |
| Module-wise count rates for Quadrant C Data is divided into 100 sec bins |
 |
 |
| Module-wise count rates for Quadrant D Data is divided into 100 sec bins |
 |
 |
| Parameter | Plot |
|---|---|
| CZT HV Monitor | 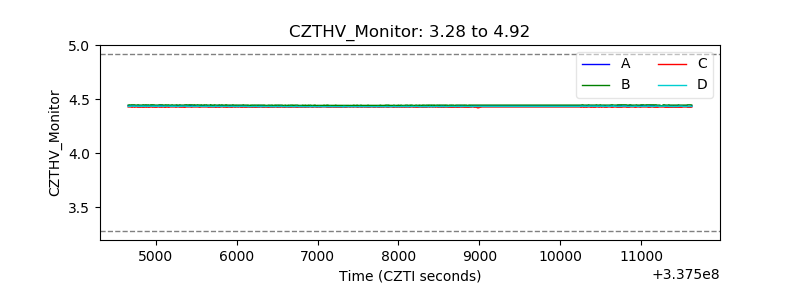 |
| D_VDD | 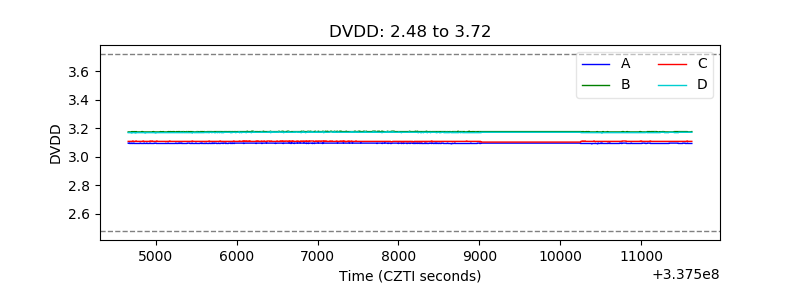 |
| Temperature 1 | 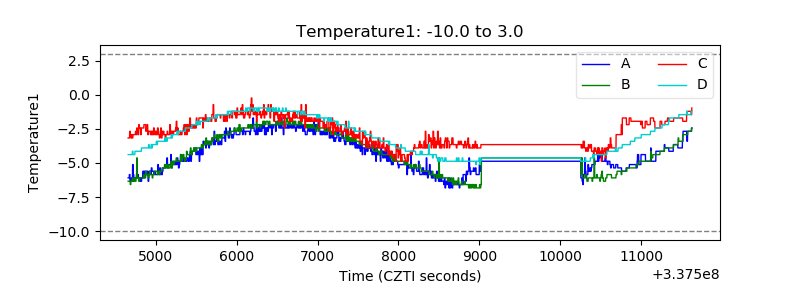 |
| Veto HV Monitor |  |
| Veto LLD | 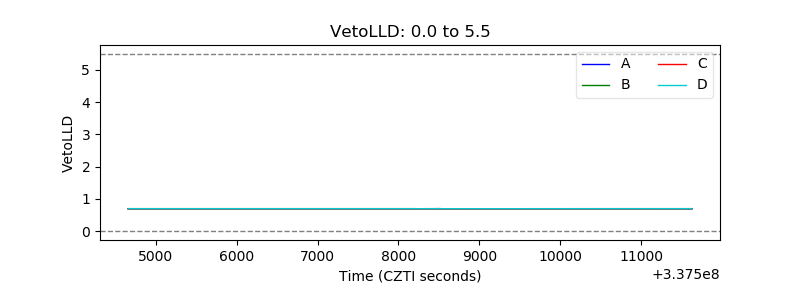 |
| Alpha Counter | 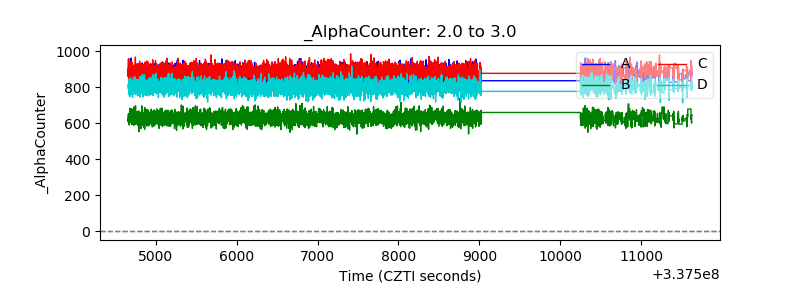 |
| _CPM_Rate | 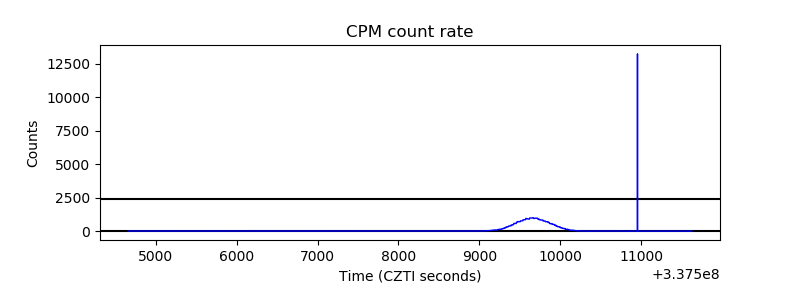 |
| CZT Counter | 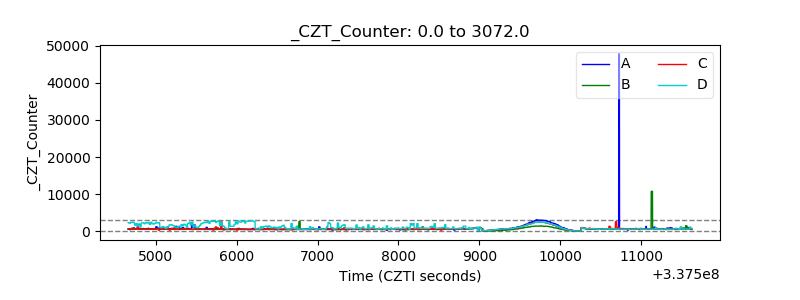 |
| +2.5 Volts monitor |  |
| +5 Volts monitor |  |
| _ROLL_ROT | 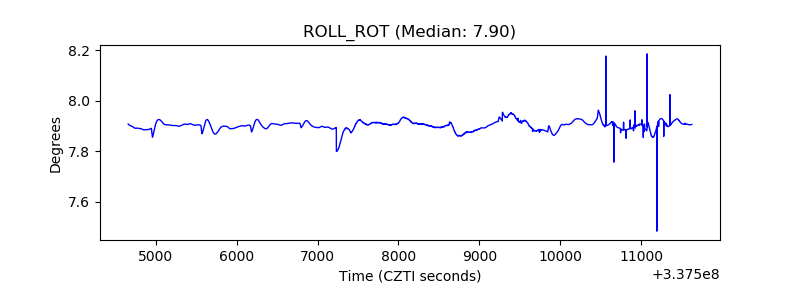 |
| _Roll_DEC | 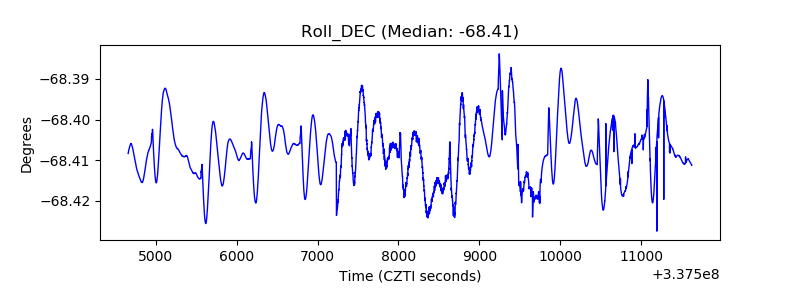 |
| _Roll_RA | 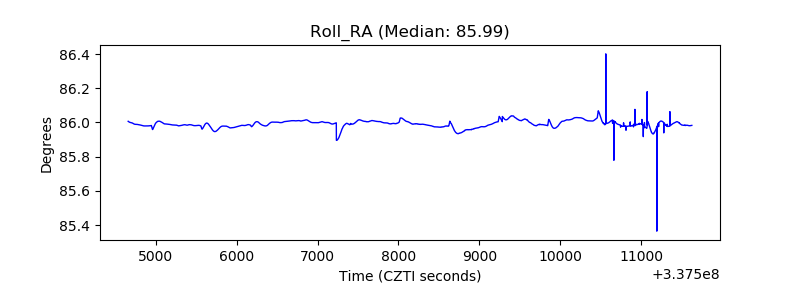 |
| Veto Counter | 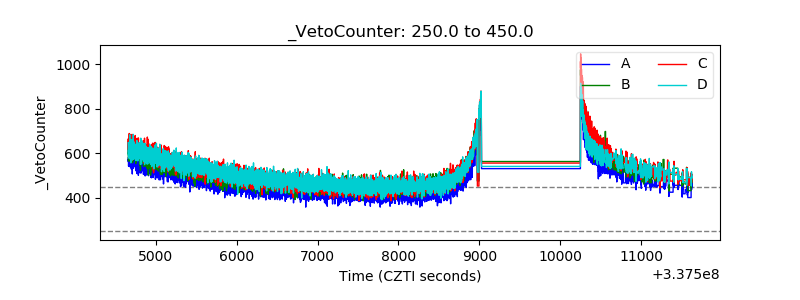 |