| Param | Original file | Final file |
|---|---|---|
| Filename | modeM0/AS1A09_079T01_9000003864_26795cztM0_level2.evt | modeM0/AS1A09_079T01_9000003864_26795cztM0_level2_quad_clean.evt |
| Size (bytes) | 550,771,200 | 109,831,680 |
| Size | 525.3 MB | 104.7 MB |
| Events in quadrant A | 3,565,741 | 727,786 |
| Events in quadrant B | 3,238,714 | 747,409 |
| Events in quadrant C | 3,286,930 | 732,999 |
| Events in quadrant D | 6,158,644 | 675,135 |
| Mode M9 | |||
|---|---|---|---|
| Quadrant | BADHDUFLAG | Total packets | Discarded packets |
| A | 0 | 10 | 0 |
| B | 0 | 10 | 0 |
| C | 0 | 10 | 0 |
| D | 0 | 10 | 0 |
| Mode M0 | |||
|---|---|---|---|
| Quadrant | BADHDUFLAG | Total packets | Discarded packets |
| A | 0 | 14520 | 0 |
| B | 0 | 13422 | 0 |
| C | 0 | 13372 | 0 |
| D | 0 | 22546 | 0 |
| Quadrant | Total seconds | Saturated seconds | Saturation percentage |
|---|---|---|---|
| A | 6350 | 83 | 1.307087% |
| B | 6349 | 79 | 1.244290% |
| C | 6349 | 95 | 1.496299% |
| D | 6349 | 902 | 14.206962% |
Noise dominated data is calculated using 1-second bins in cleaned event files. If a bin has >2000 counts, and if more than 50% of those come from <1% of pixels, then it is considered to be noise-dominated and hence unusable.
| Quadrant | # 1 sec bins | Bins with >0 counts | Bins with >2000 counts | High rate bins dominated by noise | Noise dominated (total time) | Noise dominated (detector-on time) | Marked lightcurve |
|---|---|---|---|---|---|---|---|
| A | 7350 | 6351 | 1 | 1 | 0.01% | 0.02% | 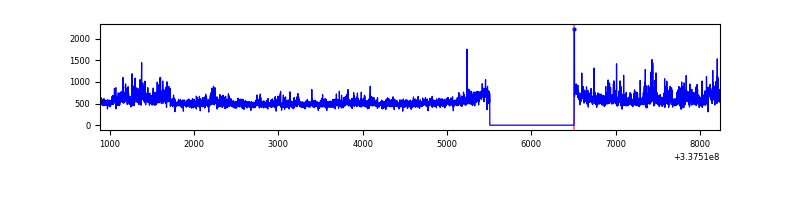 |
| B | 7349 | 6350 | 10 | 10 | 0.14% | 0.16% | 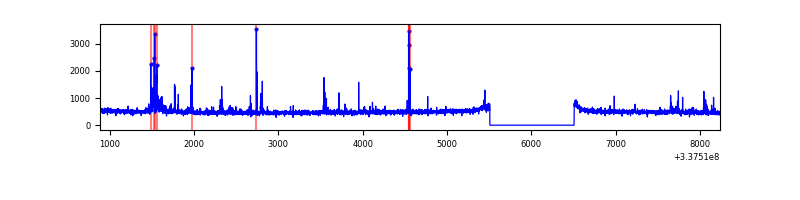 |
| C | 7349 | 6350 | 2 | 2 | 0.03% | 0.03% | 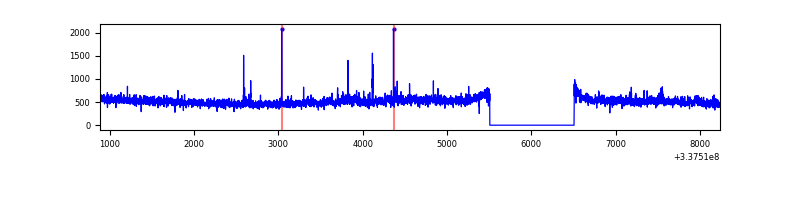 |
| D | 7349 | 6350 | 670 | 670 | 9.12% | 10.55% | 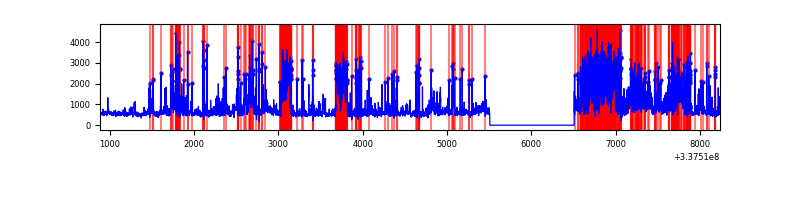 |
Top three noisy pixels from each quadrant. If the there are fewer than three noisy pixels in the level2.evt file, extra rows are filled as -1
| Pixel properties | Quadrant properties | ||||||
|---|---|---|---|---|---|---|---|
| Quadrant | DetID | PixID | Counts | Sigma | Mean | Median | Sigma |
| A | 0 | 13 | 450557 | 2832.7 | 795 | 777 | 158.8 |
| A | 5 | 203 | 40859 | 252.44 | 795 | 777 | 158.8 |
| A | 13 | 254 | 10397 | 60.59 | 795 | 777 | 158.8 |
| B | 10 | 246 | 88235 | 591.69 | 785 | 765 | 147.8 |
| B | 0 | 229 | 54029 | 360.3 | 785 | 765 | 147.8 |
| B | 0 | 190 | 21264 | 138.67 | 785 | 765 | 147.8 |
| C | 14 | 238 | 125372 | 694.47 | 773 | 778 | 179.4 |
| C | 3 | 233 | 100550 | 556.12 | 773 | 778 | 179.4 |
| C | 2 | 16 | 26934 | 145.79 | 773 | 778 | 179.4 |
| D | 7 | 80 | 2265023 | 12801.35 | 744 | 726 | 176.9 |
| D | 1 | 52 | 874466 | 4939.75 | 744 | 726 | 176.9 |
| D | 2 | 250 | 147940 | 832.28 | 744 | 726 | 176.9 |
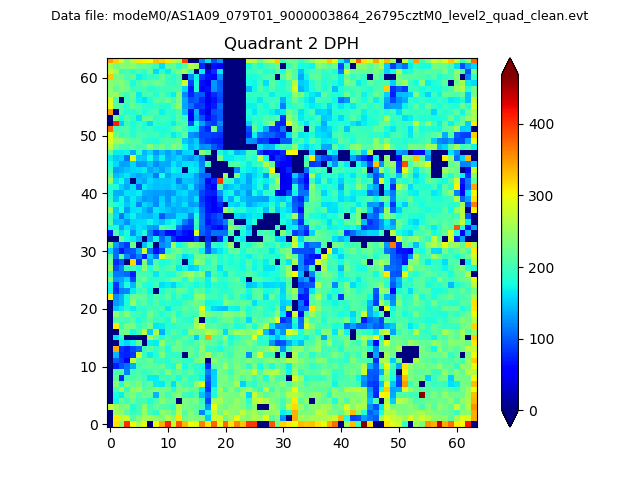
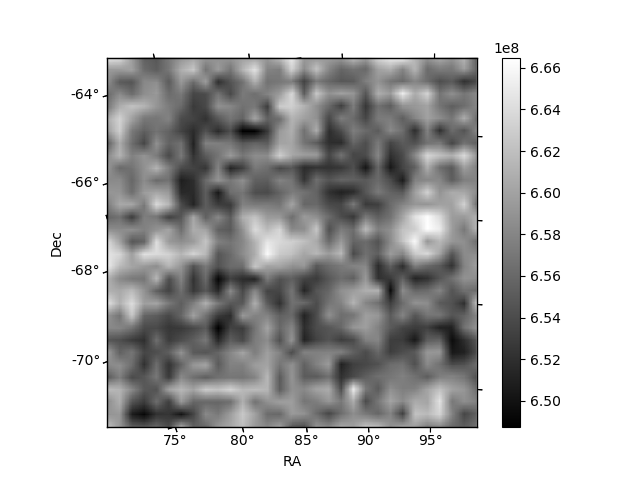
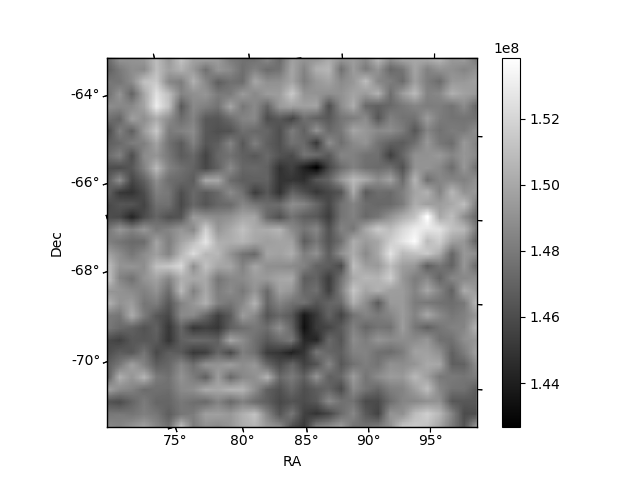
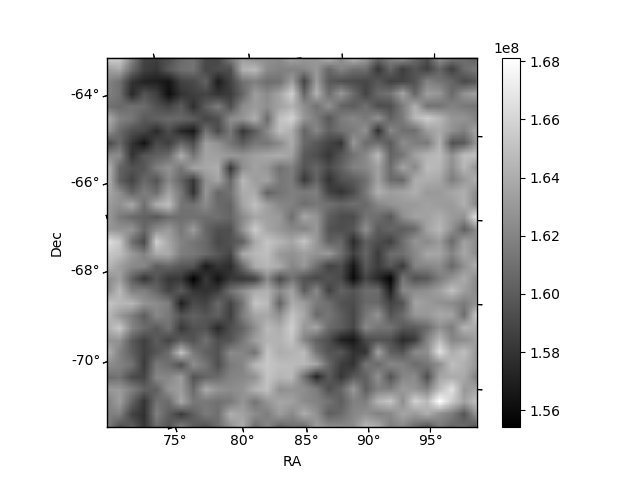
Histogram calculated using DETX and DETY for each event in the final _common_clean file
| Quadrant A | 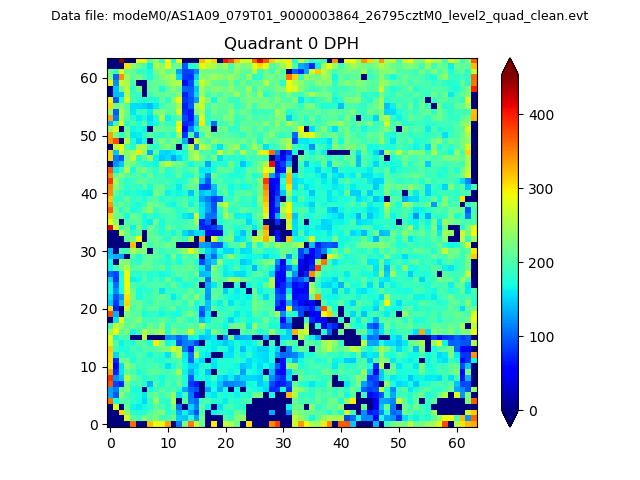 |
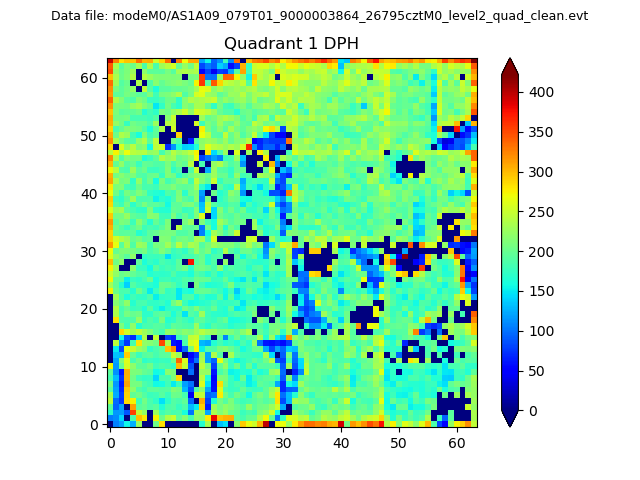 |
Quadrant B |
|---|---|---|---|
| Quadrant D | 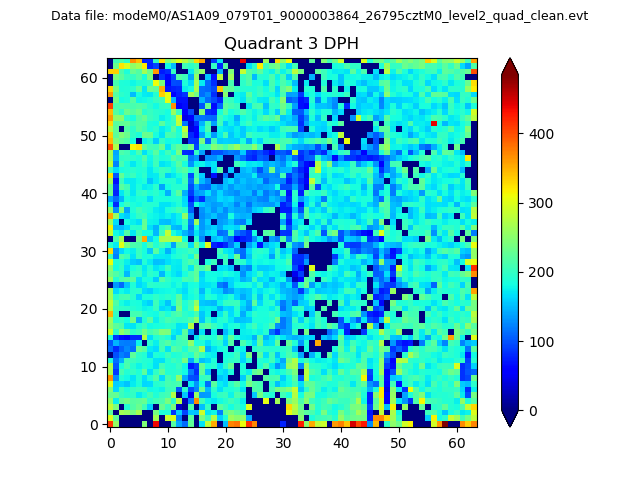 |
 |
Quadrant C |
| Plot type | Count rate plots | Images |
|---|---|---|
| Comparison with Poisson distribution Blue bars denote a histogram of data divided into 1 sec bins. Red curve is a Poisson curve with rate = median count rate of data. |
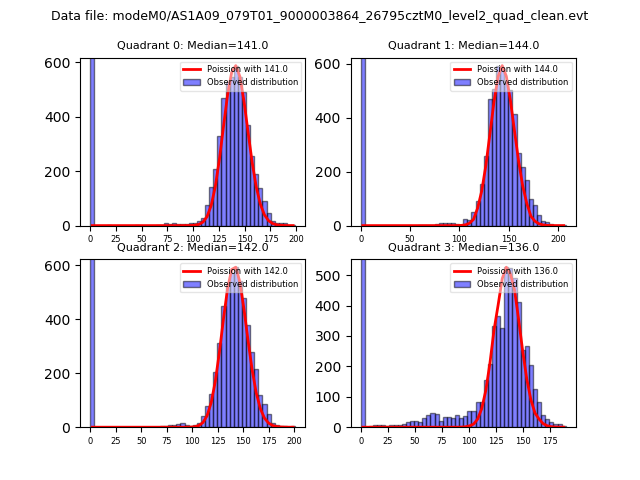 |
 |
| Quadrant-wise count rates Data is divided into 100 sec bins |
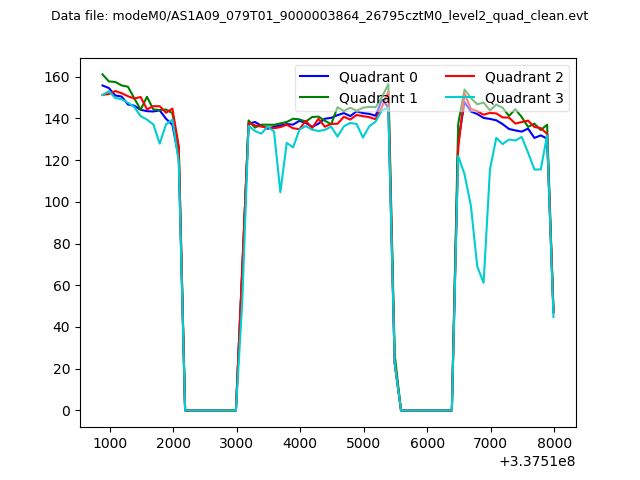 |
|
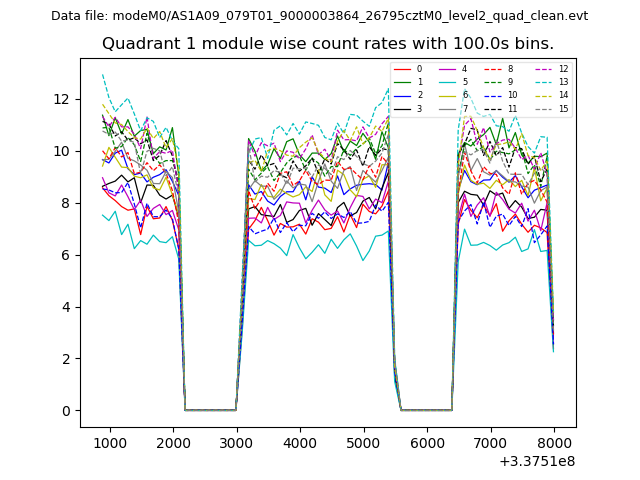
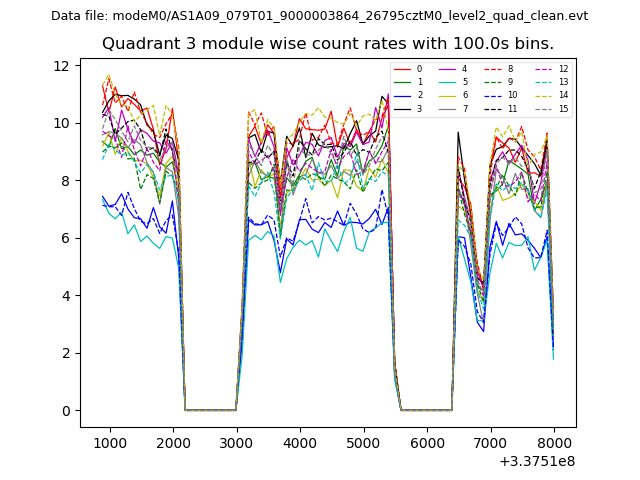
| Module-wise count rates for Quadrant A Data is divided into 100 sec bins |
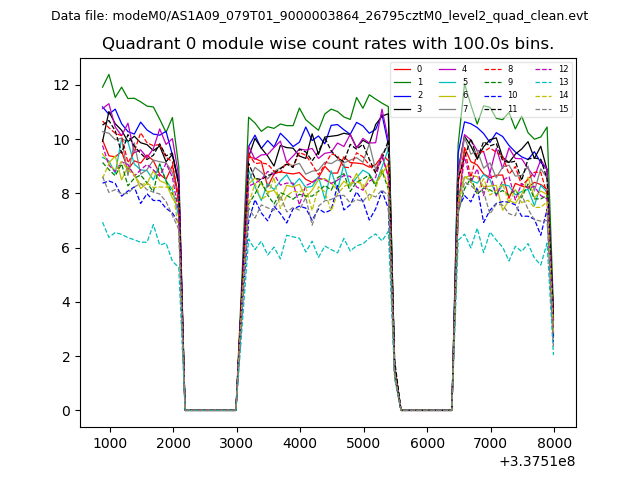 |
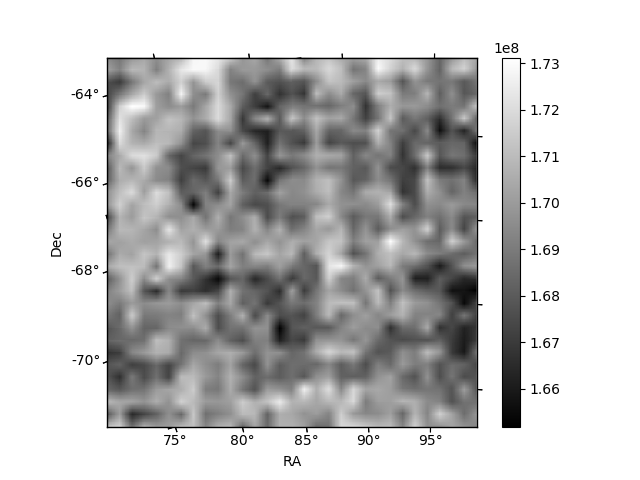 |
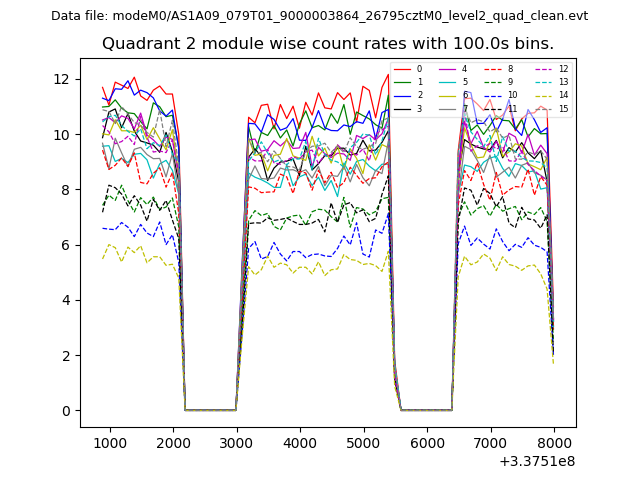
| Module-wise count rates for Quadrant B Data is divided into 100 sec bins |
 |
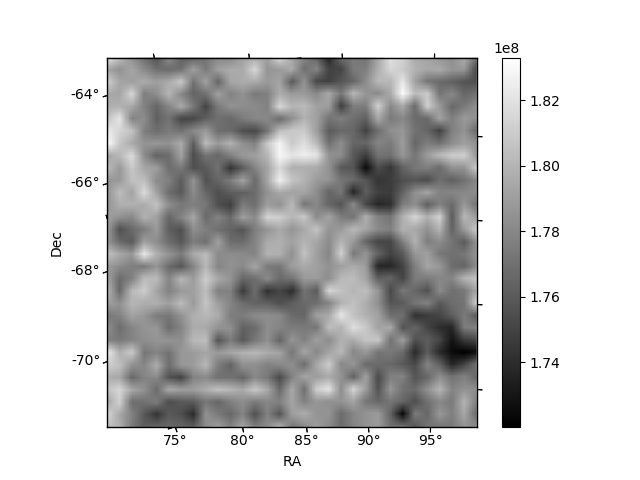 |
| Module-wise count rates for Quadrant C Data is divided into 100 sec bins |
 |
 |
| Module-wise count rates for Quadrant D Data is divided into 100 sec bins |
 |
 |
| Parameter | Plot |
|---|---|
| CZT HV Monitor | 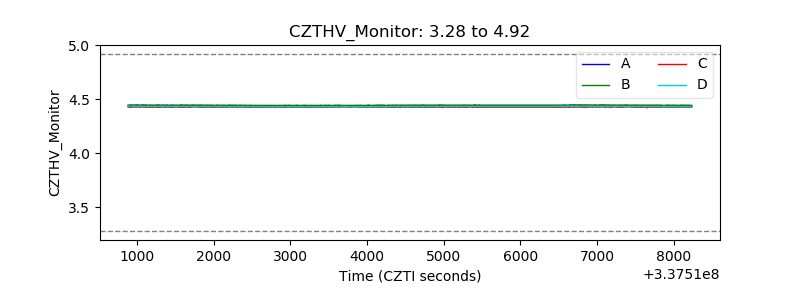 |
| D_VDD | 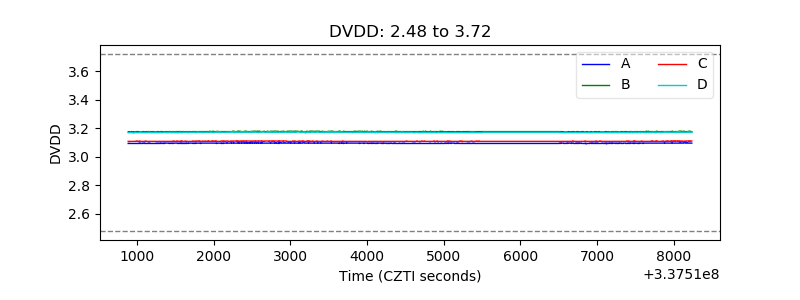 |
| Temperature 1 | 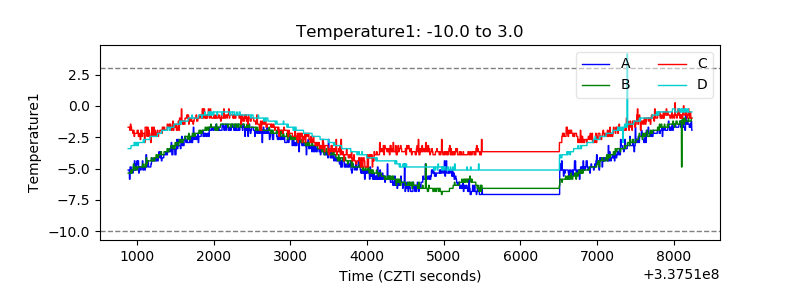 |
| Veto HV Monitor | 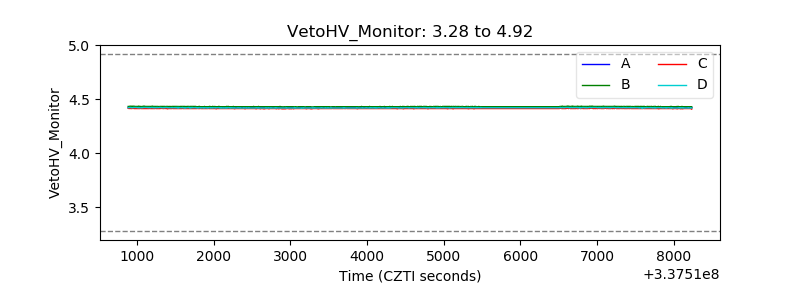 |
| Veto LLD | 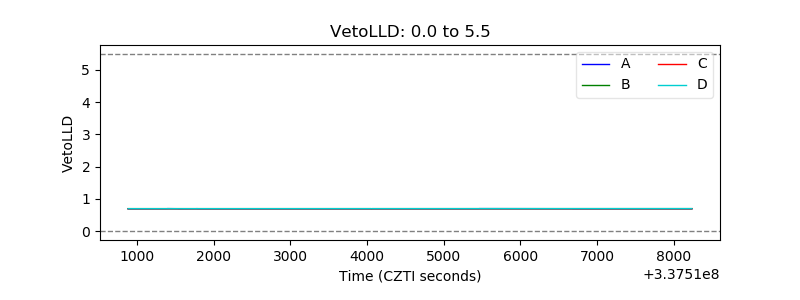 |
| Alpha Counter | 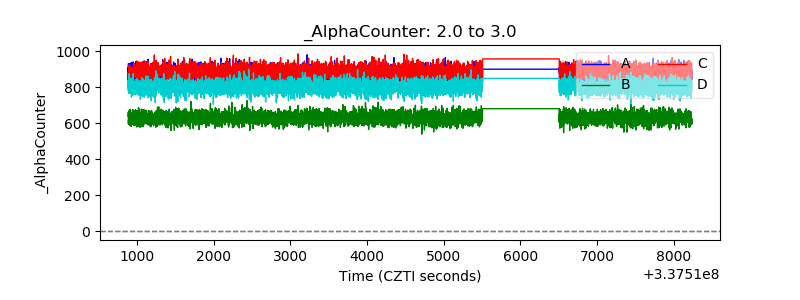 |
| _CPM_Rate | 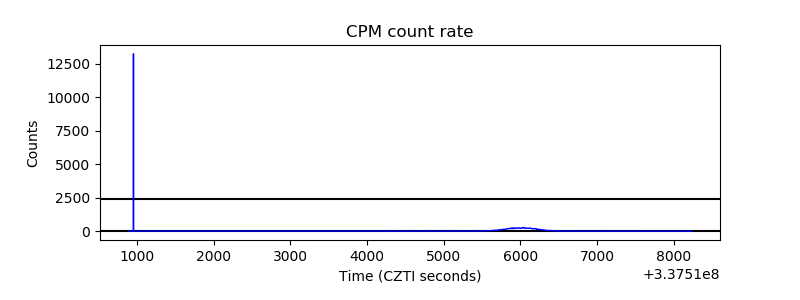 |
| CZT Counter | 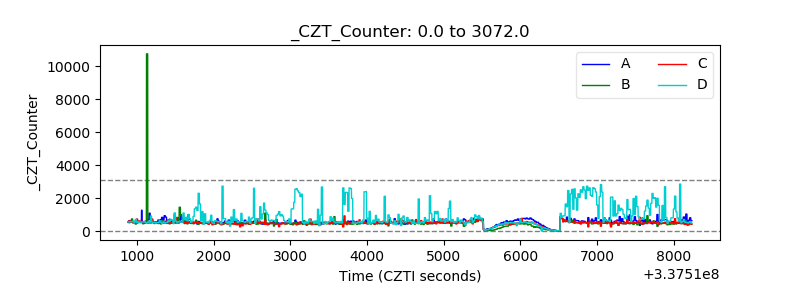 |
| +2.5 Volts monitor |  |
| +5 Volts monitor | 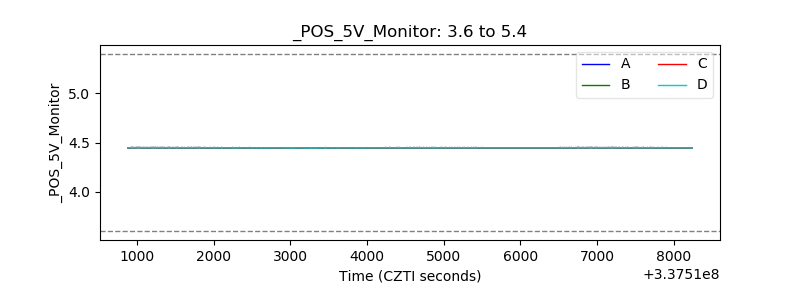 |
| _ROLL_ROT | 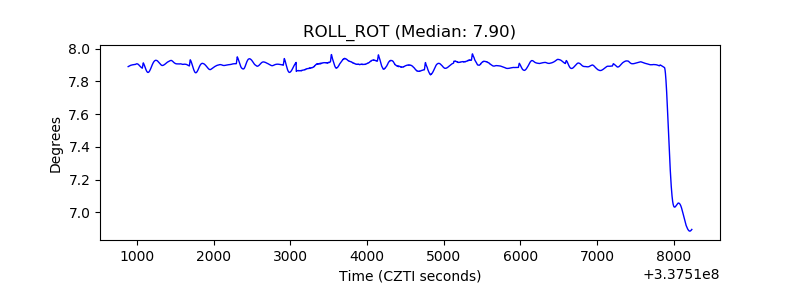 |
| _Roll_DEC | 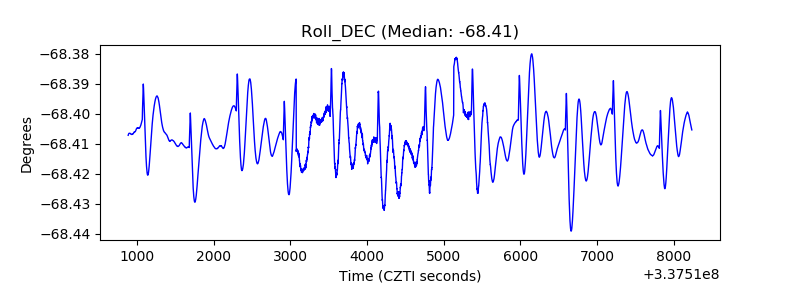 |
| _Roll_RA | 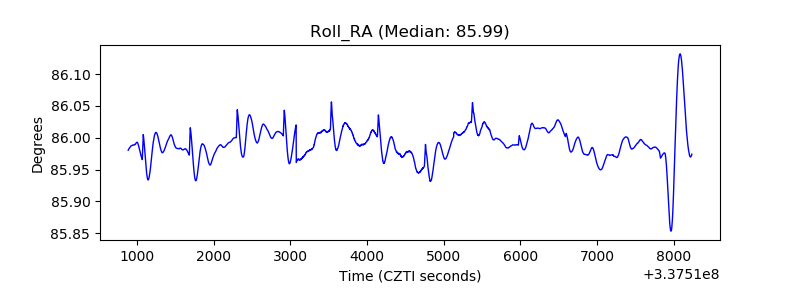 |
| Veto Counter | 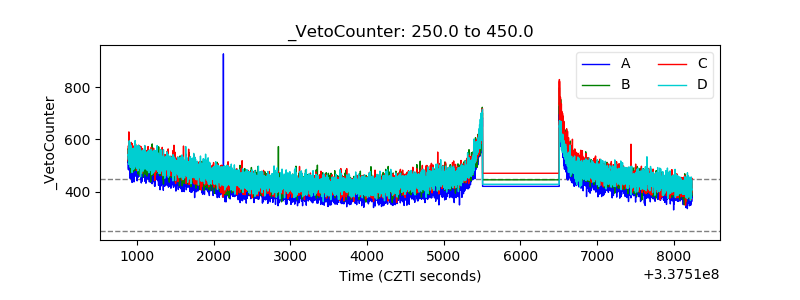 |