| Param | Original file | Final file |
|---|---|---|
| Filename | modeM0/AS1A09_079T01_9000003864_26796cztM0_level2.evt | modeM0/AS1A09_079T01_9000003864_26796cztM0_level2_quad_clean.evt |
| Size (bytes) | 627,929,280 | 100,163,520 |
| Size | 598.8 MB | 95.5 MB |
| Events in quadrant A | 3,945,262 | 668,408 |
| Events in quadrant B | 3,493,683 | 667,099 |
| Events in quadrant C | 3,375,969 | 666,282 |
| Events in quadrant D | 7,756,670 | 572,406 |
| Mode M9 | |||
|---|---|---|---|
| Quadrant | BADHDUFLAG | Total packets | Discarded packets |
| A | 0 | 6 | 0 |
| B | 0 | 6 | 0 |
| C | 0 | 6 | 0 |
| D | 0 | 6 | 0 |
| Mode M0 | |||
|---|---|---|---|
| Quadrant | BADHDUFLAG | Total packets | Discarded packets |
| A | 0 | 15981 | 0 |
| B | 0 | 14558 | 0 |
| C | 0 | 14087 | 0 |
| D | 0 | 27655 | 0 |
| Quadrant | Total seconds | Saturated seconds | Saturation percentage |
|---|---|---|---|
| A | 6579 | 154 | 2.340781% |
| B | 6580 | 289 | 4.392097% |
| C | 6580 | 212 | 3.221884% |
| D | 6580 | 1405 | 21.352584% |
Noise dominated data is calculated using 1-second bins in cleaned event files. If a bin has >2000 counts, and if more than 50% of those come from <1% of pixels, then it is considered to be noise-dominated and hence unusable.
| Quadrant | # 1 sec bins | Bins with >0 counts | Bins with >2000 counts | High rate bins dominated by noise | Noise dominated (total time) | Noise dominated (detector-on time) | Marked lightcurve |
|---|---|---|---|---|---|---|---|
| A | 7154 | 6579 | 3 | 3 | 0.04% | 0.05% | 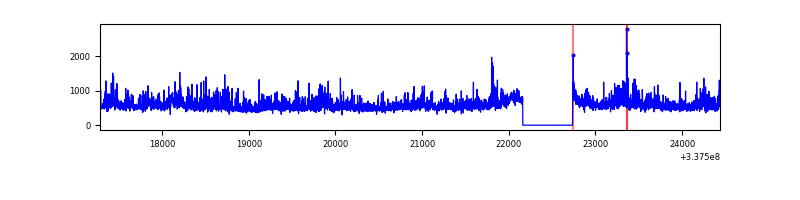 |
| B | 7155 | 6580 | 132 | 132 | 1.84% | 2.01% | 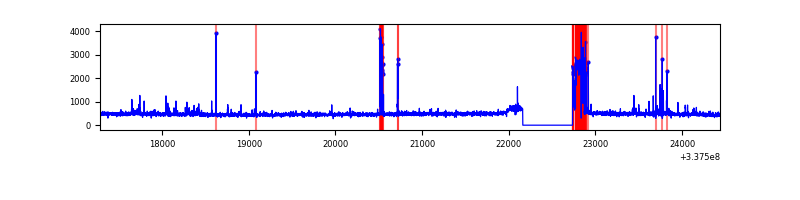 |
| C | 7155 | 6580 | 21 | 21 | 0.29% | 0.32% | 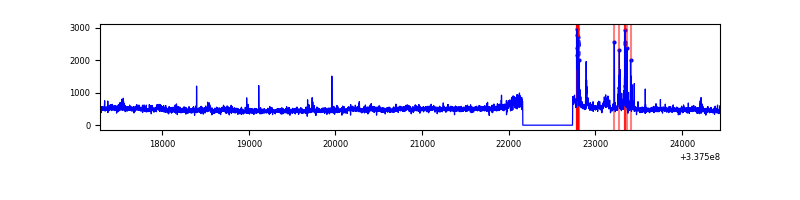 |
| D | 7155 | 6581 | 1227 | 1227 | 17.15% | 18.64% | 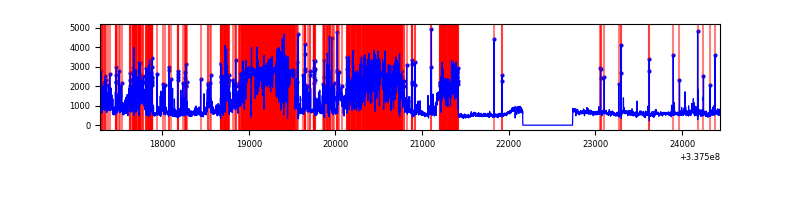 |
Top three noisy pixels from each quadrant. If the there are fewer than three noisy pixels in the level2.evt file, extra rows are filled as -1
| Pixel properties | Quadrant properties | ||||||
|---|---|---|---|---|---|---|---|
| Quadrant | DetID | PixID | Counts | Sigma | Mean | Median | Sigma |
| A | 0 | 13 | 830949 | 5188.32 | 797 | 778 | 160.0 |
| A | 5 | 203 | 40499 | 248.24 | 797 | 778 | 160.0 |
| A | 13 | 254 | 10350 | 59.82 | 797 | 778 | 160.0 |
| B | 10 | 246 | 339475 | 2309.22 | 774 | 752 | 146.7 |
| B | 15 | 33 | 62882 | 423.57 | 774 | 752 | 146.7 |
| B | 0 | 229 | 40743 | 272.64 | 774 | 752 | 146.7 |
| C | 15 | 208 | 133087 | 739.27 | 771 | 777 | 179.0 |
| C | 14 | 238 | 124166 | 689.43 | 771 | 777 | 179.0 |
| C | 3 | 233 | 65483 | 361.54 | 771 | 777 | 179.0 |
| D | 7 | 80 | 3687639 | 21588.99 | 719 | 698 | 170.8 |
| D | 1 | 52 | 1086115 | 6355.69 | 719 | 698 | 170.8 |
| D | 2 | 250 | 220711 | 1288.29 | 719 | 698 | 170.8 |
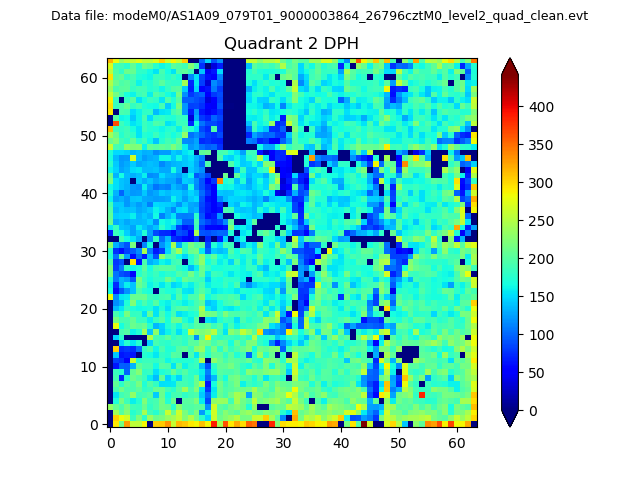
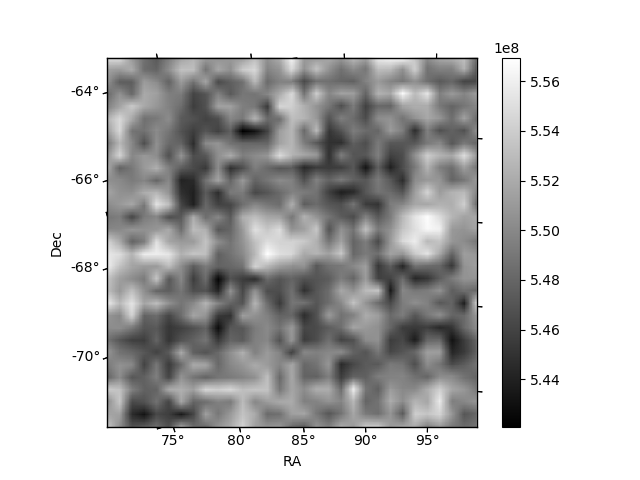
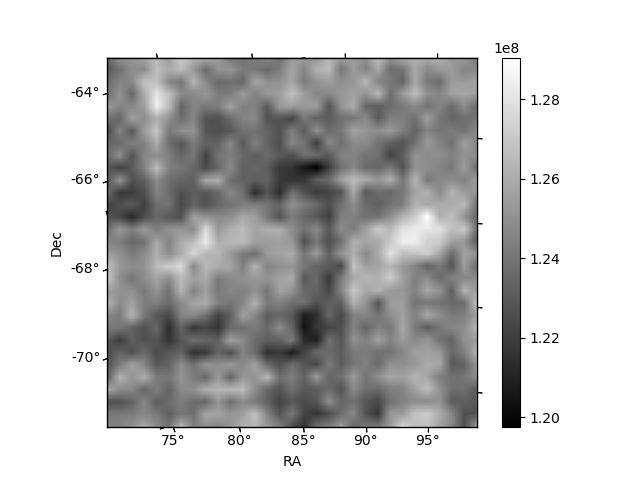
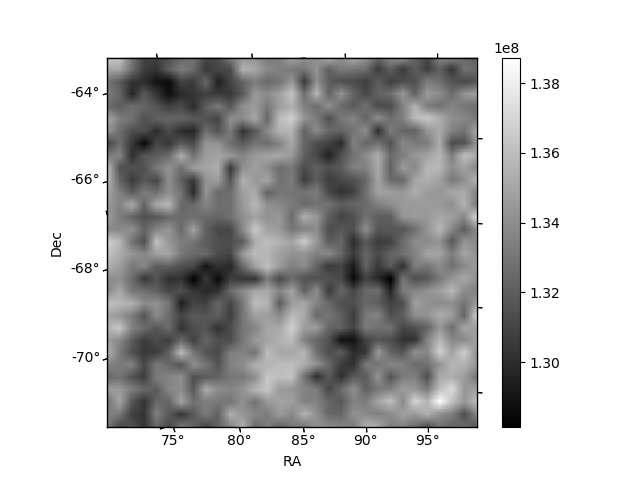
Histogram calculated using DETX and DETY for each event in the final _common_clean file
| Quadrant A | 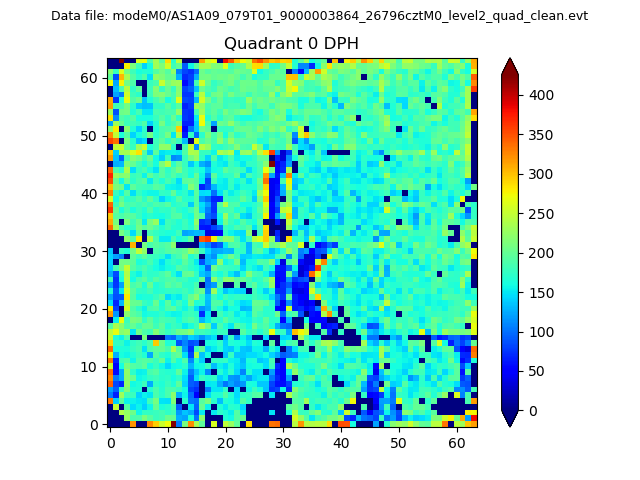 |
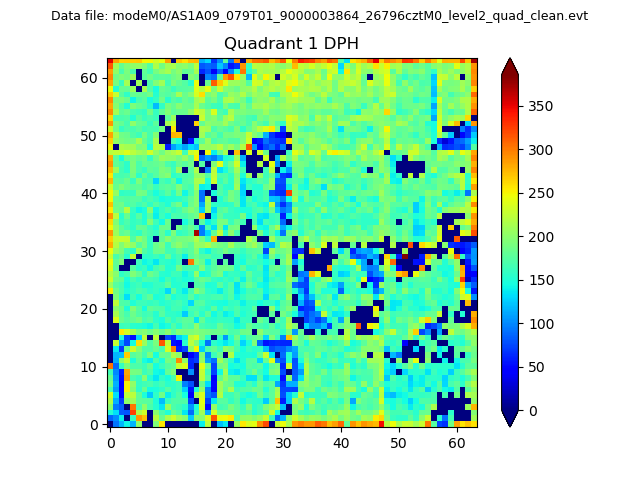 |
Quadrant B |
|---|---|---|---|
| Quadrant D | 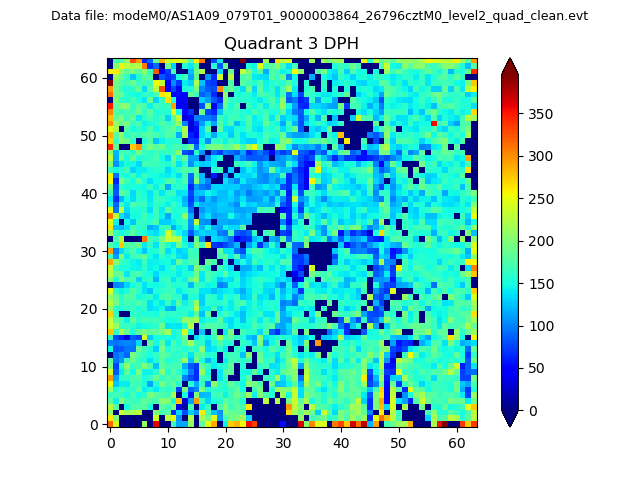 |
 |
Quadrant C |
| Plot type | Count rate plots | Images |
|---|---|---|
| Comparison with Poisson distribution Blue bars denote a histogram of data divided into 1 sec bins. Red curve is a Poisson curve with rate = median count rate of data. |
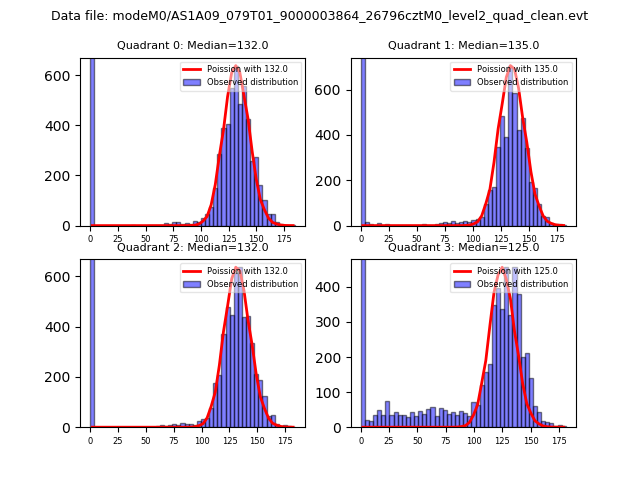 |
 |
| Quadrant-wise count rates Data is divided into 100 sec bins |
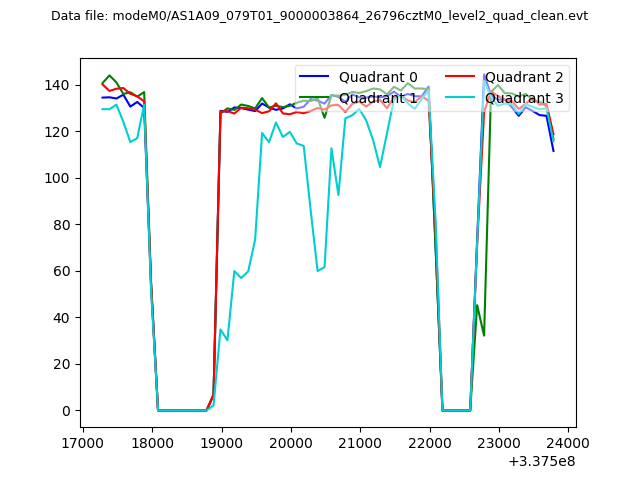 |
|
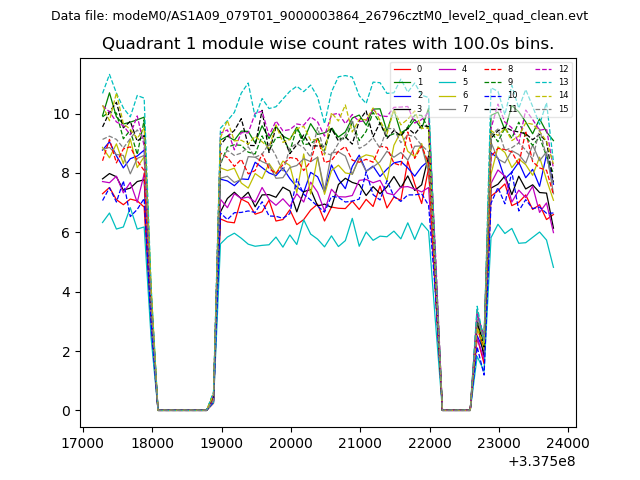
| Module-wise count rates for Quadrant A Data is divided into 100 sec bins |
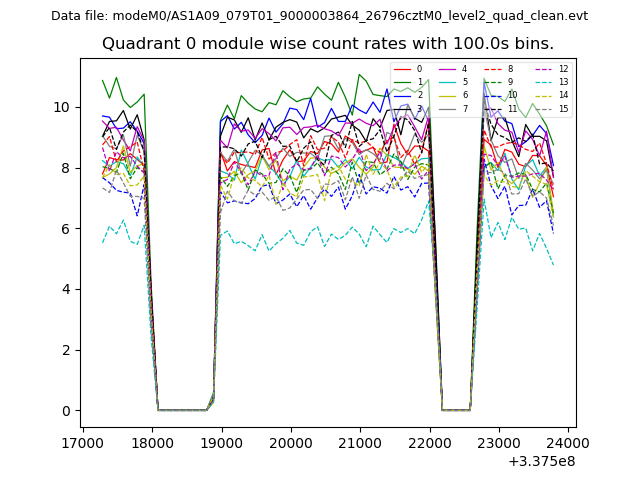 |
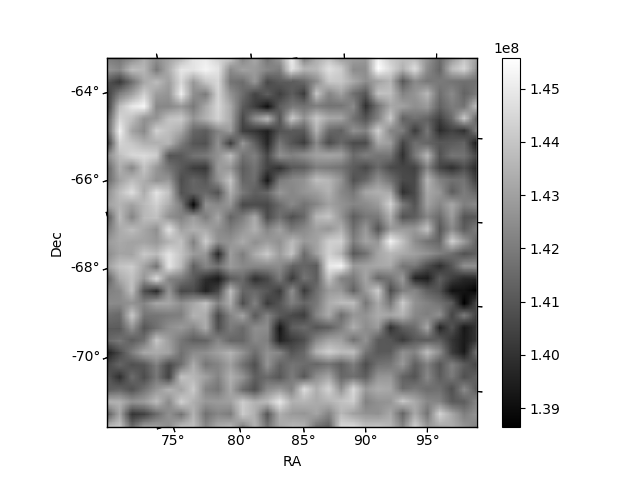 |
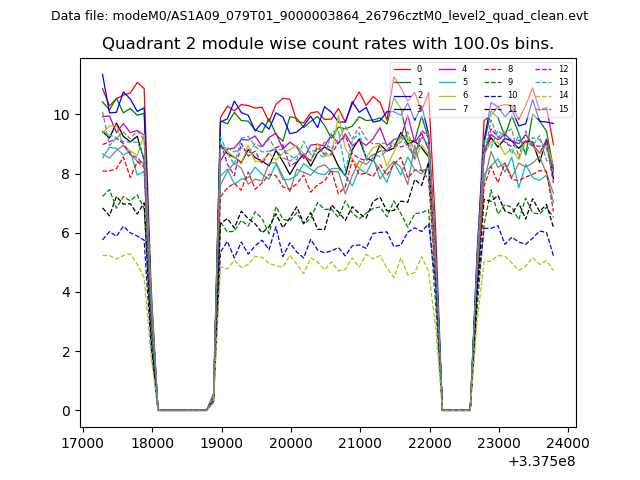
| Module-wise count rates for Quadrant B Data is divided into 100 sec bins |
 |
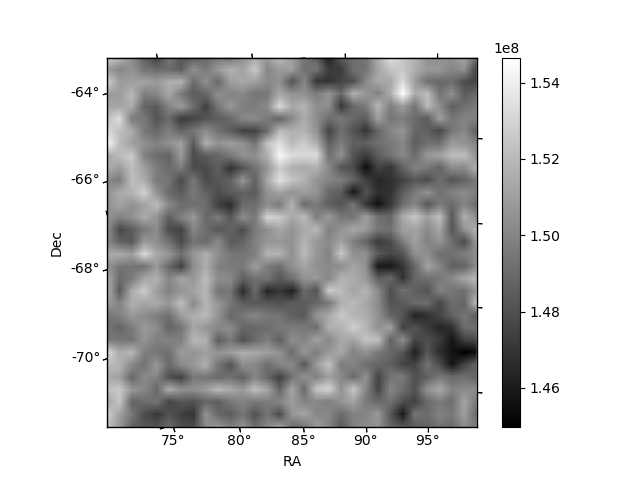 |
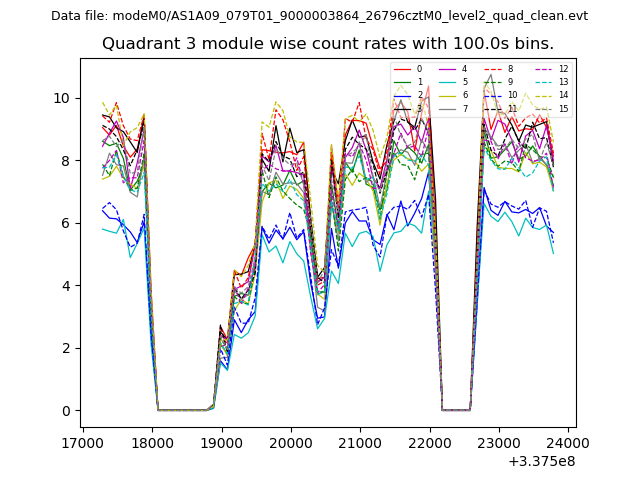
| Module-wise count rates for Quadrant C Data is divided into 100 sec bins |
 |
 |
| Module-wise count rates for Quadrant D Data is divided into 100 sec bins |
 |
 |
| Parameter | Plot |
|---|---|
| CZT HV Monitor | 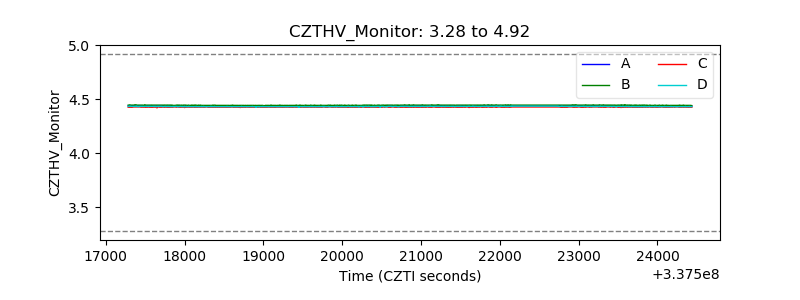 |
| D_VDD | 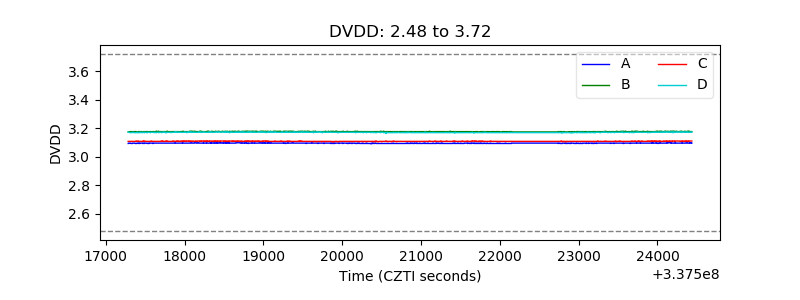 |
| Temperature 1 |  |
| Veto HV Monitor | 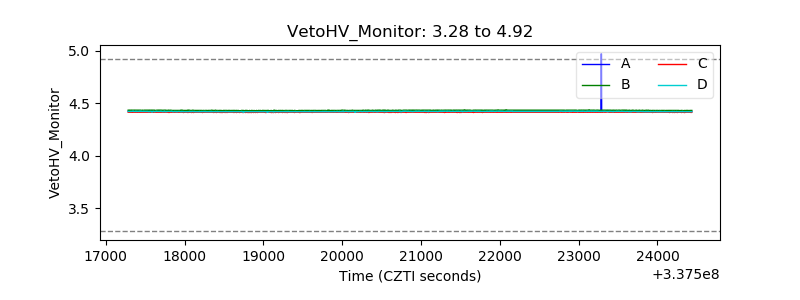 |
| Veto LLD | 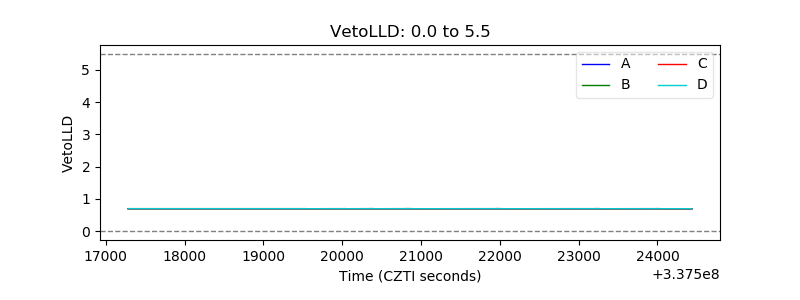 |
| Alpha Counter | 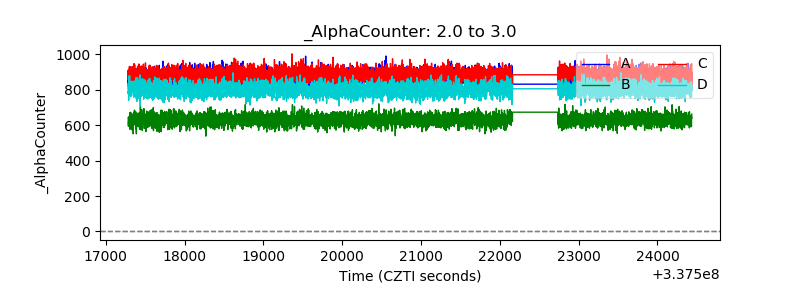 |
| _CPM_Rate | 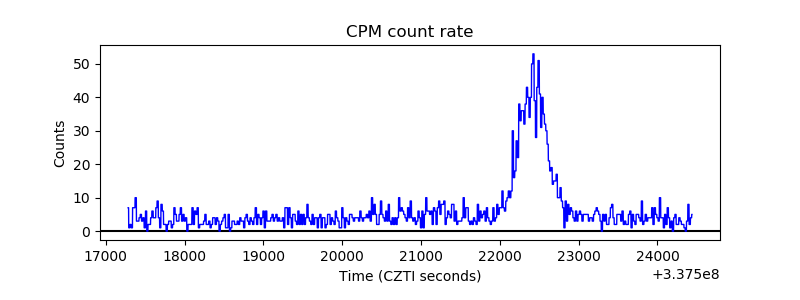 |
| CZT Counter | 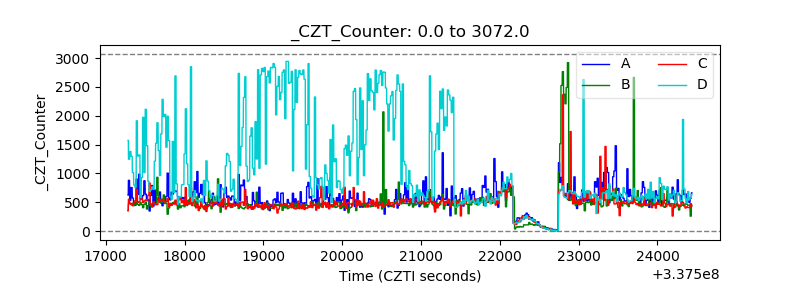 |
| +2.5 Volts monitor |  |
| +5 Volts monitor |  |
| _ROLL_ROT | 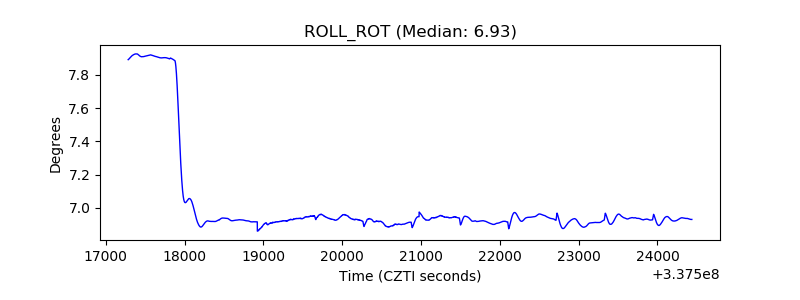 |
| _Roll_DEC | 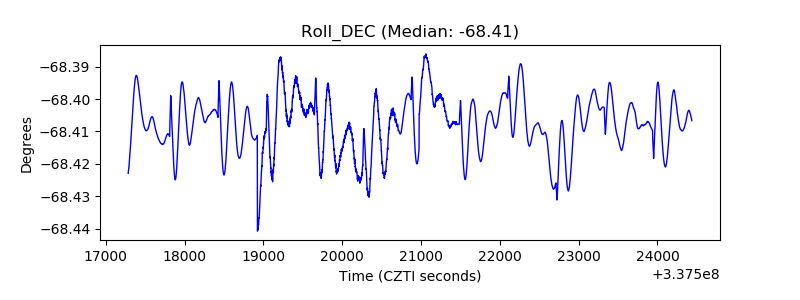 |
| _Roll_RA | 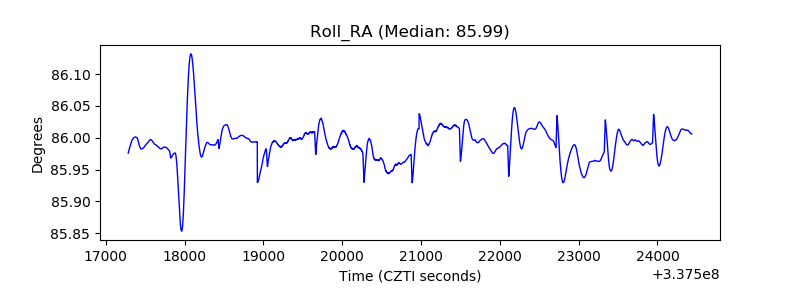 |
| Veto Counter | 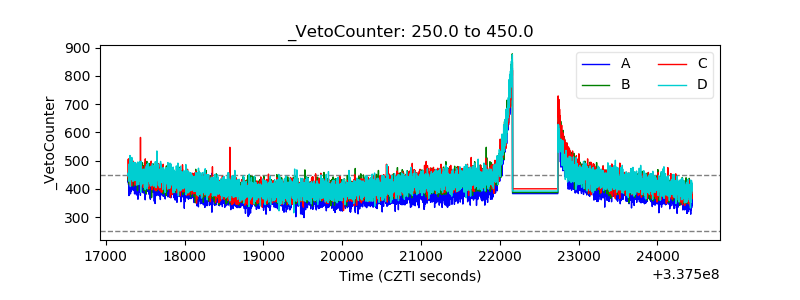 |