| Param | Original file | Final file |
|---|---|---|
| Filename | modeM0/AS1A09_079T01_9000003864_26797cztM0_level2.evt | modeM0/AS1A09_079T01_9000003864_26797cztM0_level2_quad_clean.evt |
| Size (bytes) | 582,647,040 | 102,225,600 |
| Size | 555.7 MB | 97.5 MB |
| Events in quadrant A | 4,202,325 | 656,584 |
| Events in quadrant B | 3,435,959 | 673,695 |
| Events in quadrant C | 3,436,204 | 658,539 |
| Events in quadrant D | 6,096,401 | 618,918 |
| Mode M9 | |||
|---|---|---|---|
| Quadrant | BADHDUFLAG | Total packets | Discarded packets |
| A | 0 | 1 | 0 |
| B | 0 | 1 | 0 |
| C | 0 | 1 | 0 |
| D | 0 | 1 | 0 |
| Mode M0 | |||
|---|---|---|---|
| Quadrant | BADHDUFLAG | Total packets | Discarded packets |
| A | 0 | 16905 | 0 |
| B | 0 | 14651 | 0 |
| C | 0 | 14687 | 0 |
| D | 0 | 22902 | 0 |
| Quadrant | Total seconds | Saturated seconds | Saturation percentage |
|---|---|---|---|
| A | 6994 | 177 | 2.530741% |
| B | 6995 | 190 | 2.716226% |
| C | 6995 | 203 | 2.902073% |
| D | 6995 | 666 | 9.521086% |
Noise dominated data is calculated using 1-second bins in cleaned event files. If a bin has >2000 counts, and if more than 50% of those come from <1% of pixels, then it is considered to be noise-dominated and hence unusable.
| Quadrant | # 1 sec bins | Bins with >0 counts | Bins with >2000 counts | High rate bins dominated by noise | Noise dominated (total time) | Noise dominated (detector-on time) | Marked lightcurve |
|---|---|---|---|---|---|---|---|
| A | 7199 | 6997 | 23 | 23 | 0.32% | 0.33% | 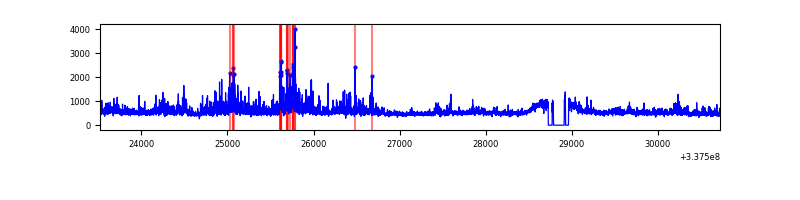 |
| B | 7200 | 6998 | 6 | 6 | 0.08% | 0.09% | 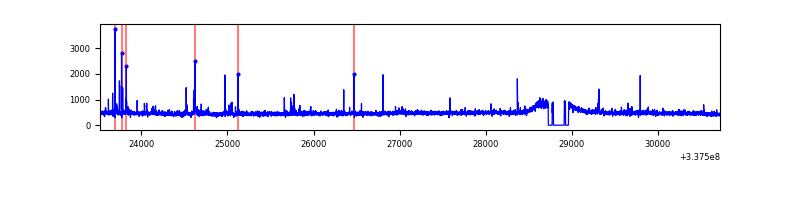 |
| C | 7200 | 6998 | 15 | 15 | 0.21% | 0.21% | 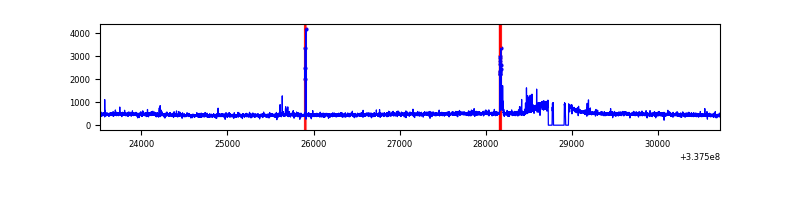 |
| D | 7200 | 6998 | 441 | 441 | 6.12% | 6.30% | 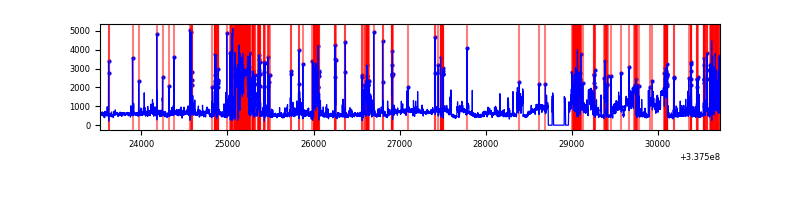 |
Top three noisy pixels from each quadrant. If the there are fewer than three noisy pixels in the level2.evt file, extra rows are filled as -1
| Pixel properties | Quadrant properties | ||||||
|---|---|---|---|---|---|---|---|
| Quadrant | DetID | PixID | Counts | Sigma | Mean | Median | Sigma |
| A | 0 | 13 | 938101 | 5490.17 | 846 | 829 | 170.7 |
| A | 13 | 254 | 10576 | 57.09 | 846 | 829 | 170.7 |
| A | 3 | 137 | 8116 | 42.68 | 846 | 829 | 170.7 |
| B | 10 | 246 | 62311 | 386.47 | 840 | 819 | 159.1 |
| B | 0 | 229 | 27777 | 169.43 | 840 | 819 | 159.1 |
| B | 12 | 111 | 19366 | 116.56 | 840 | 819 | 159.1 |
| C | 14 | 238 | 130945 | 680.02 | 821 | 826 | 191.3 |
| C | 2 | 16 | 55526 | 285.87 | 821 | 826 | 191.3 |
| C | 15 | 208 | 39880 | 204.1 | 821 | 826 | 191.3 |
| D | 1 | 52 | 2448646 | 12584.12 | 808 | 789 | 194.5 |
| D | 2 | 250 | 301530 | 1546.07 | 808 | 789 | 194.5 |
| D | 7 | 80 | 267036 | 1368.74 | 808 | 789 | 194.5 |
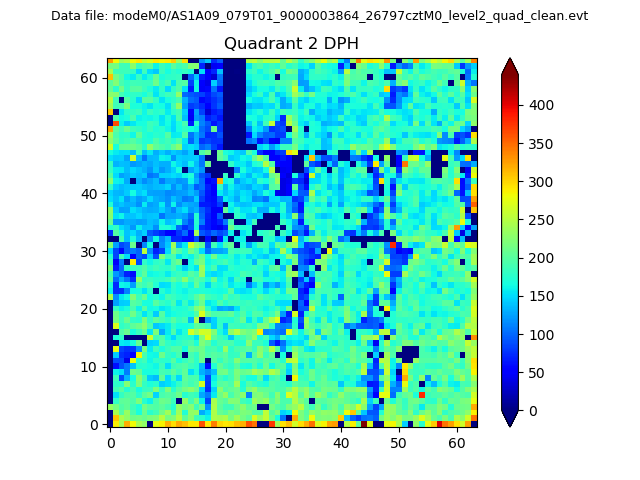
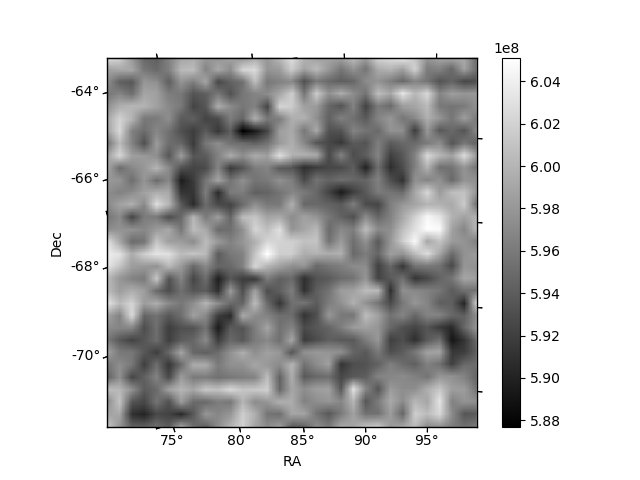
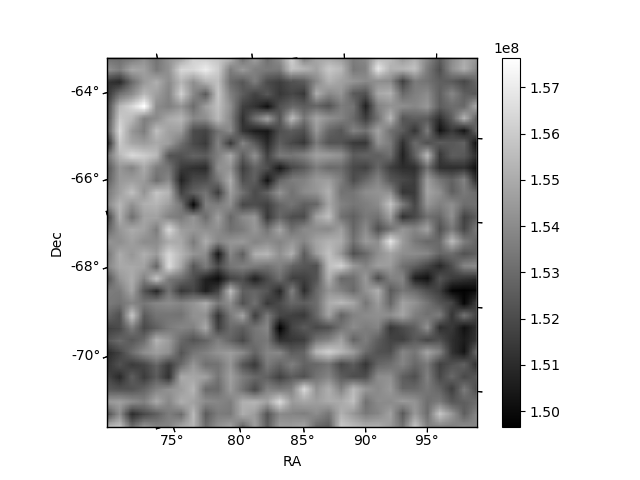
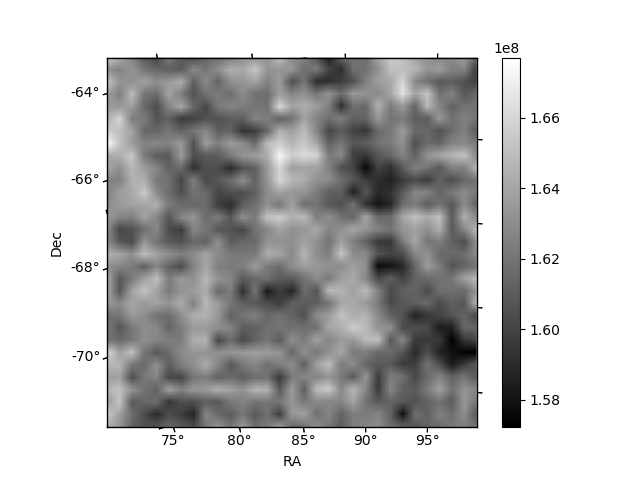
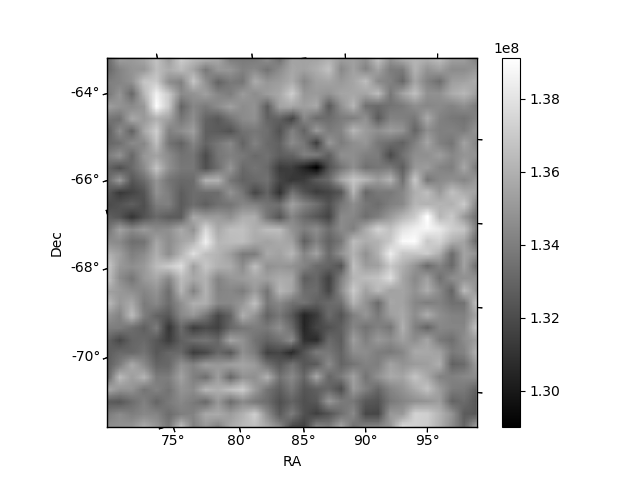
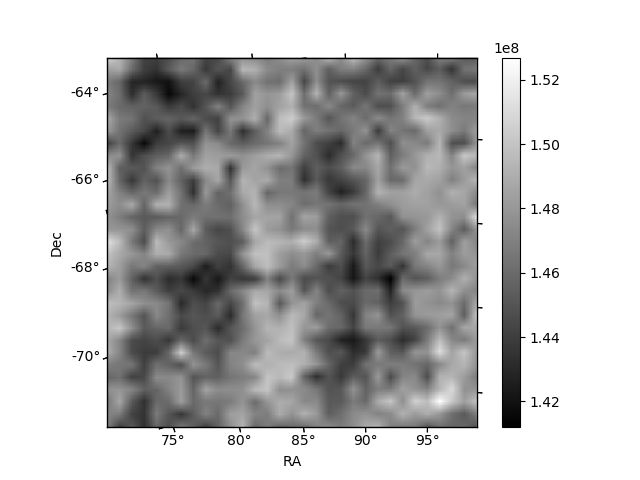
Histogram calculated using DETX and DETY for each event in the final _common_clean file
| Quadrant A | 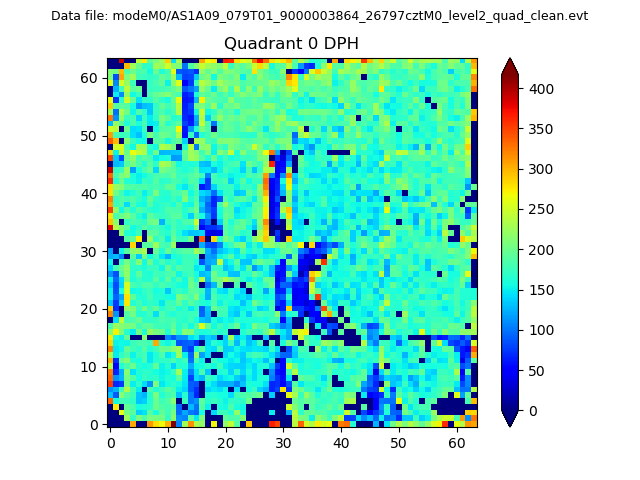 |
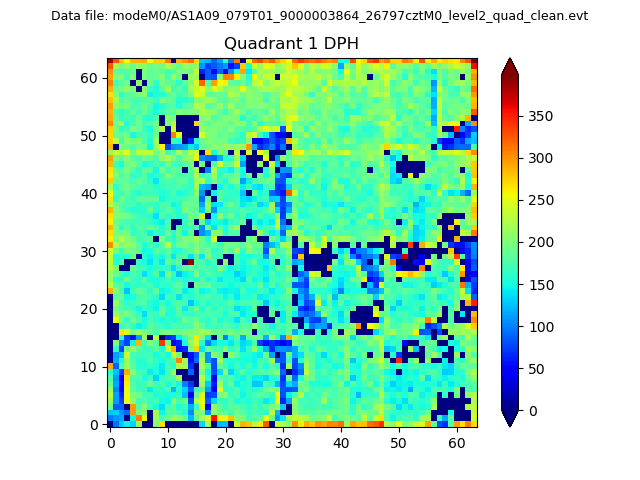 |
Quadrant B |
|---|---|---|---|
| Quadrant D | 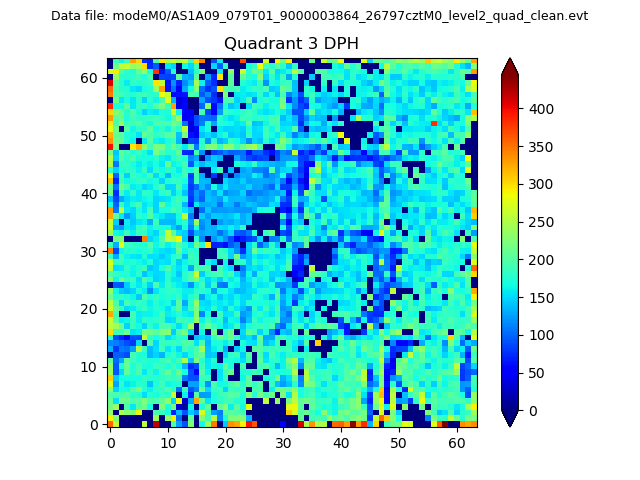 |
 |
Quadrant C |
| Plot type | Count rate plots | Images |
|---|---|---|
| Comparison with Poisson distribution Blue bars denote a histogram of data divided into 1 sec bins. Red curve is a Poisson curve with rate = median count rate of data. |
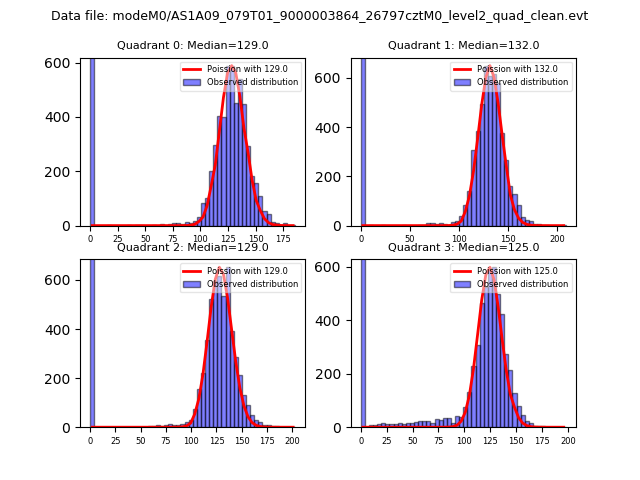 |
 |
| Quadrant-wise count rates Data is divided into 100 sec bins |
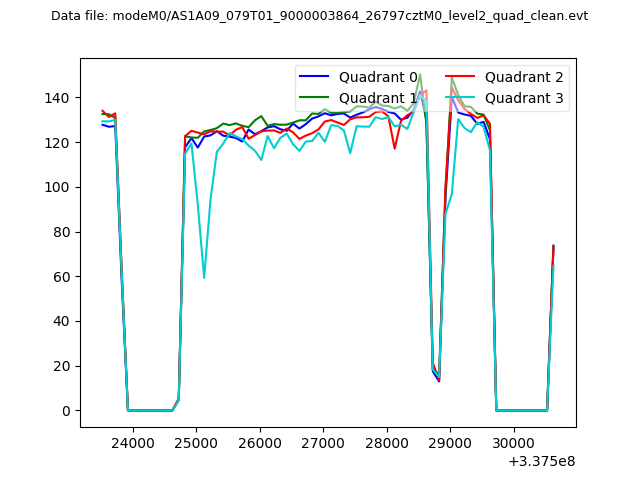 |
|
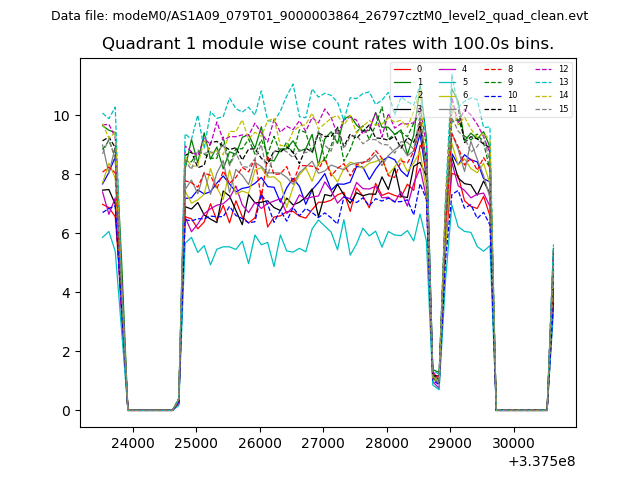
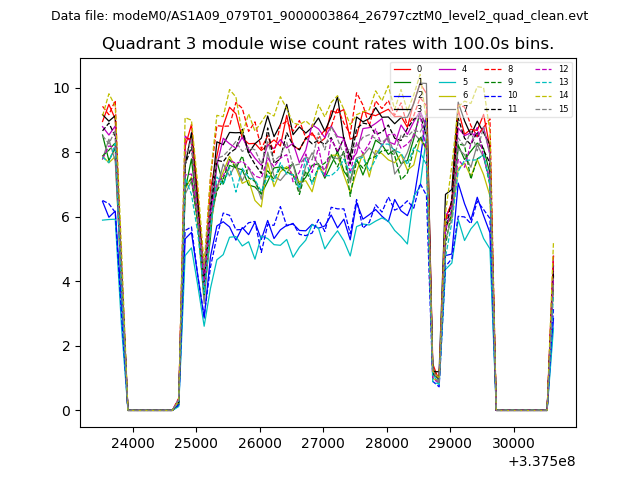
| Module-wise count rates for Quadrant A Data is divided into 100 sec bins |
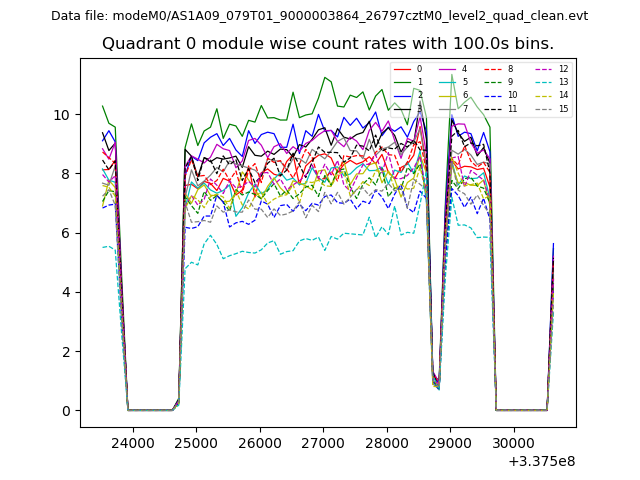 |
 |
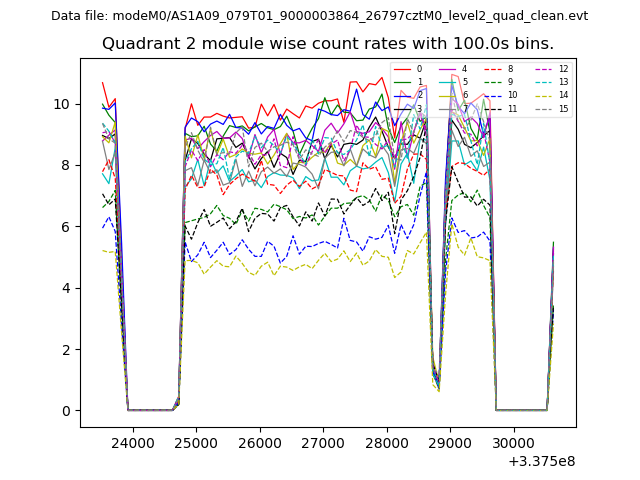
| Module-wise count rates for Quadrant B Data is divided into 100 sec bins |
 |
 |
| Module-wise count rates for Quadrant C Data is divided into 100 sec bins |
 |
 |
| Module-wise count rates for Quadrant D Data is divided into 100 sec bins |
 |
 |
| Parameter | Plot |
|---|---|
| CZT HV Monitor | 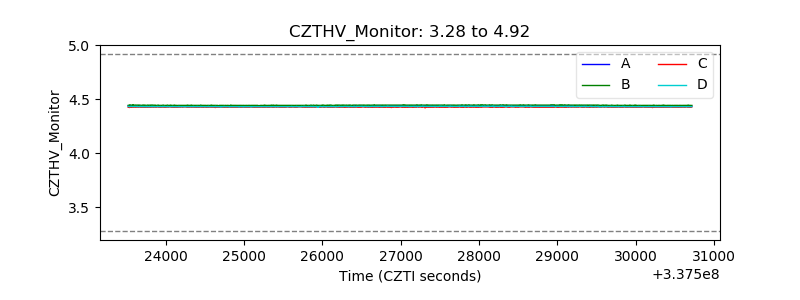 |
| D_VDD | 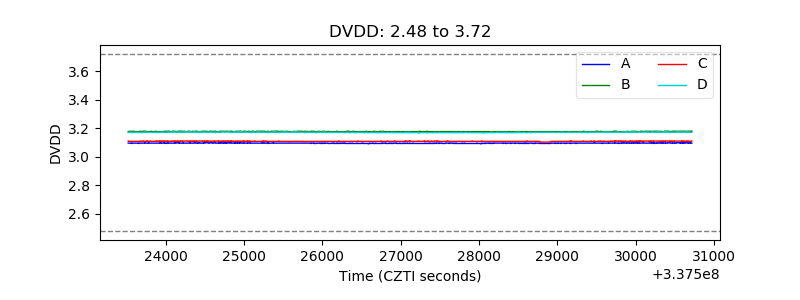 |
| Temperature 1 | 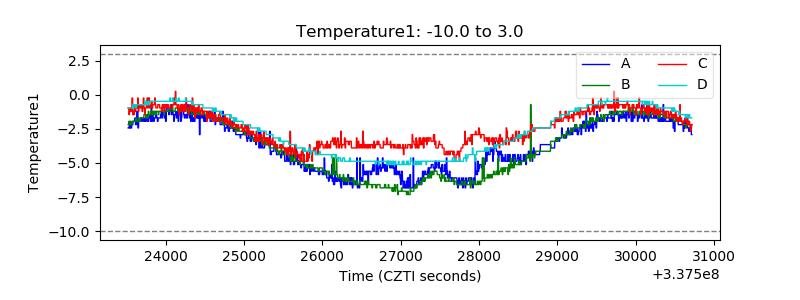 |
| Veto HV Monitor | 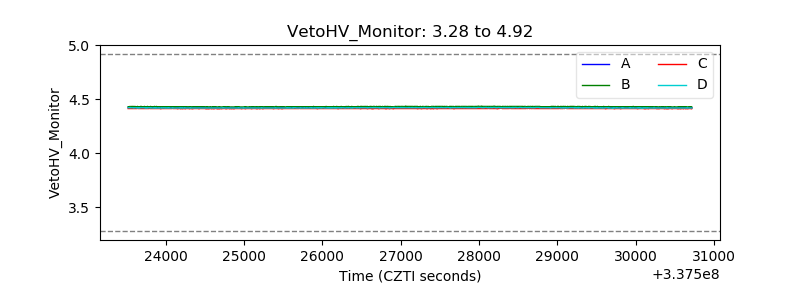 |
| Veto LLD | 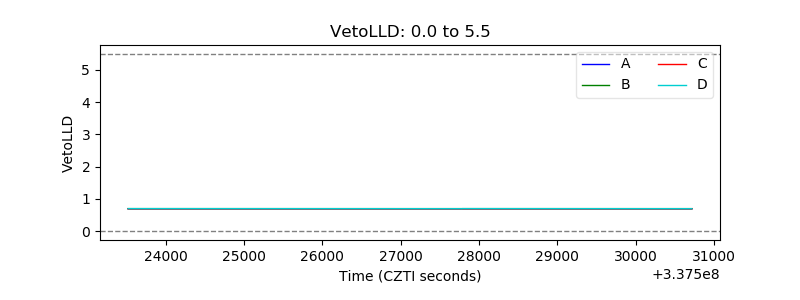 |
| Alpha Counter | 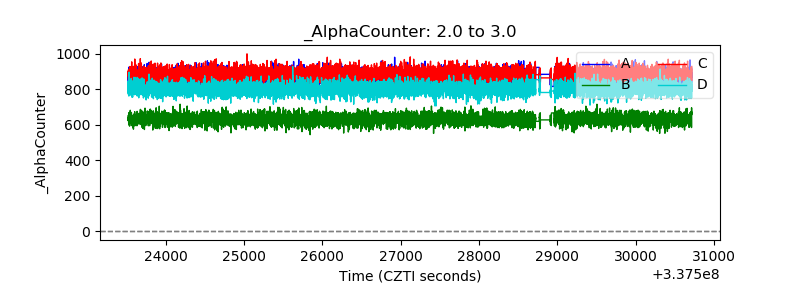 |
| _CPM_Rate | 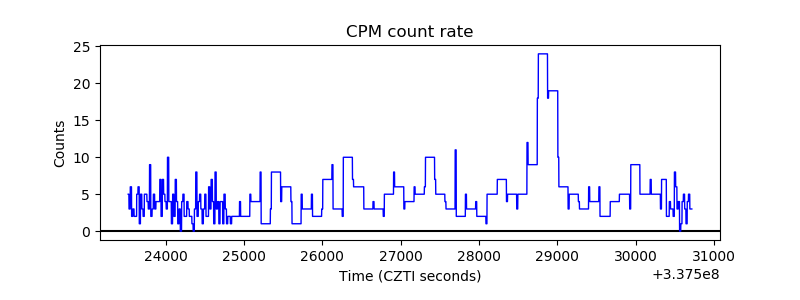 |
| CZT Counter | 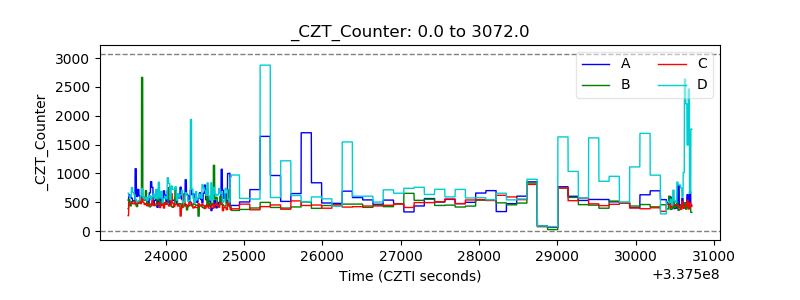 |
| +2.5 Volts monitor |  |
| +5 Volts monitor | 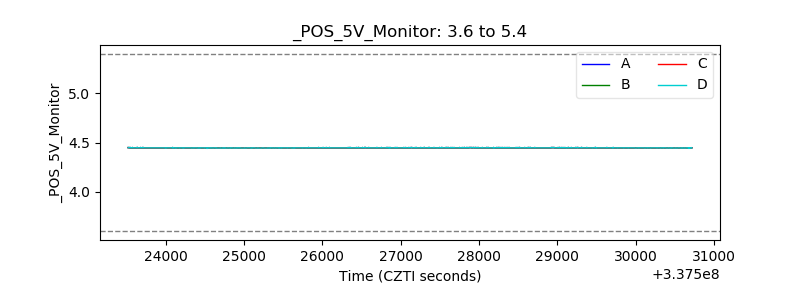 |
| _ROLL_ROT | 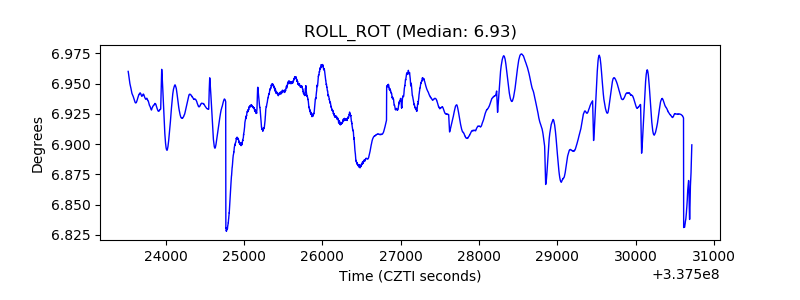 |
| _Roll_DEC | 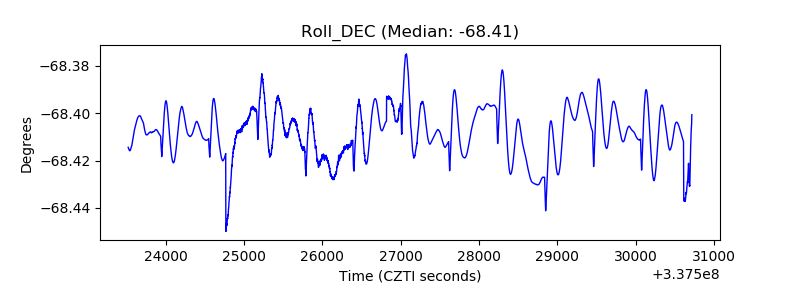 |
| _Roll_RA | 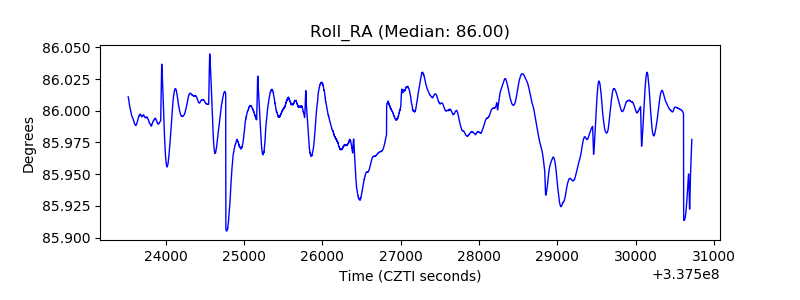 |
| Veto Counter | 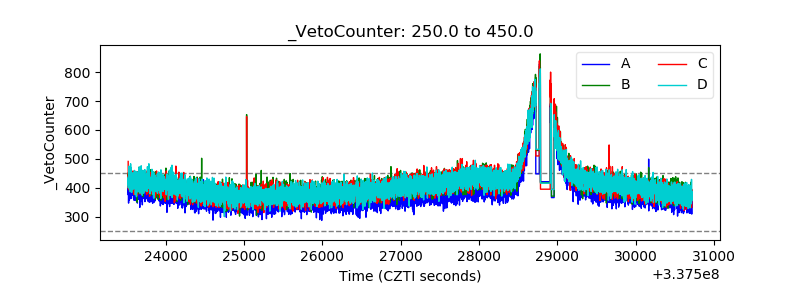 |