| Param | Original file | Final file |
|---|---|---|
| Filename | modeM0/AS1A09_079T01_9000003864_26798cztM0_level2.evt | modeM0/AS1A09_079T01_9000003864_26798cztM0_level2_quad_clean.evt |
| Size (bytes) | 556,536,960 | 97,369,920 |
| Size | 530.8 MB | 92.9 MB |
| Events in quadrant A | 3,285,746 | 631,538 |
| Events in quadrant B | 3,127,909 | 641,342 |
| Events in quadrant C | 3,228,197 | 623,796 |
| Events in quadrant D | 6,765,593 | 591,885 |
| Mode M9 | |||
|---|---|---|---|
| Quadrant | BADHDUFLAG | Total packets | Discarded packets |
| A | 0 | 2 | 0 |
| B | 0 | 2 | 0 |
| C | 0 | 2 | 0 |
| D | 0 | 2 | 0 |
| Mode M0 | |||
|---|---|---|---|
| Quadrant | BADHDUFLAG | Total packets | Discarded packets |
| A | 0 | 13948 | 0 |
| B | 0 | 13581 | 0 |
| C | 0 | 13860 | 0 |
| D | 0 | 24720 | 0 |
| Quadrant | Total seconds | Saturated seconds | Saturation percentage |
|---|---|---|---|
| A | 6590 | 102 | 1.547800% |
| B | 6590 | 120 | 1.820941% |
| C | 6591 | 134 | 2.033075% |
| D | 6591 | 665 | 10.089516% |
Noise dominated data is calculated using 1-second bins in cleaned event files. If a bin has >2000 counts, and if more than 50% of those come from <1% of pixels, then it is considered to be noise-dominated and hence unusable.
| Quadrant | # 1 sec bins | Bins with >0 counts | Bins with >2000 counts | High rate bins dominated by noise | Noise dominated (total time) | Noise dominated (detector-on time) | Marked lightcurve |
|---|---|---|---|---|---|---|---|
| A | 6840 | 6592 | 0 | 0 | 0.00% | 0.00% | 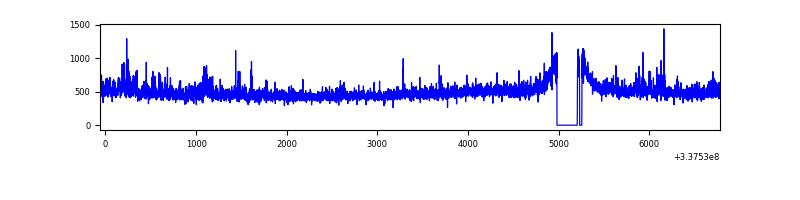 |
| B | 6840 | 6592 | 0 | 0 | 0.00% | 0.00% | 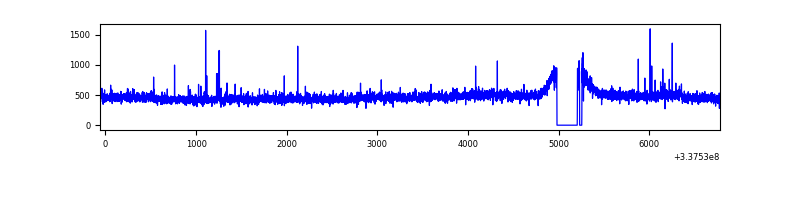 |
| C | 6841 | 6593 | 13 | 13 | 0.19% | 0.20% | 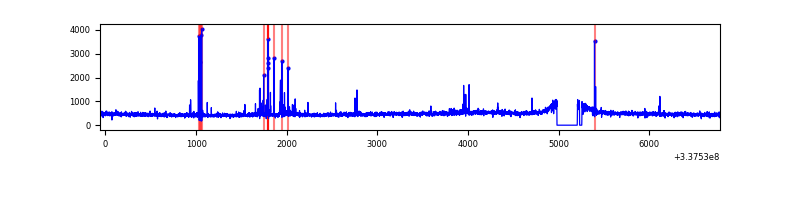 |
| D | 6841 | 6593 | 520 | 520 | 7.60% | 7.89% | 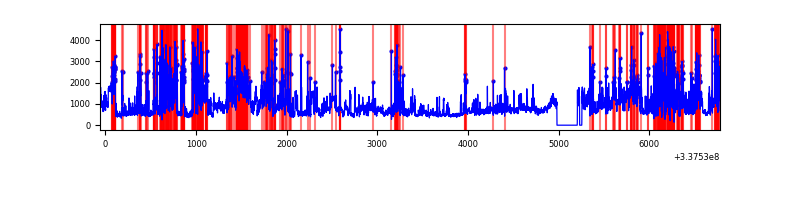 |
Top three noisy pixels from each quadrant. If the there are fewer than three noisy pixels in the level2.evt file, extra rows are filled as -1
| Pixel properties | Quadrant properties | ||||||
|---|---|---|---|---|---|---|---|
| Quadrant | DetID | PixID | Counts | Sigma | Mean | Median | Sigma |
| A | 0 | 13 | 232969 | 1444.92 | 791 | 772 | 160.7 |
| A | 13 | 254 | 10329 | 59.47 | 791 | 772 | 160.7 |
| A | 3 | 137 | 7563 | 42.26 | 791 | 772 | 160.7 |
| B | 10 | 246 | 22849 | 146.94 | 785 | 763 | 150.3 |
| B | 12 | 111 | 18284 | 116.57 | 785 | 763 | 150.3 |
| B | 15 | 33 | 17801 | 113.35 | 785 | 763 | 150.3 |
| C | 14 | 238 | 121362 | 672.54 | 764 | 767 | 179.3 |
| C | 15 | 208 | 81949 | 452.74 | 764 | 767 | 179.3 |
| C | 2 | 16 | 36194 | 197.57 | 764 | 767 | 179.3 |
| D | 1 | 52 | 2654539 | 14660.67 | 750 | 731 | 181.0 |
| D | 7 | 80 | 1028204 | 5676.16 | 750 | 731 | 181.0 |
| D | 2 | 250 | 200008 | 1100.88 | 750 | 731 | 181.0 |
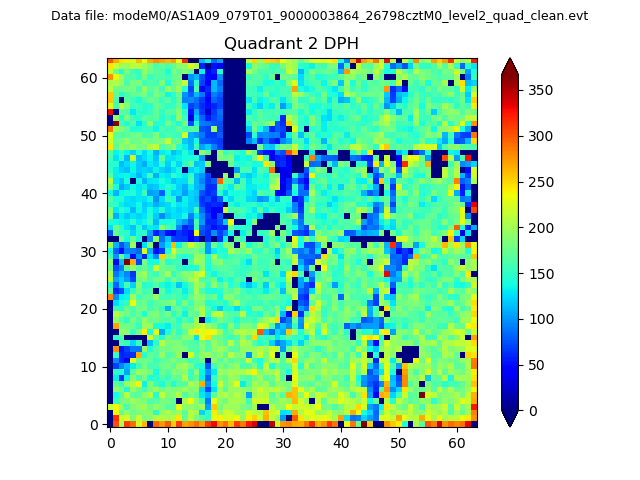
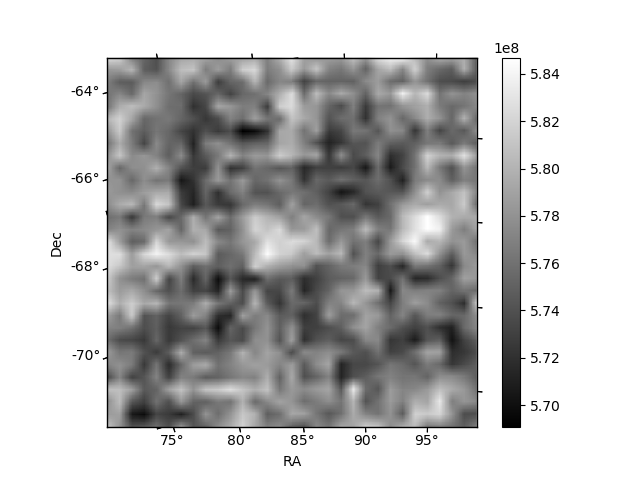
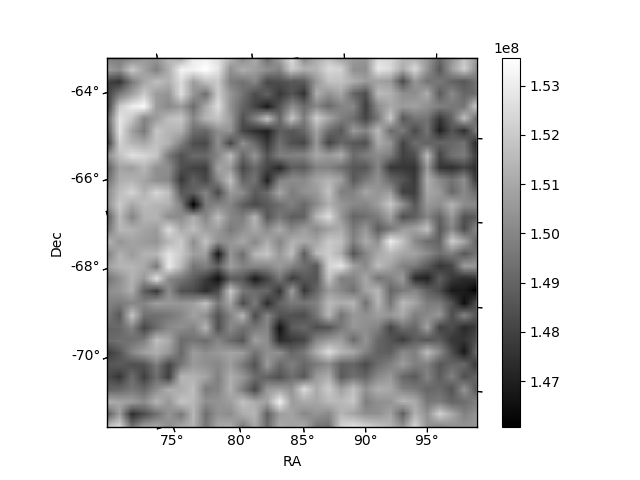
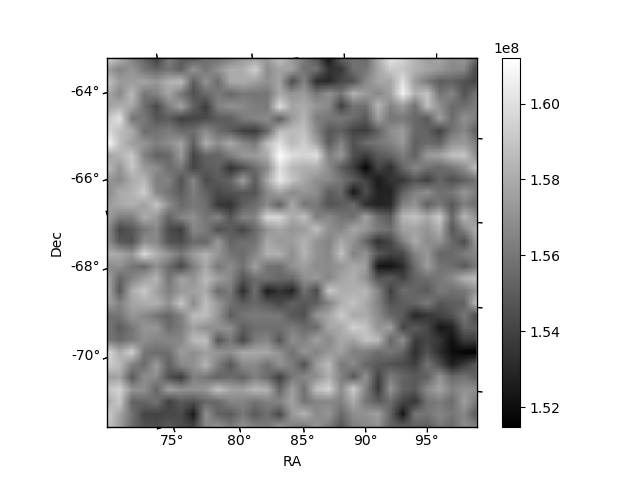
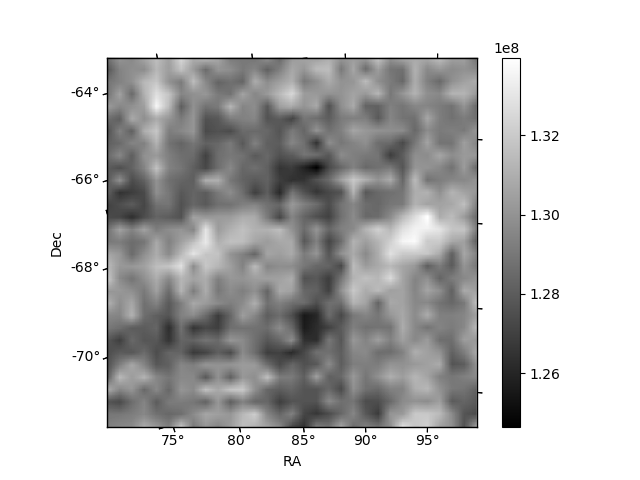
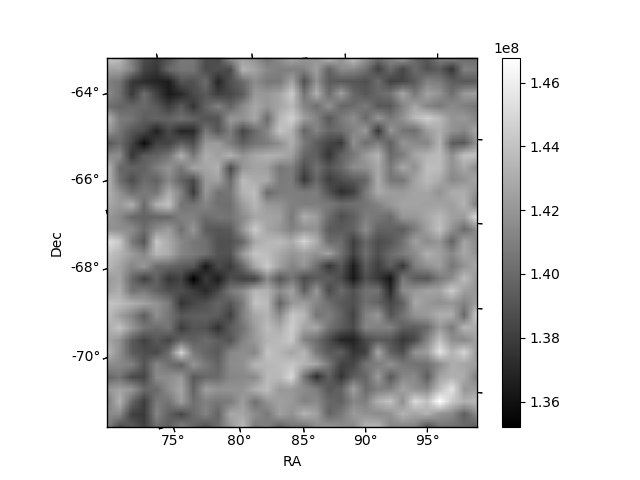
Histogram calculated using DETX and DETY for each event in the final _common_clean file
| Quadrant A | 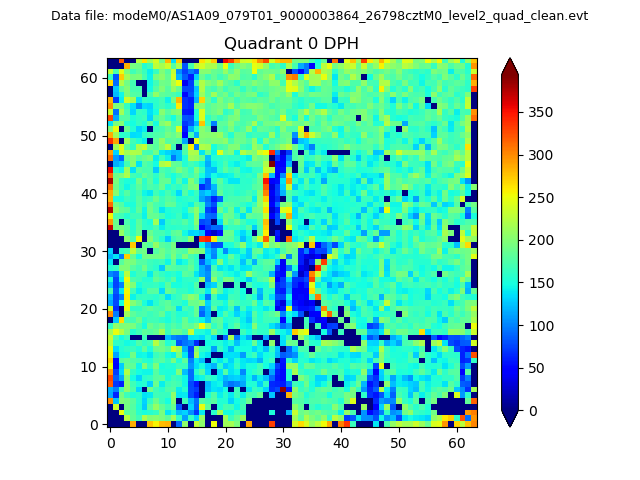 |
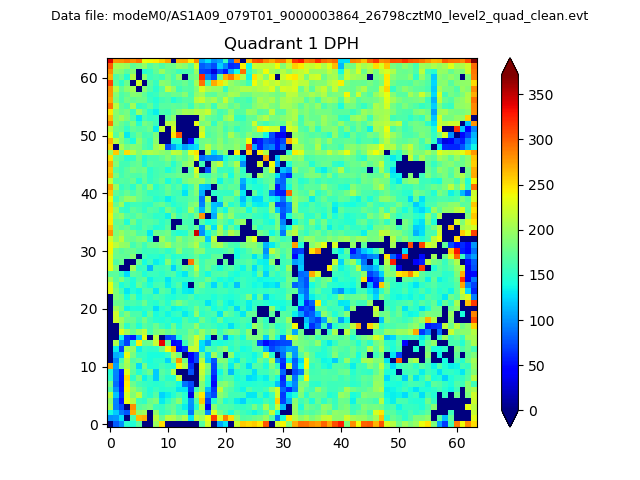 |
Quadrant B |
|---|---|---|---|
| Quadrant D | 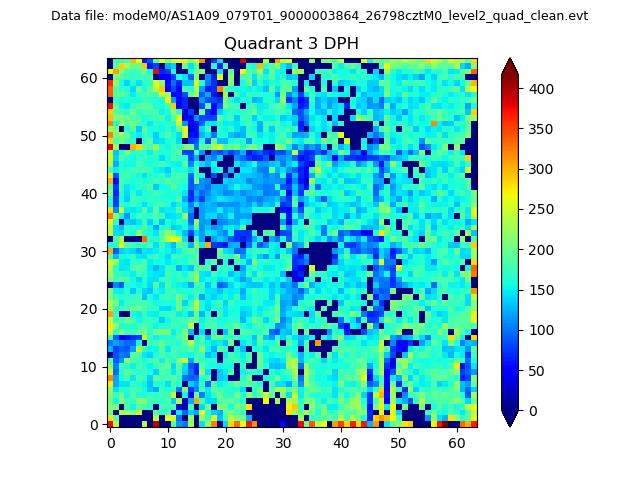 |
 |
Quadrant C |
| Plot type | Count rate plots | Images |
|---|---|---|
| Comparison with Poisson distribution Blue bars denote a histogram of data divided into 1 sec bins. Red curve is a Poisson curve with rate = median count rate of data. |
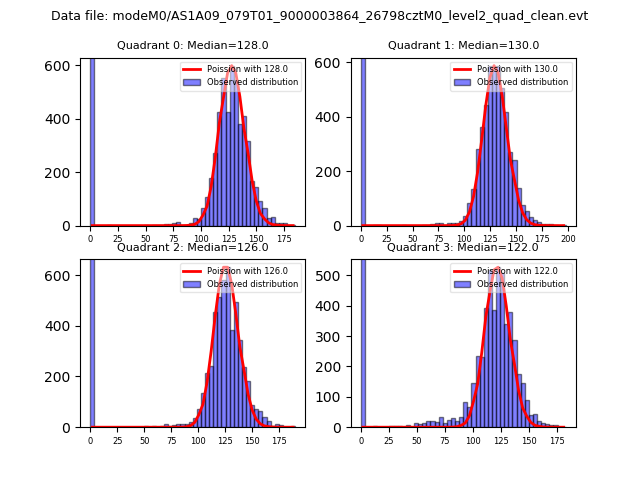 |
 |
| Quadrant-wise count rates Data is divided into 100 sec bins |
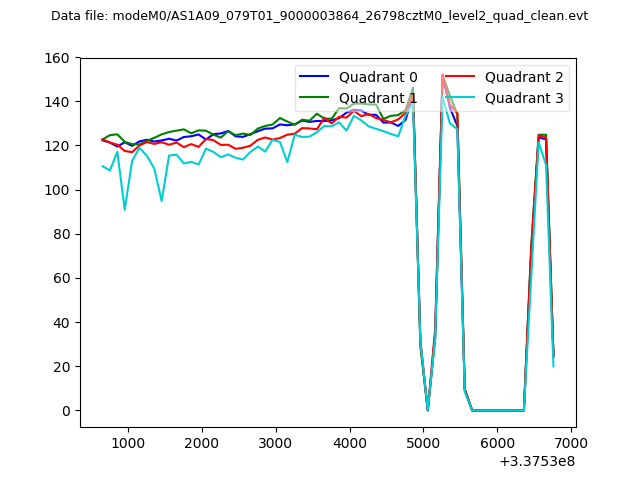 |
|
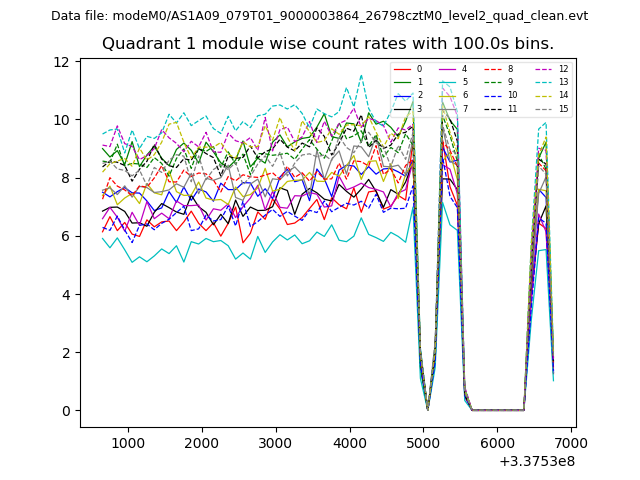
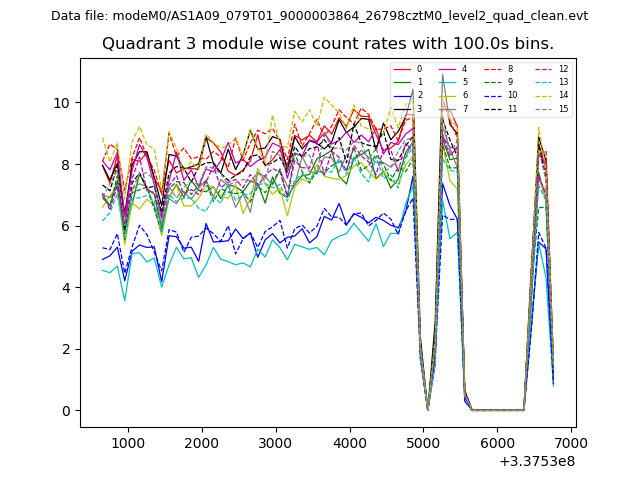
| Module-wise count rates for Quadrant A Data is divided into 100 sec bins |
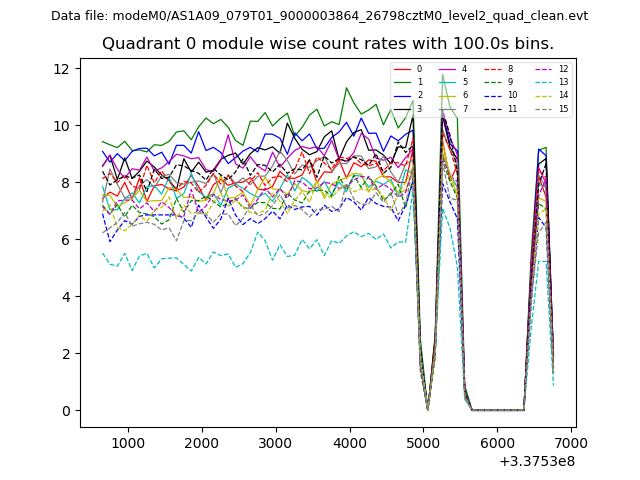 |
 |
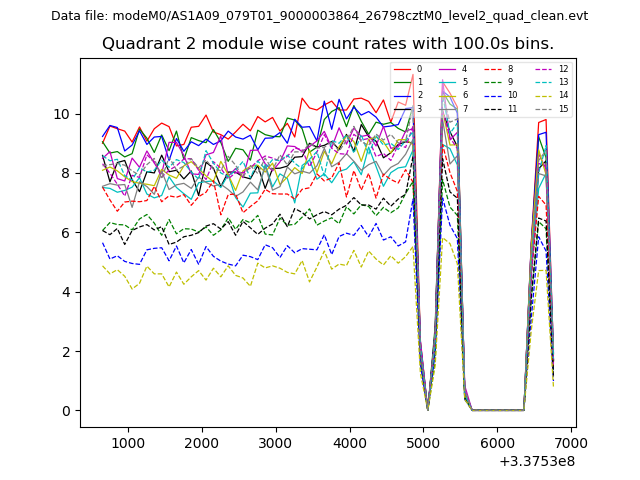
| Module-wise count rates for Quadrant B Data is divided into 100 sec bins |
 |
 |
| Module-wise count rates for Quadrant C Data is divided into 100 sec bins |
 |
 |
| Module-wise count rates for Quadrant D Data is divided into 100 sec bins |
 |
 |
| Parameter | Plot |
|---|---|
| CZT HV Monitor | 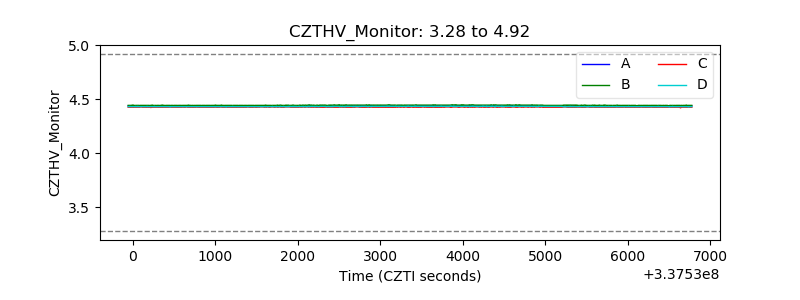 |
| D_VDD | 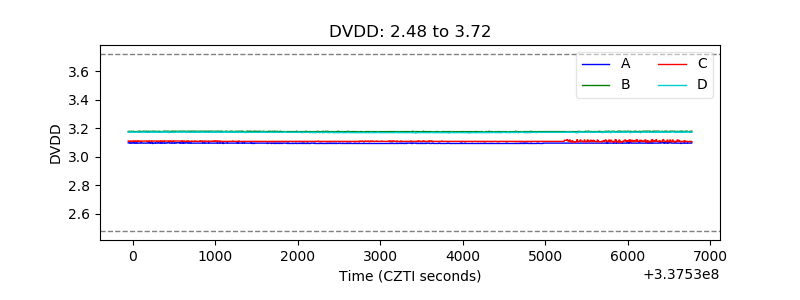 |
| Temperature 1 |  |
| Veto HV Monitor | 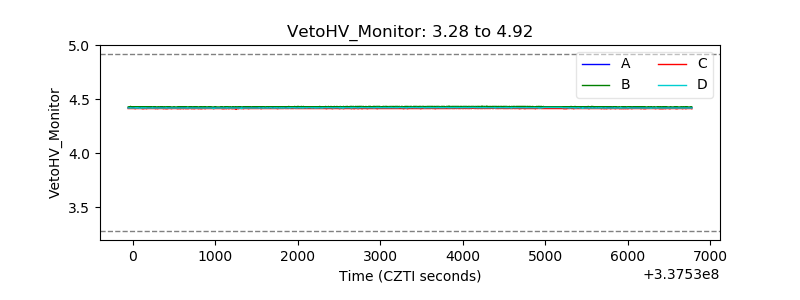 |
| Veto LLD | 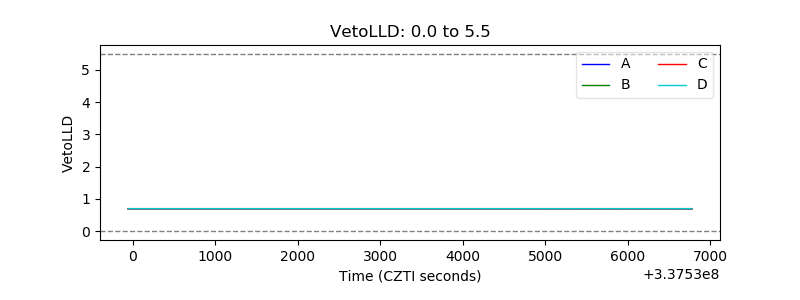 |
| Alpha Counter | 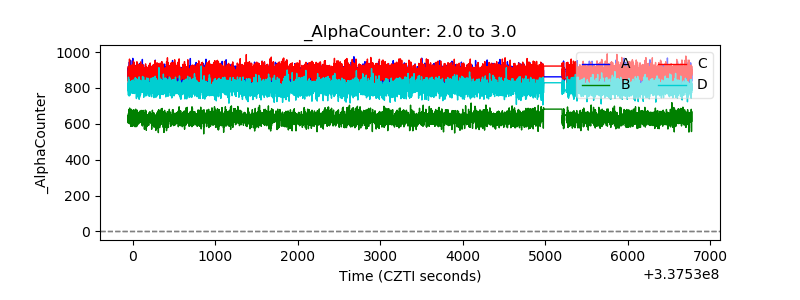 |
| _CPM_Rate | 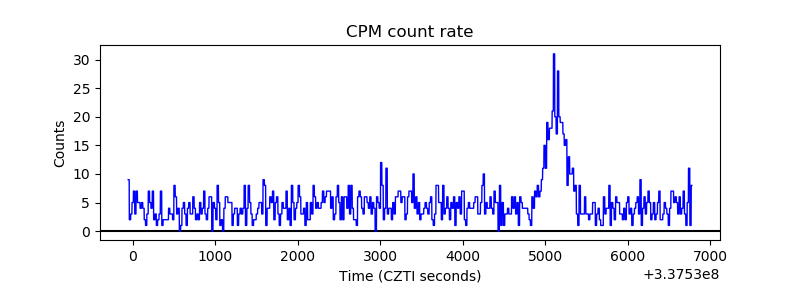 |
| CZT Counter | 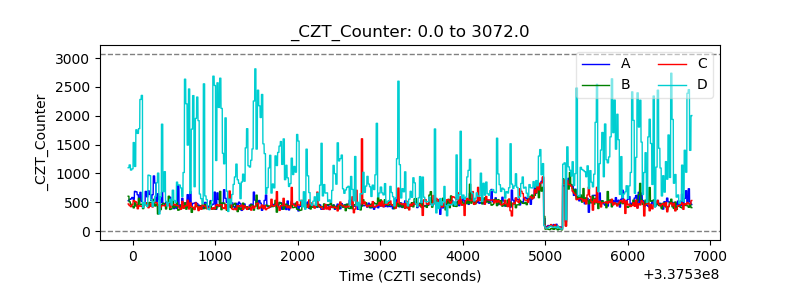 |
| +2.5 Volts monitor |  |
| +5 Volts monitor |  |
| _ROLL_ROT | 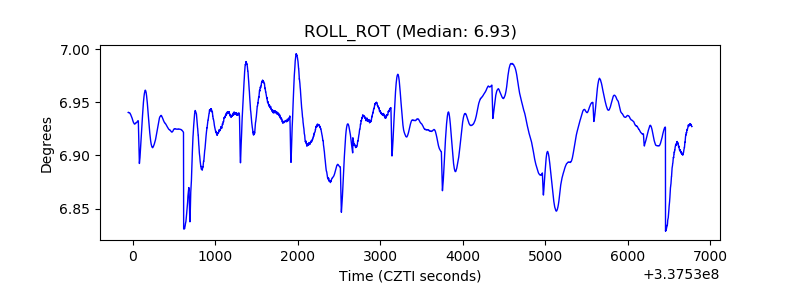 |
| _Roll_DEC |  |
| _Roll_RA | 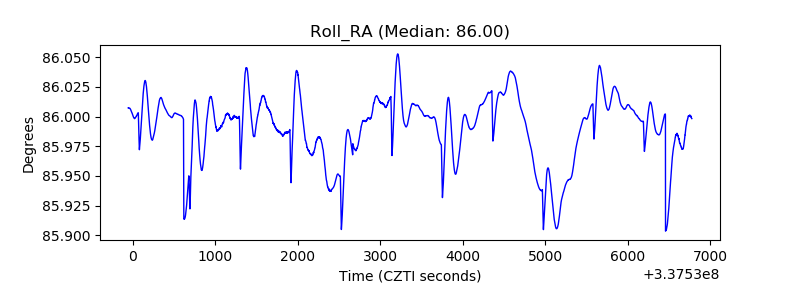 |
| Veto Counter |  |