| Param | Original file | Final file |
|---|---|---|
| Filename | modeM0/AS1A09_079T01_9000003864_26799cztM0_level2.evt | modeM0/AS1A09_079T01_9000003864_26799cztM0_level2_quad_clean.evt |
| Size (bytes) | 408,954,240 | 73,641,600 |
| Size | 390.0 MB | 70.2 MB |
| Events in quadrant A | 2,281,794 | 483,353 |
| Events in quadrant B | 2,167,983 | 492,105 |
| Events in quadrant C | 2,187,290 | 474,742 |
| Events in quadrant D | 5,424,579 | 445,362 |
| Mode M0 | |||
|---|---|---|---|
| Quadrant | BADHDUFLAG | Total packets | Discarded packets |
| A | 0 | 9839 | 0 |
| B | 0 | 9621 | 0 |
| C | 0 | 9647 | 0 |
| D | 0 | 19366 | 0 |
| Quadrant | Total seconds | Saturated seconds | Saturation percentage |
|---|---|---|---|
| A | 4757 | 1 | 0.021022% |
| B | 4757 | 4 | 0.084087% |
| C | 4758 | 21 | 0.441362% |
| D | 4758 | 534 | 11.223203% |
Noise dominated data is calculated using 1-second bins in cleaned event files. If a bin has >2000 counts, and if more than 50% of those come from <1% of pixels, then it is considered to be noise-dominated and hence unusable.
| Quadrant | # 1 sec bins | Bins with >0 counts | Bins with >2000 counts | High rate bins dominated by noise | Noise dominated (total time) | Noise dominated (detector-on time) | Marked lightcurve |
|---|---|---|---|---|---|---|---|
| A | 4757 | 4757 | 0 | 0 | 0.00% | 0.00% | 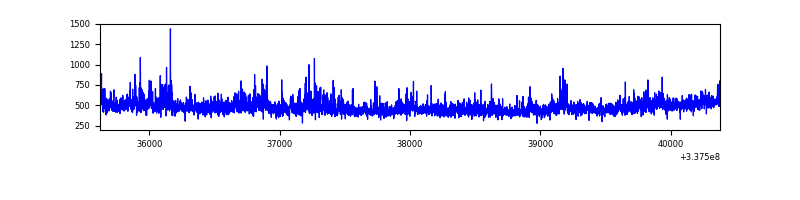 |
| B | 4757 | 4757 | 0 | 0 | 0.00% | 0.00% | 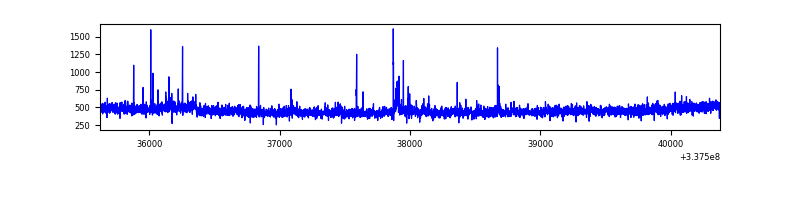 |
| C | 4758 | 4758 | 2 | 2 | 0.04% | 0.04% | 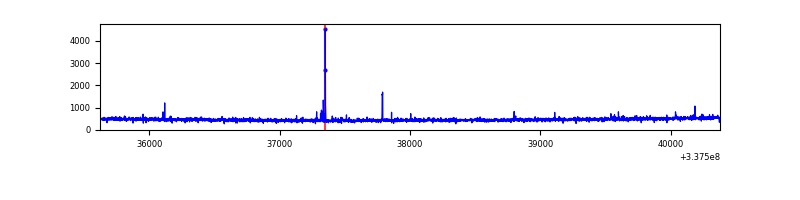 |
| D | 4758 | 4758 | 514 | 514 | 10.80% | 10.80% | 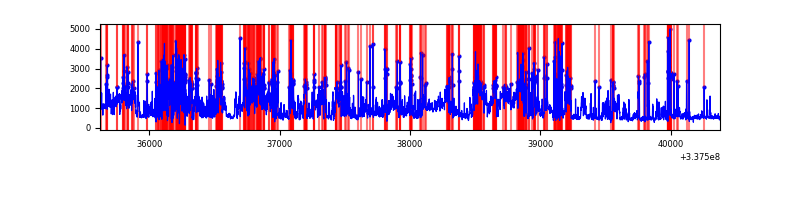 |
Top three noisy pixels from each quadrant. If the there are fewer than three noisy pixels in the level2.evt file, extra rows are filled as -1
| Pixel properties | Quadrant properties | ||||||
|---|---|---|---|---|---|---|---|
| Quadrant | DetID | PixID | Counts | Sigma | Mean | Median | Sigma |
| A | 0 | 13 | 193092 | 1731.35 | 541 | 530 | 111.2 |
| A | 13 | 254 | 7632 | 63.86 | 541 | 530 | 111.2 |
| A | 3 | 137 | 5164 | 41.66 | 541 | 530 | 111.2 |
| B | 0 | 229 | 17095 | 160.42 | 540 | 527 | 103.3 |
| B | 15 | 33 | 12380 | 114.77 | 540 | 527 | 103.3 |
| B | 12 | 111 | 12331 | 114.29 | 540 | 527 | 103.3 |
| C | 14 | 238 | 85662 | 687.01 | 526 | 529 | 123.9 |
| C | 15 | 208 | 26558 | 210.05 | 526 | 529 | 123.9 |
| C | 10 | 22 | 8690 | 65.86 | 526 | 529 | 123.9 |
| D | 1 | 52 | 3238287 | 26385.58 | 508 | 496 | 122.7 |
| D | 2 | 250 | 207674 | 1688.35 | 508 | 496 | 122.7 |
| D | 2 | 234 | 21807 | 173.67 | 508 | 496 | 122.7 |
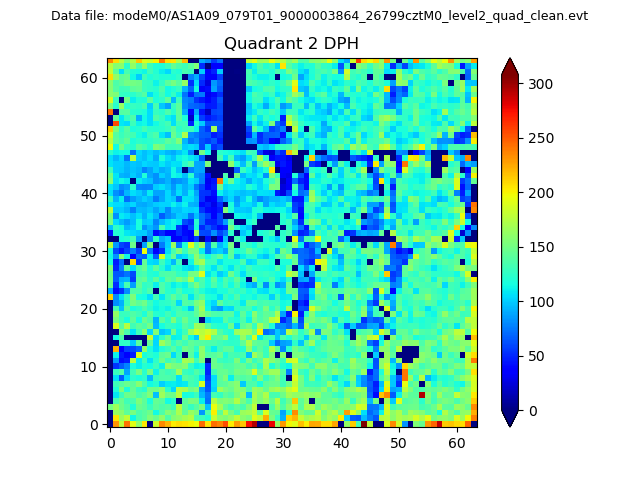
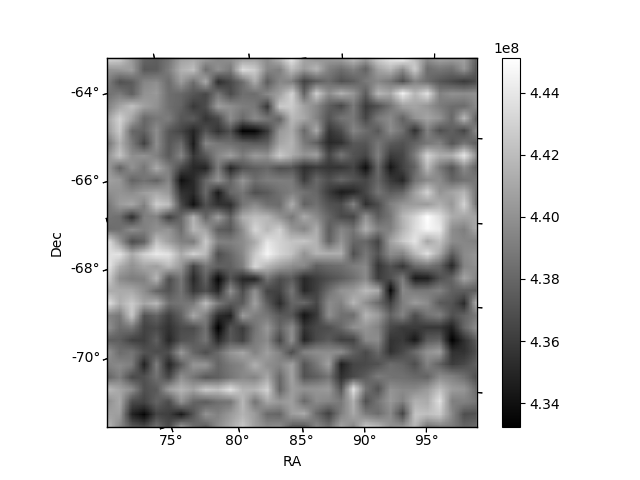
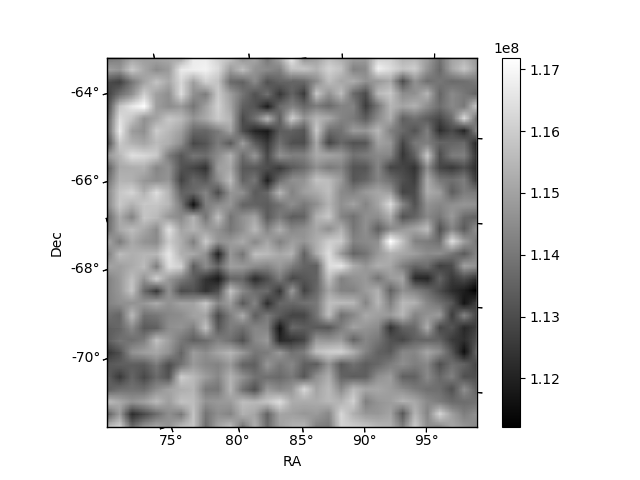
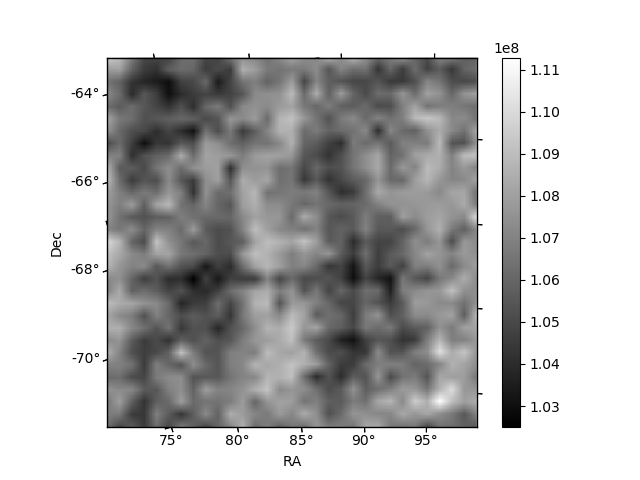
Histogram calculated using DETX and DETY for each event in the final _common_clean file
| Quadrant A | 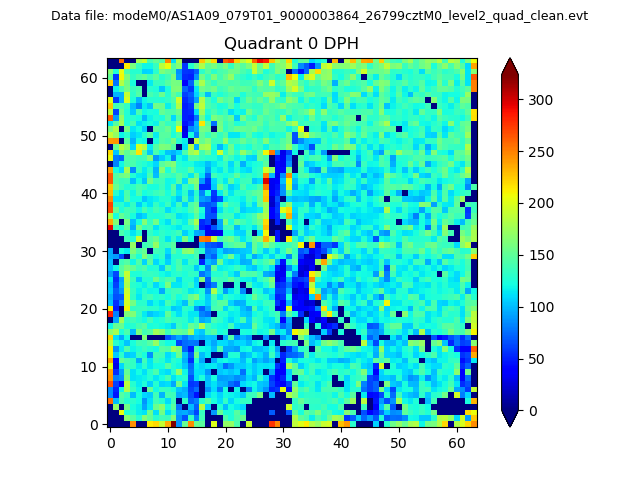 |
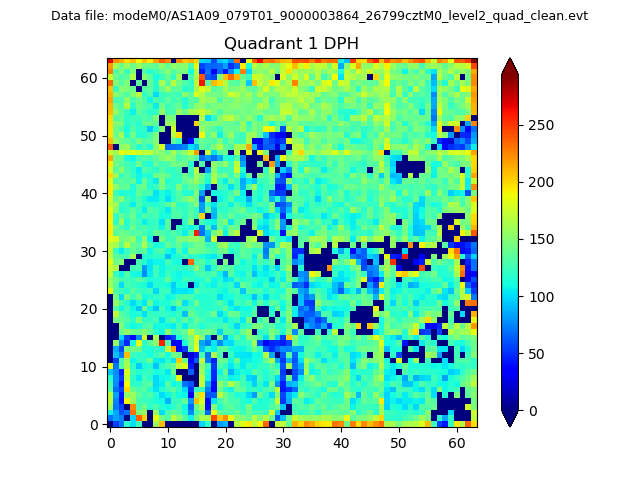 |
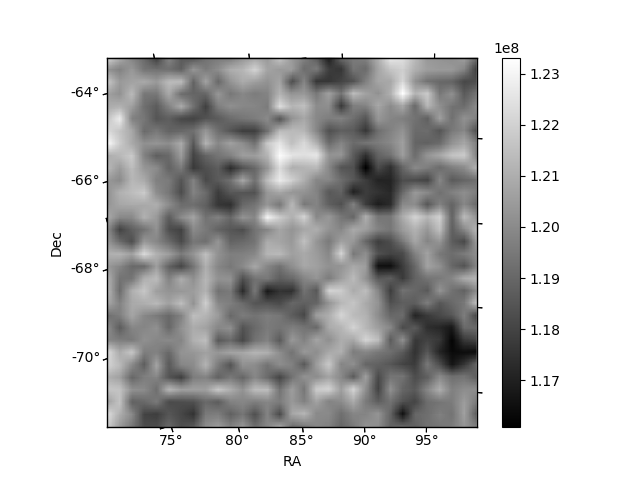
Quadrant B |
|---|---|---|---|
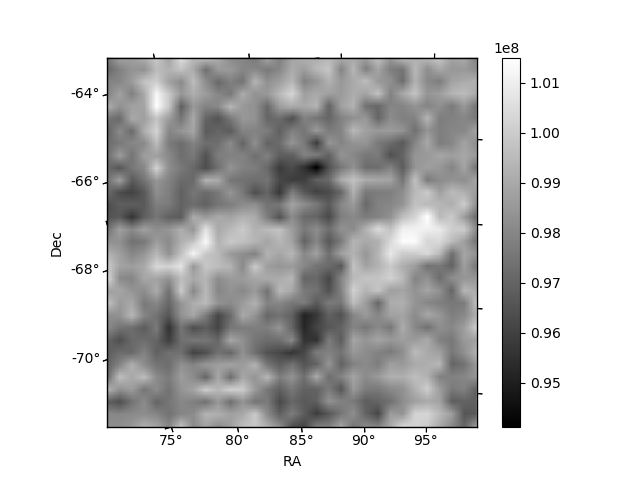
| Quadrant D | 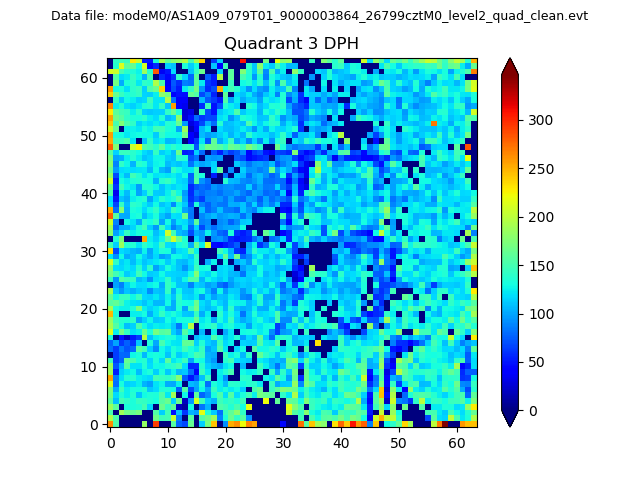 |
 |
Quadrant C |
| Plot type | Count rate plots | Images |
|---|---|---|
| Comparison with Poisson distribution Blue bars denote a histogram of data divided into 1 sec bins. Red curve is a Poisson curve with rate = median count rate of data. |
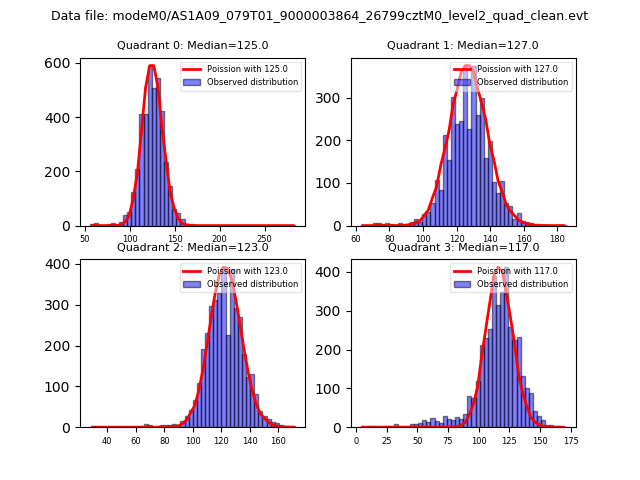 |
 |
| Quadrant-wise count rates Data is divided into 100 sec bins |
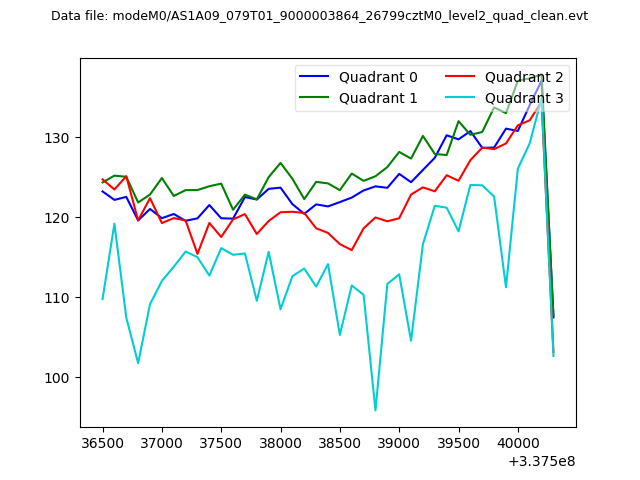 |
|
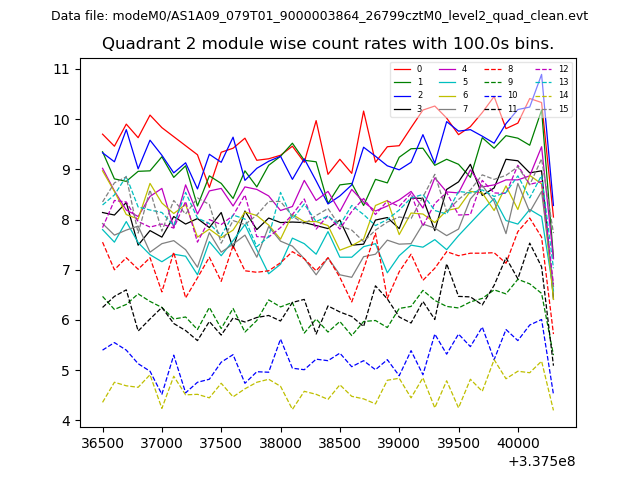
| Module-wise count rates for Quadrant A Data is divided into 100 sec bins |
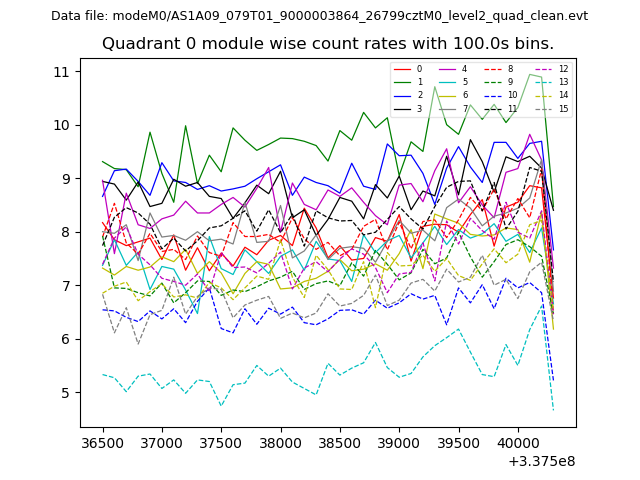 |
 |
| Module-wise count rates for Quadrant B Data is divided into 100 sec bins |
 |
 |
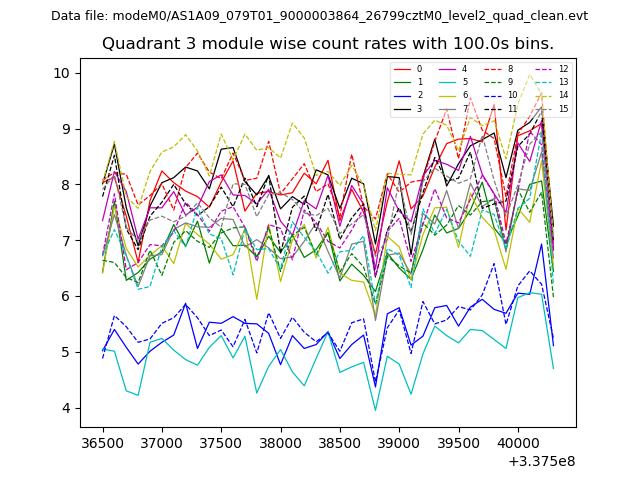
| Module-wise count rates for Quadrant C Data is divided into 100 sec bins |
 |
 |
| Module-wise count rates for Quadrant D Data is divided into 100 sec bins |
 |
 |
| Parameter | Plot |
|---|---|
| CZT HV Monitor | 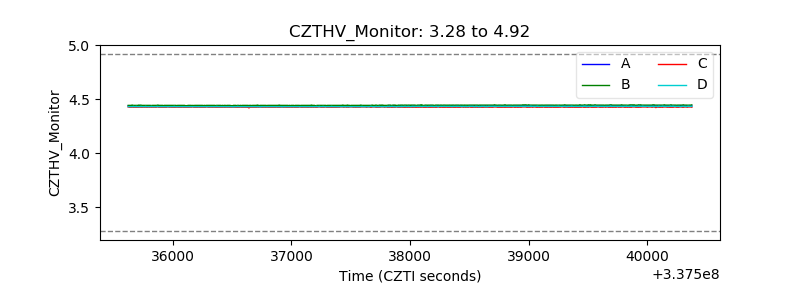 |
| D_VDD | 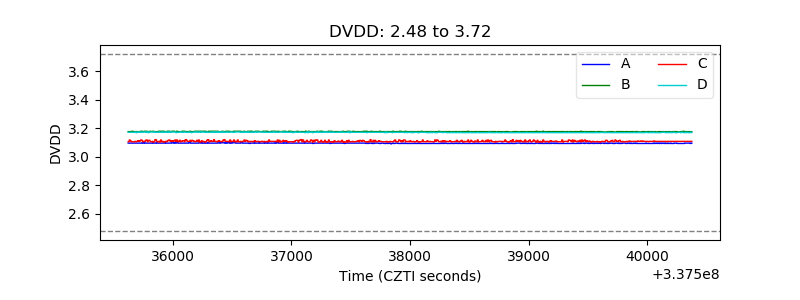 |
| Temperature 1 | 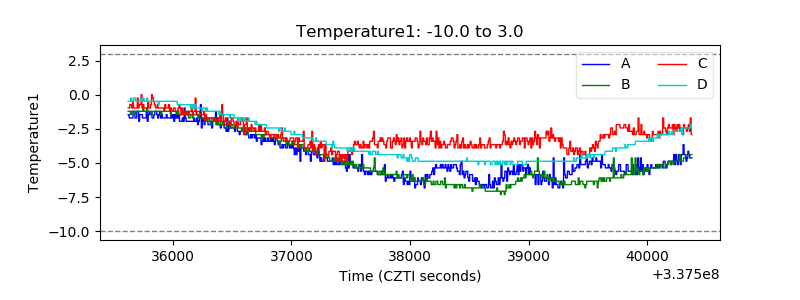 |
| Veto HV Monitor | 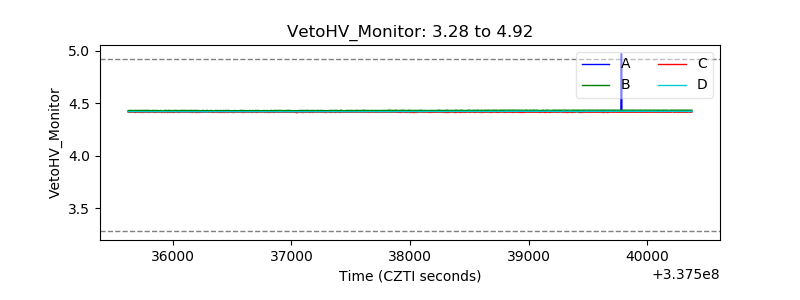 |
| Veto LLD | 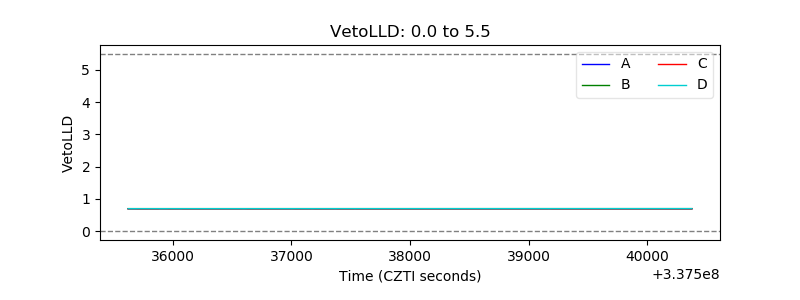 |
| Alpha Counter | 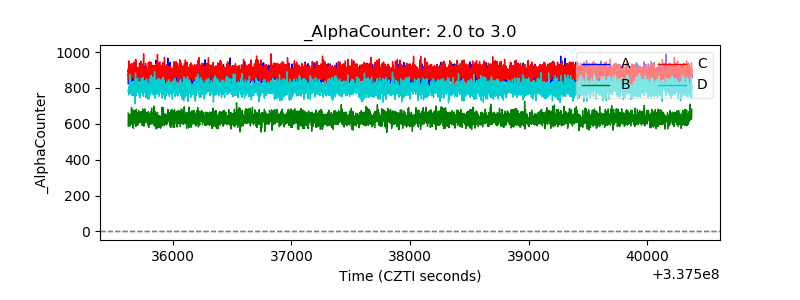 |
| _CPM_Rate | 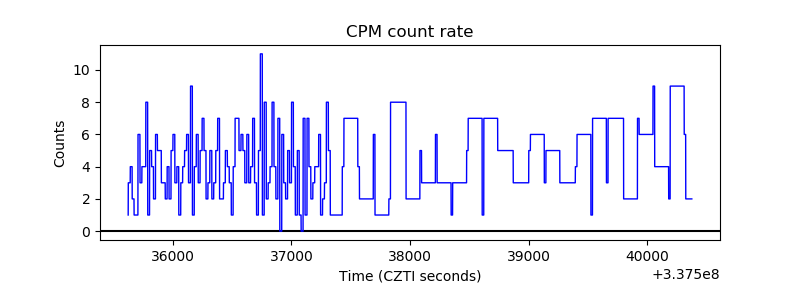 |
| CZT Counter | 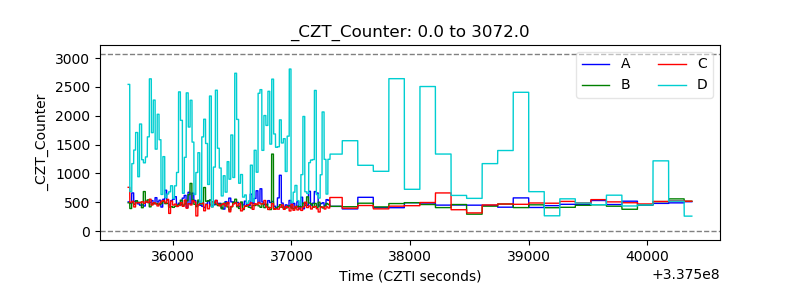 |
| +2.5 Volts monitor |  |
| +5 Volts monitor |  |
| _ROLL_ROT | 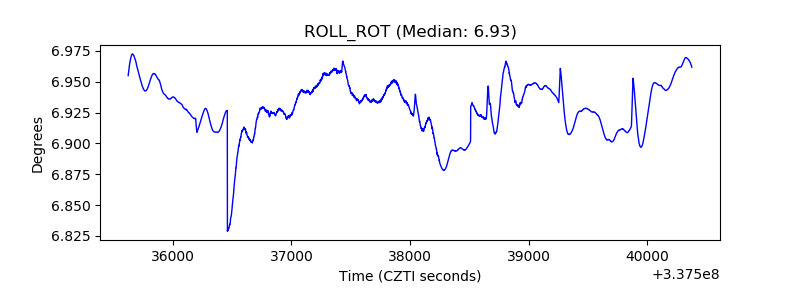 |
| _Roll_DEC |  |
| _Roll_RA | 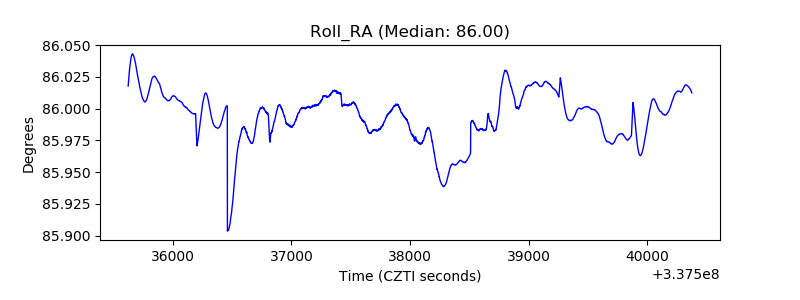 |
| Veto Counter | 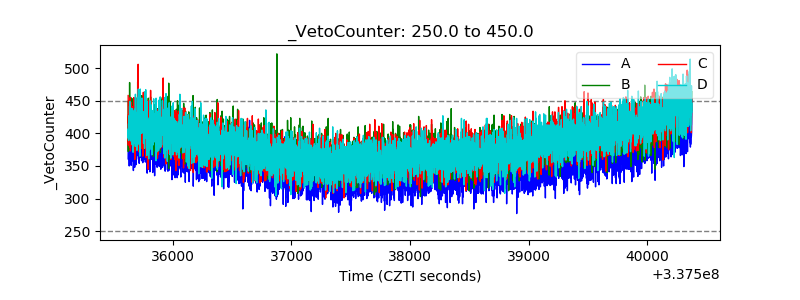 |