| Param | Original file | Final file |
|---|---|---|
| Filename | modeM0/AS1A09_079T01_9000003864_26801cztM0_level2.evt | modeM0/AS1A09_079T01_9000003864_26801cztM0_level2_quad_clean.evt |
| Size (bytes) | 1,048,129,920 | 230,958,720 |
| Size | 999.6 MB | 220.3 MB |
| Events in quadrant A | 7,535,409 | 1,527,463 |
| Events in quadrant B | 6,645,958 | 1,562,218 |
| Events in quadrant C | 6,614,194 | 1,516,782 |
| Events in quadrant D | 10,040,502 | 1,462,183 |
| Mode M9 | |||
|---|---|---|---|
| Quadrant | BADHDUFLAG | Total packets | Discarded packets |
| A | 0 | 19 | 0 |
| B | 0 | 19 | 0 |
| C | 0 | 19 | 0 |
| D | 0 | 19 | 0 |
| Mode M0 | |||
|---|---|---|---|
| Quadrant | BADHDUFLAG | Total packets | Discarded packets |
| A | 0 | 31150 | 0 |
| B | 0 | 28343 | 0 |
| C | 0 | 28158 | 0 |
| D | 0 | 38892 | 0 |
| Quadrant | Total seconds | Saturated seconds | Saturation percentage |
|---|---|---|---|
| A | 13417 | 147 | 1.095625% |
| B | 13417 | 186 | 1.386301% |
| C | 13417 | 186 | 1.386301% |
| D | 13417 | 1034 | 7.706641% |
Noise dominated data is calculated using 1-second bins in cleaned event files. If a bin has >2000 counts, and if more than 50% of those come from <1% of pixels, then it is considered to be noise-dominated and hence unusable.
| Quadrant | # 1 sec bins | Bins with >0 counts | Bins with >2000 counts | High rate bins dominated by noise | Noise dominated (total time) | Noise dominated (detector-on time) | Marked lightcurve |
|---|---|---|---|---|---|---|---|
| A | 15317 | 13420 | 3 | 3 | 0.02% | 0.02% | 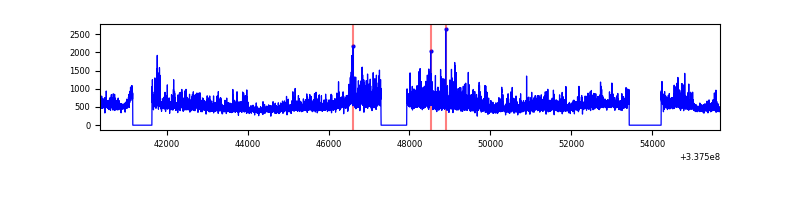 |
| B | 15317 | 13420 | 33 | 33 | 0.22% | 0.25% | 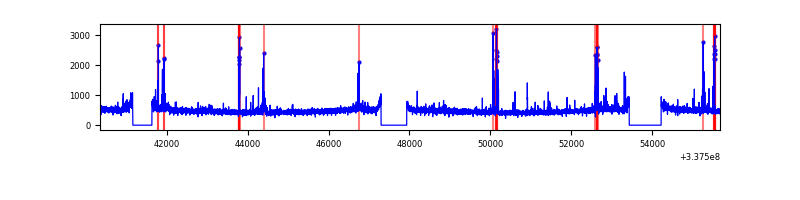 |
| C | 15317 | 13420 | 24 | 24 | 0.16% | 0.18% | 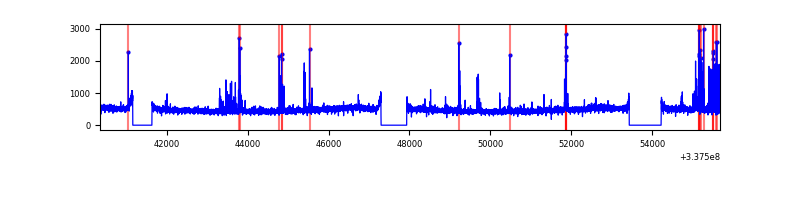 |
| D | 15317 | 13420 | 851 | 851 | 5.56% | 6.34% | 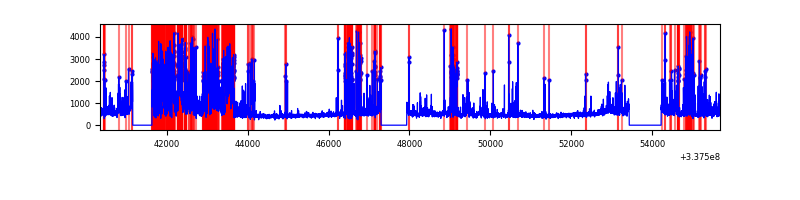 |
Top three noisy pixels from each quadrant. If the there are fewer than three noisy pixels in the level2.evt file, extra rows are filled as -1
| Pixel properties | Quadrant properties | ||||||
|---|---|---|---|---|---|---|---|
| Quadrant | DetID | PixID | Counts | Sigma | Mean | Median | Sigma |
| A | 0 | 13 | 1321163 | 4077.27 | 1610 | 1572 | 323.6 |
| A | 13 | 254 | 22276 | 63.97 | 1610 | 1572 | 323.6 |
| A | 3 | 137 | 15270 | 42.32 | 1610 | 1572 | 323.6 |
| B | 0 | 229 | 156674 | 515.05 | 1601 | 1559 | 301.2 |
| B | 10 | 246 | 95548 | 312.09 | 1601 | 1559 | 301.2 |
| B | 3 | 64 | 51571 | 166.06 | 1601 | 1559 | 301.2 |
| C | 15 | 208 | 281967 | 774.35 | 1553 | 1564 | 362.1 |
| C | 14 | 238 | 248006 | 680.56 | 1553 | 1564 | 362.1 |
| C | 2 | 16 | 17036 | 42.73 | 1553 | 1564 | 362.1 |
| D | 1 | 52 | 2661243 | 7309.28 | 1522 | 1485 | 363.9 |
| D | 7 | 80 | 1029824 | 2825.98 | 1522 | 1485 | 363.9 |
| D | 2 | 250 | 497220 | 1362.33 | 1522 | 1485 | 363.9 |
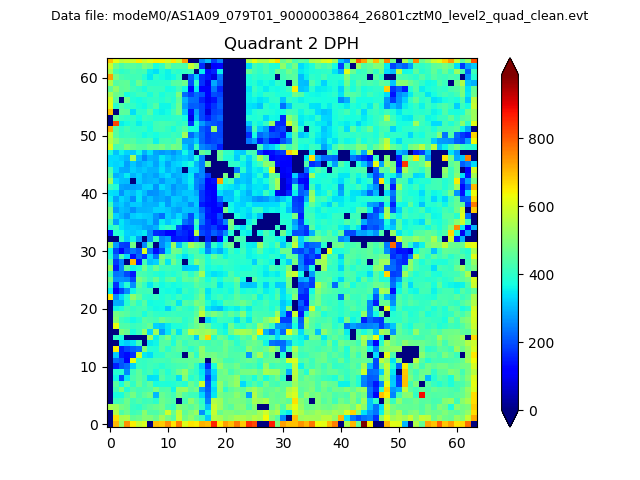
Histogram calculated using DETX and DETY for each event in the final _common_clean file
| Quadrant A | 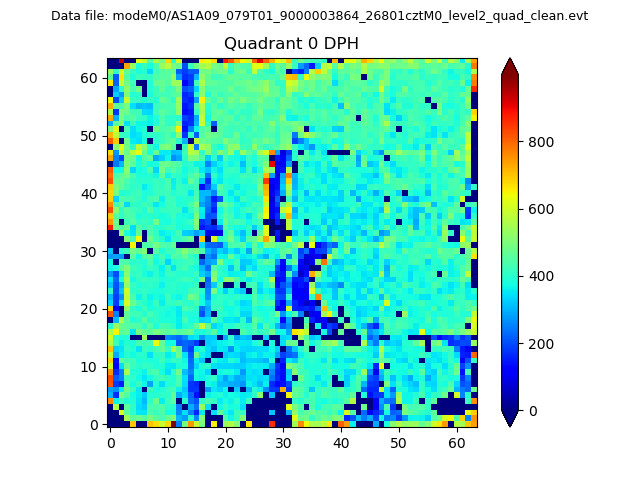 |
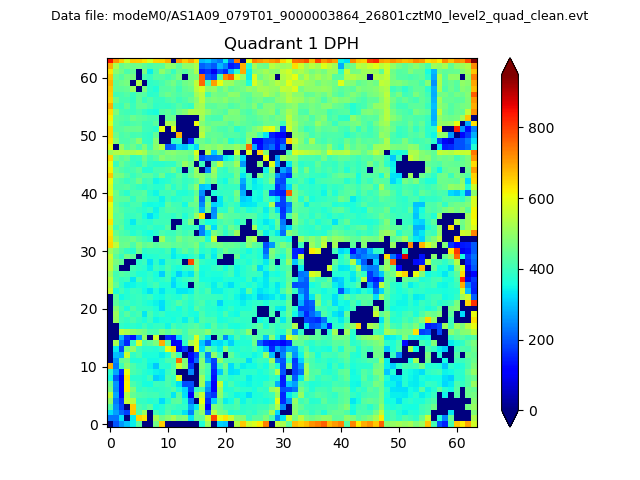 |
Quadrant B |
|---|---|---|---|
| Quadrant D | 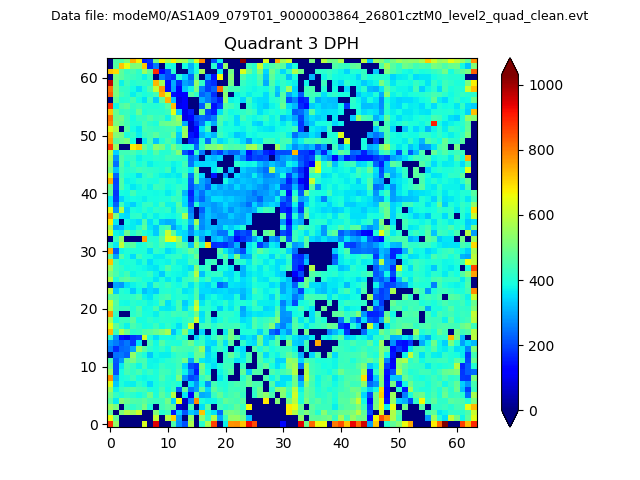 |
 |
Quadrant C |
| Plot type | Count rate plots | Images |
|---|---|---|
| Comparison with Poisson distribution Blue bars denote a histogram of data divided into 1 sec bins. Red curve is a Poisson curve with rate = median count rate of data. |
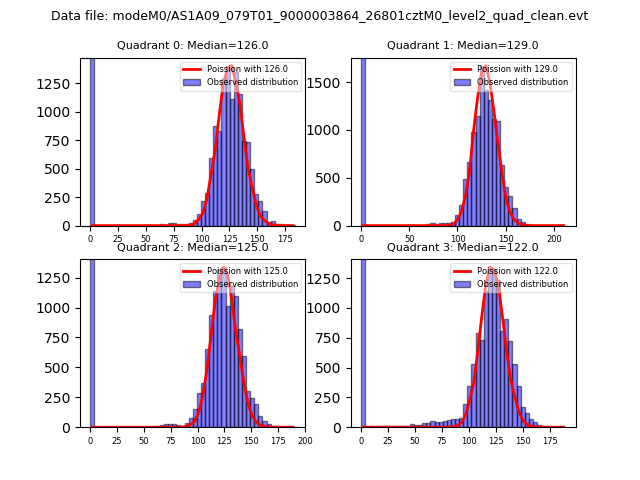 |
 |
| Quadrant-wise count rates Data is divided into 100 sec bins |
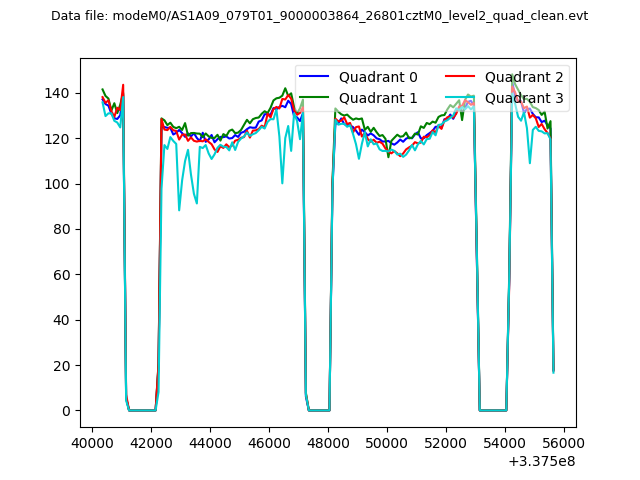 |
|
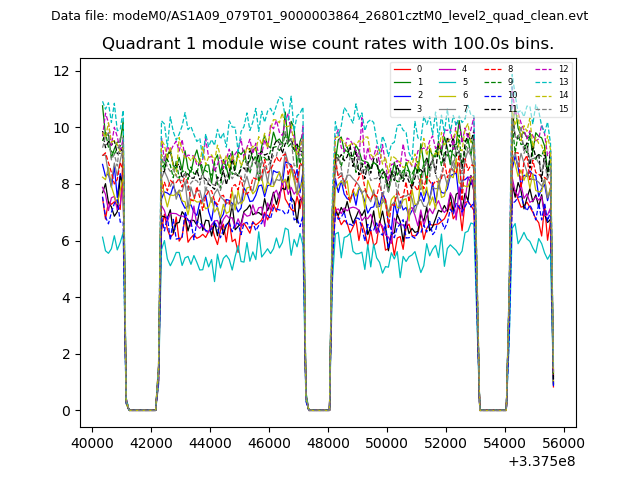
| Module-wise count rates for Quadrant A Data is divided into 100 sec bins |
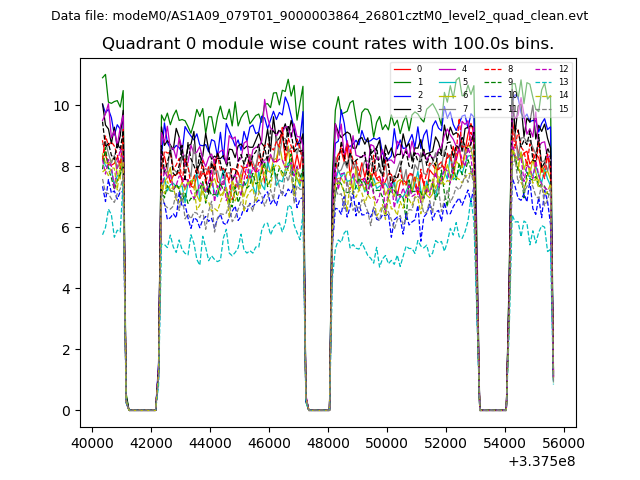 |
 |
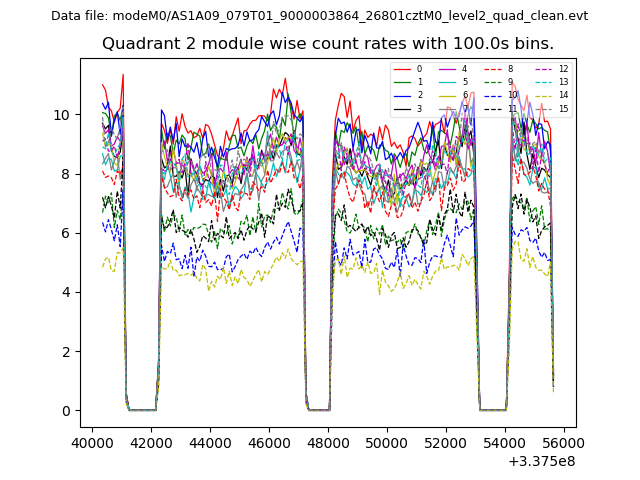
| Module-wise count rates for Quadrant B Data is divided into 100 sec bins |
 |
 |
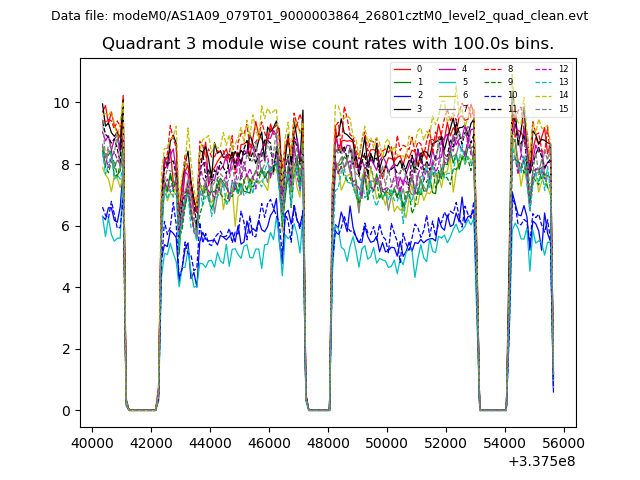
| Module-wise count rates for Quadrant C Data is divided into 100 sec bins |
 |
 |
| Module-wise count rates for Quadrant D Data is divided into 100 sec bins |
 |
 |
| Parameter | Plot |
|---|---|
| CZT HV Monitor | 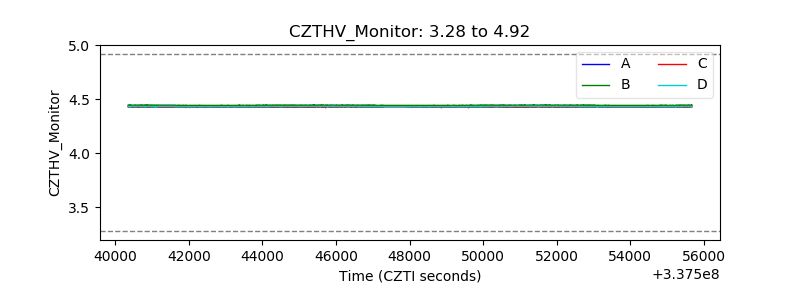 |
| D_VDD |  |
| Temperature 1 | 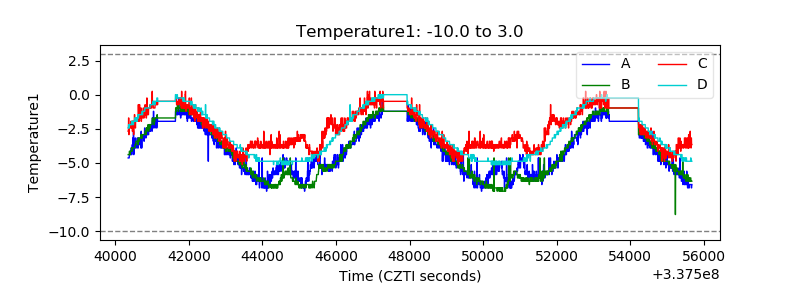 |
| Veto HV Monitor |  |
| Veto LLD | 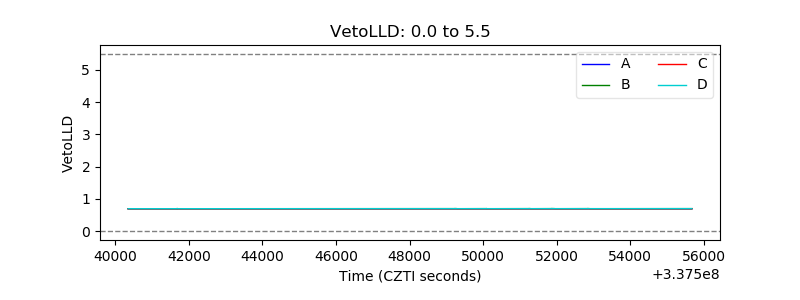 |
| Alpha Counter | 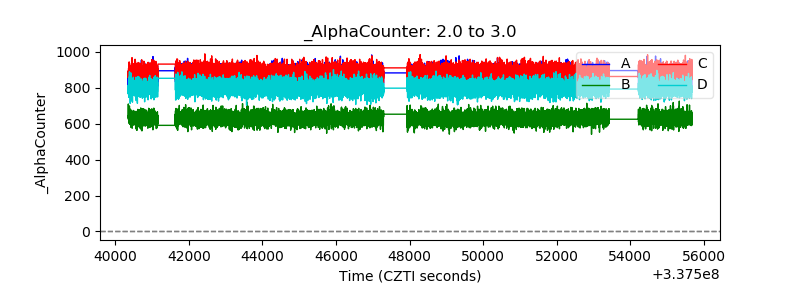 |
| _CPM_Rate |  |
| CZT Counter | 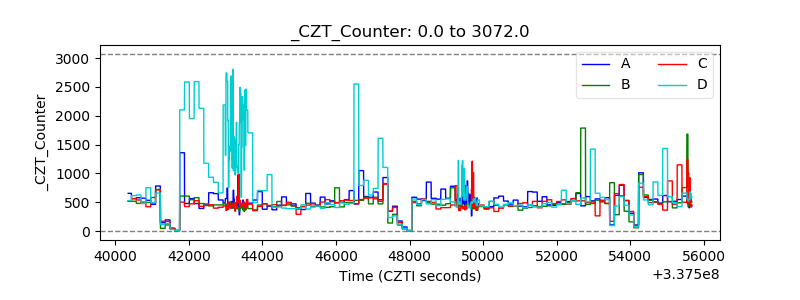 |
| +2.5 Volts monitor |  |
| +5 Volts monitor |  |
| _ROLL_ROT | 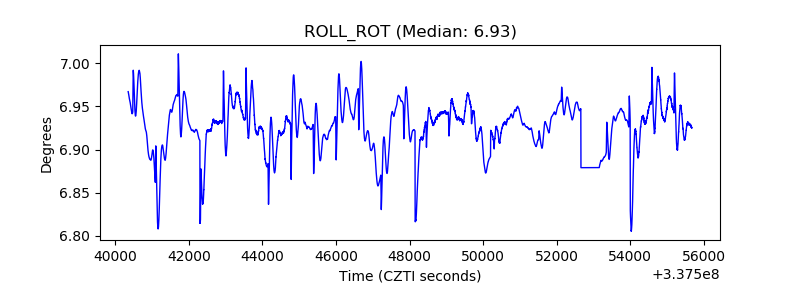 |
| _Roll_DEC | 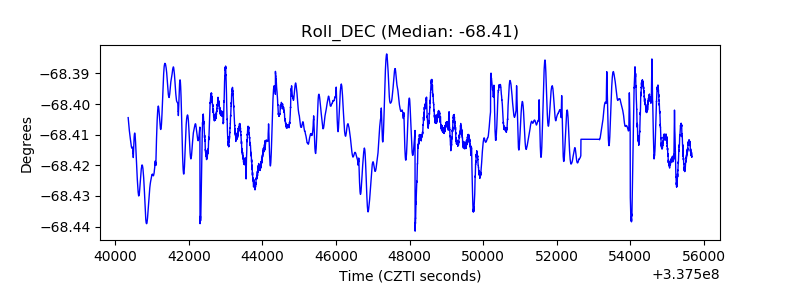 |
| _Roll_RA |  |
| Veto Counter | 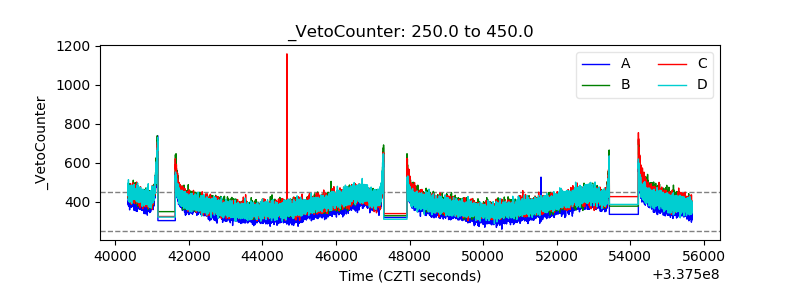 |