| Param | Original file | Final file |
|---|---|---|
| Filename | modeM0/AS1A09_079T01_9000003864_26802cztM0_level2.evt | modeM0/AS1A09_079T01_9000003864_26802cztM0_level2_quad_clean.evt |
| Size (bytes) | 507,916,800 | 117,596,160 |
| Size | 484.4 MB | 112.1 MB |
| Events in quadrant A | 3,410,702 | 779,146 |
| Events in quadrant B | 3,405,169 | 799,759 |
| Events in quadrant C | 3,535,738 | 770,077 |
| Events in quadrant D | 4,580,666 | 750,199 |
| Mode M9 | |||
|---|---|---|---|
| Quadrant | BADHDUFLAG | Total packets | Discarded packets |
| A | 0 | 11 | 0 |
| B | 0 | 12 | 0 |
| C | 0 | 12 | 0 |
| D | 0 | 12 | 0 |
| Mode M0 | |||
|---|---|---|---|
| Quadrant | BADHDUFLAG | Total packets | Discarded packets |
| A | 0 | 14550 | 0 |
| B | 0 | 14352 | 0 |
| C | 0 | 14671 | 0 |
| D | 0 | 18021 | 0 |
| Quadrant | Total seconds | Saturated seconds | Saturation percentage |
|---|---|---|---|
| A | 6629 | 52 | 0.784432% |
| B | 6629 | 80 | 1.206819% |
| C | 6628 | 128 | 1.931201% |
| D | 6628 | 244 | 3.681352% |
Noise dominated data is calculated using 1-second bins in cleaned event files. If a bin has >2000 counts, and if more than 50% of those come from <1% of pixels, then it is considered to be noise-dominated and hence unusable.
| Quadrant | # 1 sec bins | Bins with >0 counts | Bins with >2000 counts | High rate bins dominated by noise | Noise dominated (total time) | Noise dominated (detector-on time) | Marked lightcurve |
|---|---|---|---|---|---|---|---|
| A | 7604 | 6630 | 1 | 1 | 0.01% | 0.02% | 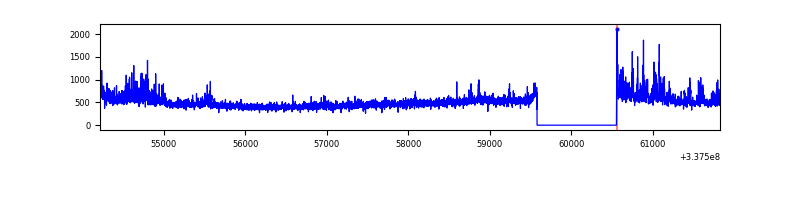 |
| B | 7604 | 6629 | 15 | 15 | 0.20% | 0.23% | 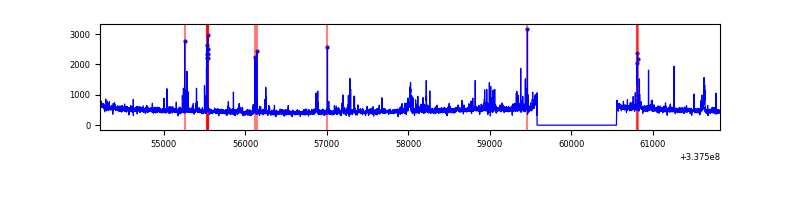 |
| C | 7603 | 6629 | 36 | 36 | 0.47% | 0.54% | 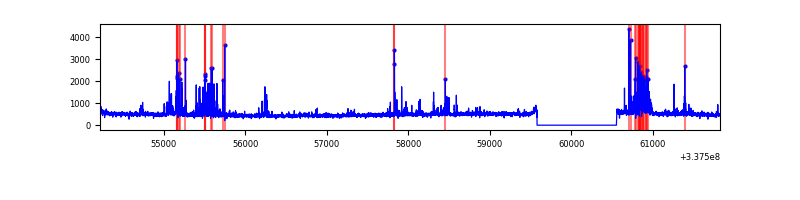 |
| D | 7603 | 6629 | 200 | 200 | 2.63% | 3.02% | 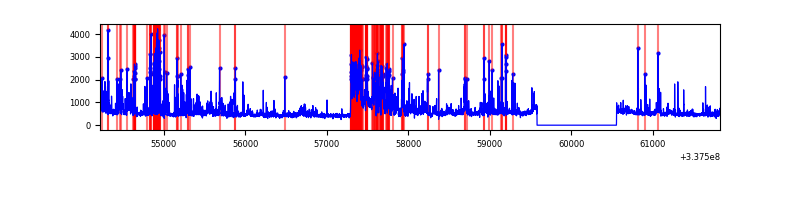 |
Top three noisy pixels from each quadrant. If the there are fewer than three noisy pixels in the level2.evt file, extra rows are filled as -1
| Pixel properties | Quadrant properties | ||||||
|---|---|---|---|---|---|---|---|
| Quadrant | DetID | PixID | Counts | Sigma | Mean | Median | Sigma |
| A | 0 | 13 | 330166 | 2038.95 | 798 | 782 | 161.5 |
| A | 13 | 254 | 10450 | 59.85 | 798 | 782 | 161.5 |
| A | 3 | 137 | 7586 | 42.12 | 798 | 782 | 161.5 |
| B | 0 | 229 | 101725 | 663.57 | 800 | 779 | 152.1 |
| B | 0 | 189 | 64764 | 420.61 | 800 | 779 | 152.1 |
| B | 10 | 246 | 51381 | 332.63 | 800 | 779 | 152.1 |
| C | 15 | 208 | 354438 | 1944.17 | 774 | 778 | 181.9 |
| C | 14 | 238 | 123908 | 676.88 | 774 | 778 | 181.9 |
| C | 14 | 176 | 24650 | 131.23 | 774 | 778 | 181.9 |
| D | 7 | 80 | 1320812 | 7179.49 | 772 | 754 | 183.9 |
| D | 2 | 250 | 181985 | 985.67 | 772 | 754 | 183.9 |
| D | 1 | 52 | 95306 | 514.25 | 772 | 754 | 183.9 |
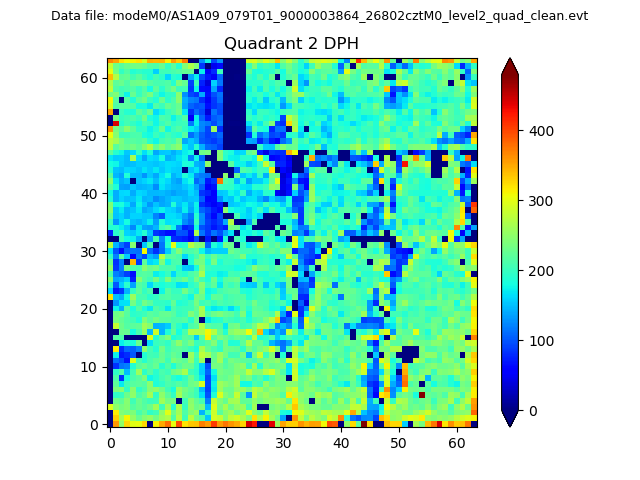
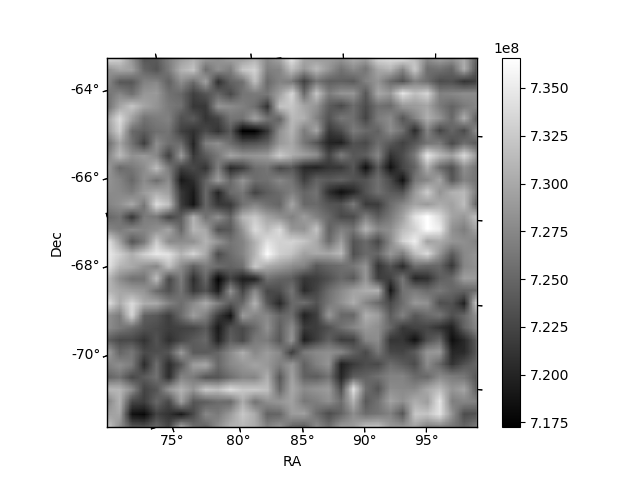
Histogram calculated using DETX and DETY for each event in the final _common_clean file
| Quadrant A | 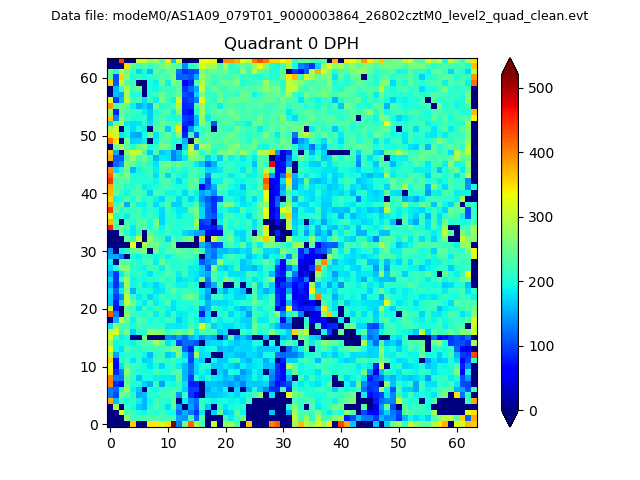 |
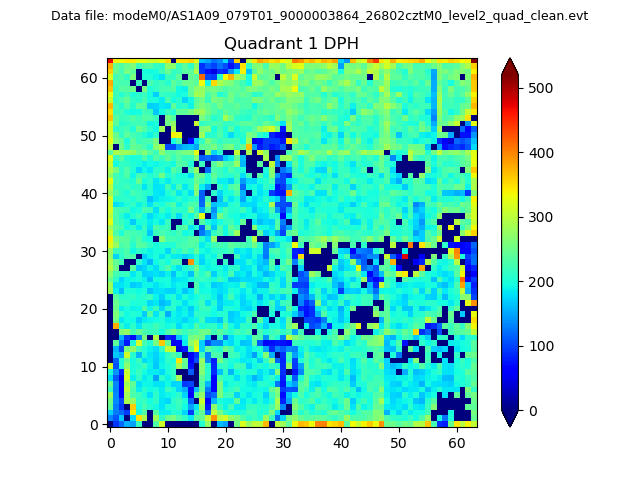 |
Quadrant B |
|---|---|---|---|
| Quadrant D | 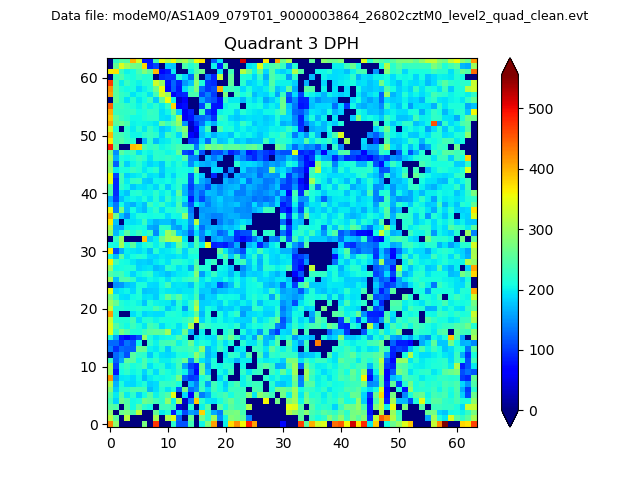 |
 |
Quadrant C |
| Plot type | Count rate plots | Images |
|---|---|---|
| Comparison with Poisson distribution Blue bars denote a histogram of data divided into 1 sec bins. Red curve is a Poisson curve with rate = median count rate of data. |
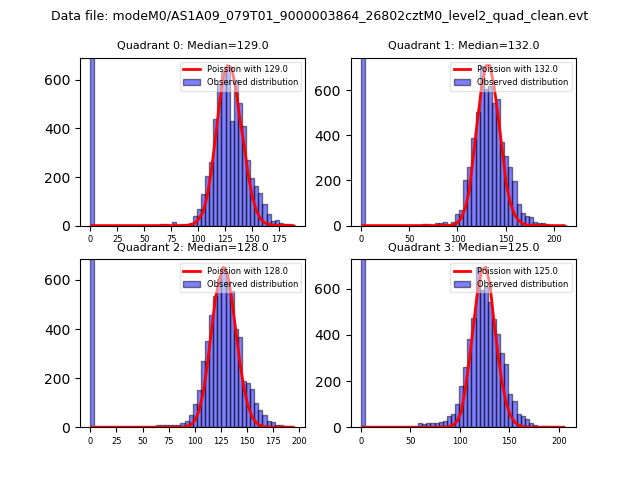 |
 |
| Quadrant-wise count rates Data is divided into 100 sec bins |
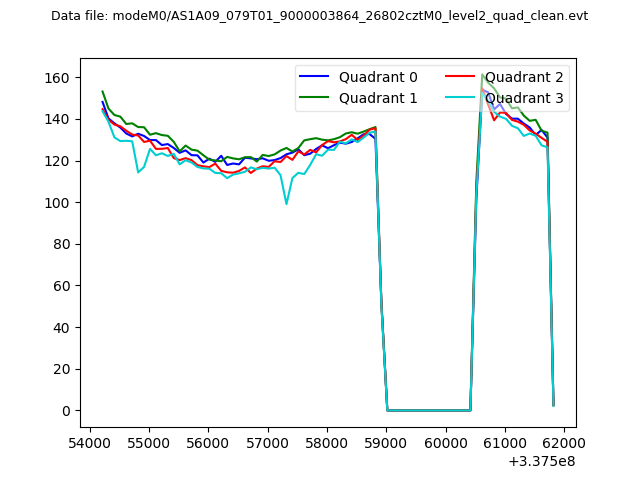 |
|
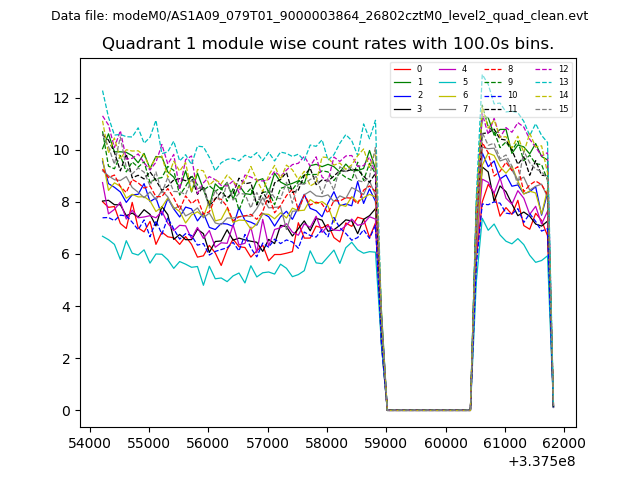
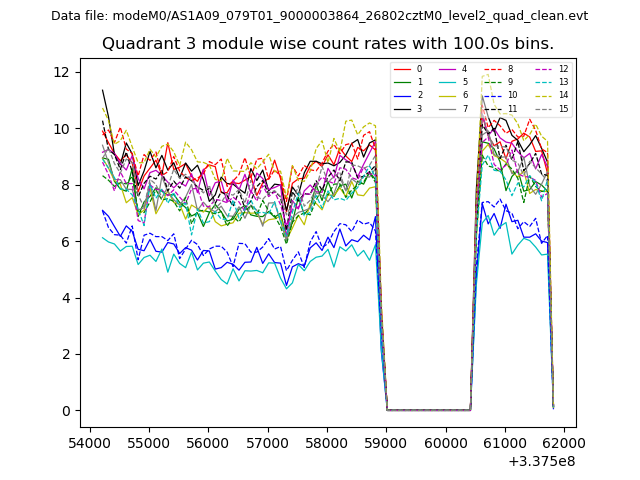
| Module-wise count rates for Quadrant A Data is divided into 100 sec bins |
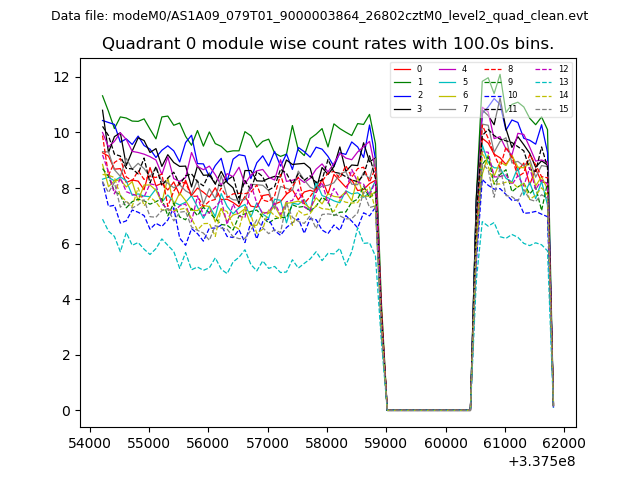 |
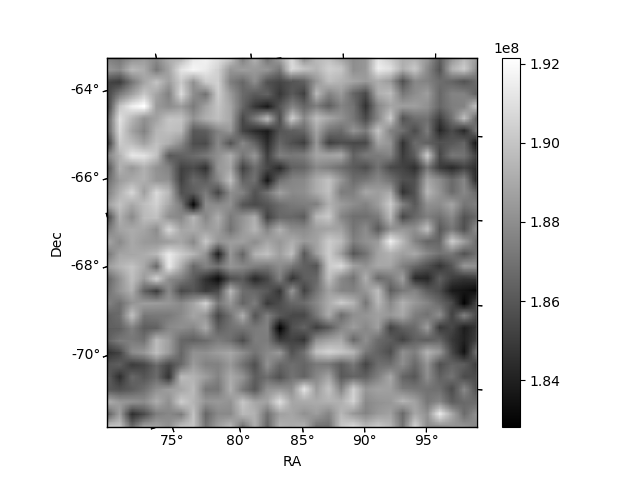 |
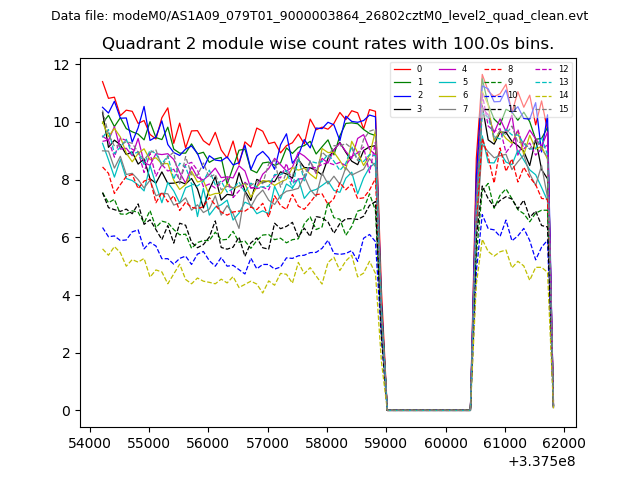
| Module-wise count rates for Quadrant B Data is divided into 100 sec bins |
 |
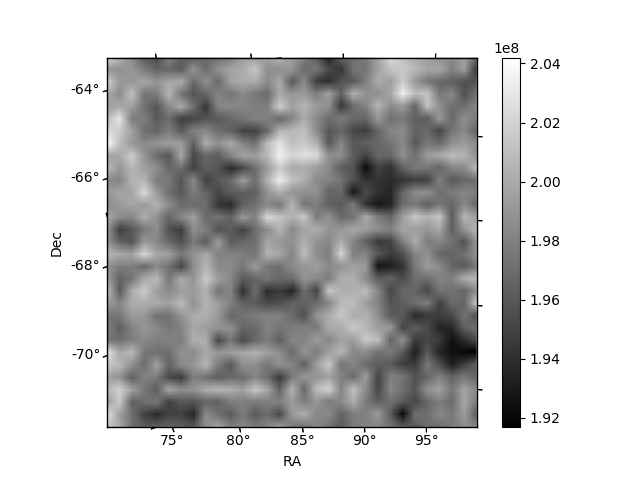 |
| Module-wise count rates for Quadrant C Data is divided into 100 sec bins |
 |
 |
| Module-wise count rates for Quadrant D Data is divided into 100 sec bins |
 |
 |
| Parameter | Plot |
|---|---|
| CZT HV Monitor | 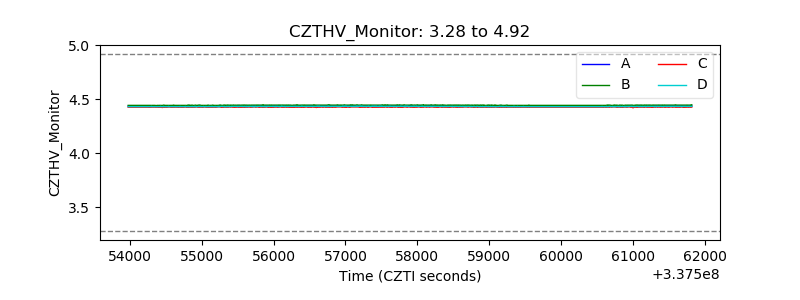 |
| D_VDD |  |
| Temperature 1 | 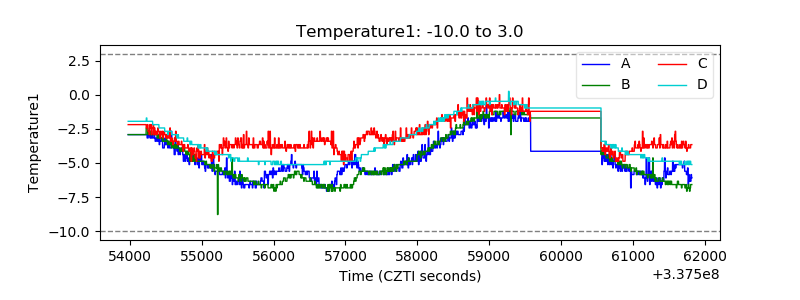 |
| Veto HV Monitor | 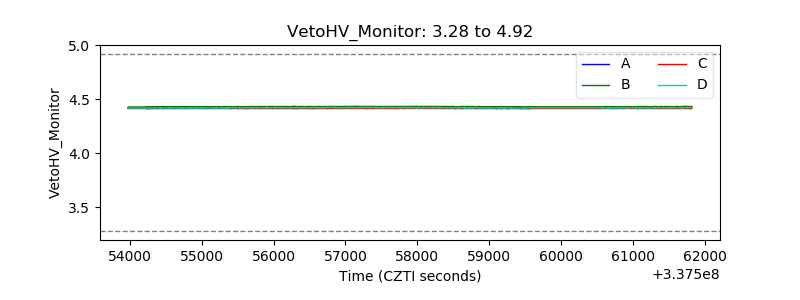 |
| Veto LLD | 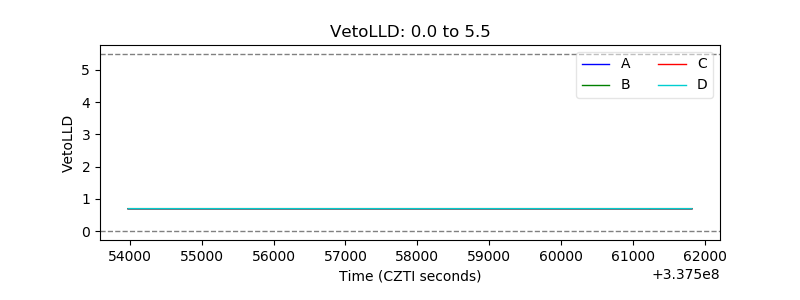 |
| Alpha Counter | 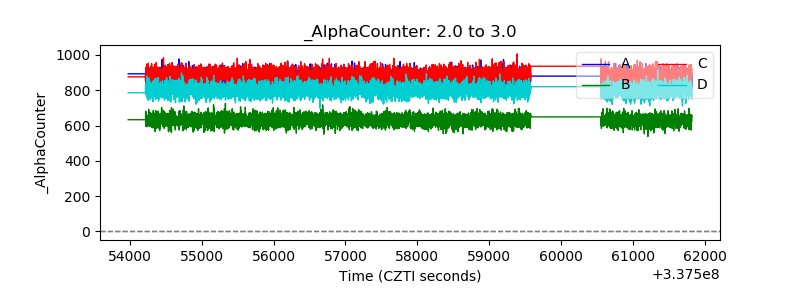 |
| _CPM_Rate | 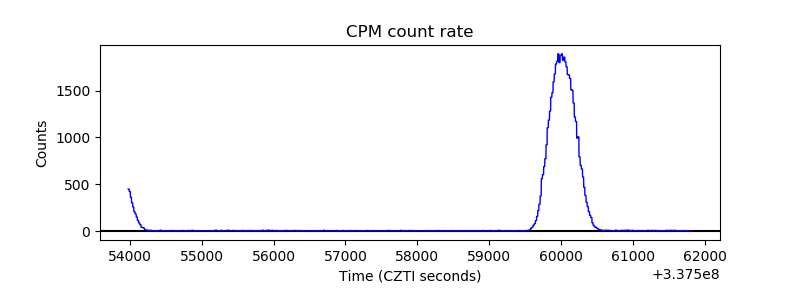 |
| CZT Counter | 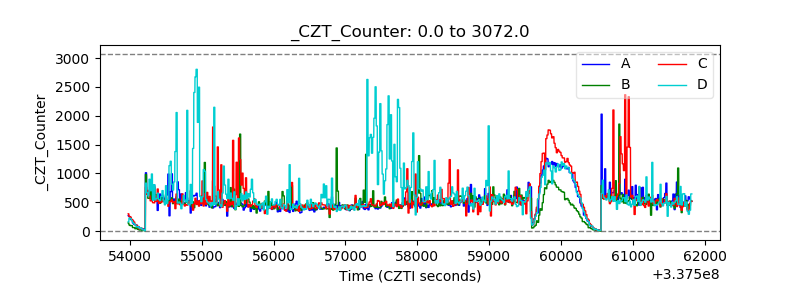 |
| +2.5 Volts monitor |  |
| +5 Volts monitor |  |
| _ROLL_ROT | 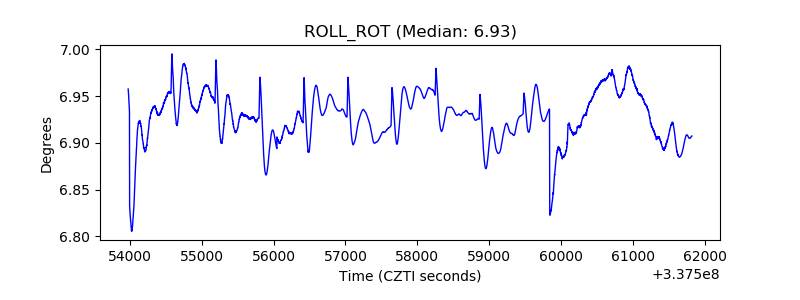 |
| _Roll_DEC | 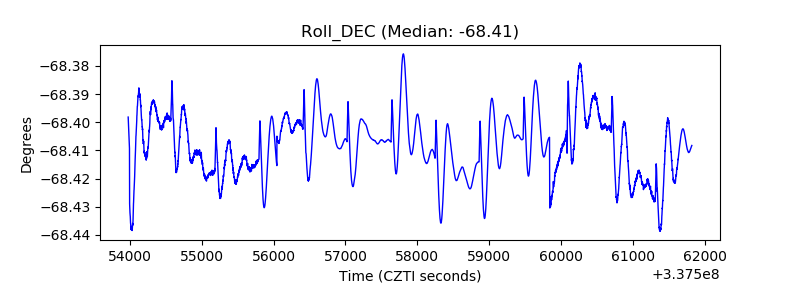 |
| _Roll_RA |  |
| Veto Counter | 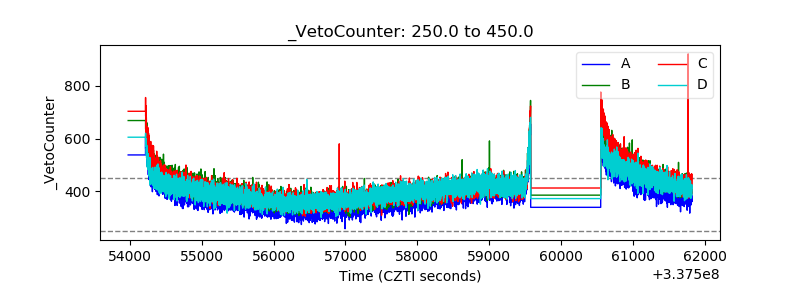 |