| Param | Original file | Final file |
|---|---|---|
| Filename | modeM0/AS1A09_079T01_9000003864_26804cztM0_level2.evt | modeM0/AS1A09_079T01_9000003864_26804cztM0_level2_quad_clean.evt |
| Size (bytes) | 499,340,160 | 119,854,080 |
| Size | 476.2 MB | 114.3 MB |
| Events in quadrant A | 4,140,581 | 783,904 |
| Events in quadrant B | 3,556,538 | 813,120 |
| Events in quadrant C | 3,531,925 | 788,250 |
| Events in quadrant D | 3,435,719 | 774,593 |
| Mode M9 | |||
|---|---|---|---|
| Quadrant | BADHDUFLAG | Total packets | Discarded packets |
| A | 0 | 20 | 0 |
| B | 0 | 20 | 0 |
| C | 0 | 20 | 0 |
| D | 0 | 20 | 0 |
| Mode M0 | |||
|---|---|---|---|
| Quadrant | BADHDUFLAG | Total packets | Discarded packets |
| A | 0 | 16898 | 0 |
| B | 0 | 14895 | 0 |
| C | 0 | 14688 | 0 |
| D | 0 | 14697 | 0 |
| Quadrant | Total seconds | Saturated seconds | Saturation percentage |
|---|---|---|---|
| A | 6743 | 62 | 0.919472% |
| B | 6744 | 109 | 1.616251% |
| C | 6743 | 125 | 1.853774% |
| D | 6743 | 56 | 0.830491% |
Noise dominated data is calculated using 1-second bins in cleaned event files. If a bin has >2000 counts, and if more than 50% of those come from <1% of pixels, then it is considered to be noise-dominated and hence unusable.
| Quadrant | # 1 sec bins | Bins with >0 counts | Bins with >2000 counts | High rate bins dominated by noise | Noise dominated (total time) | Noise dominated (detector-on time) | Marked lightcurve |
|---|---|---|---|---|---|---|---|
| A | 8843 | 6745 | 5 | 5 | 0.06% | 0.07% | 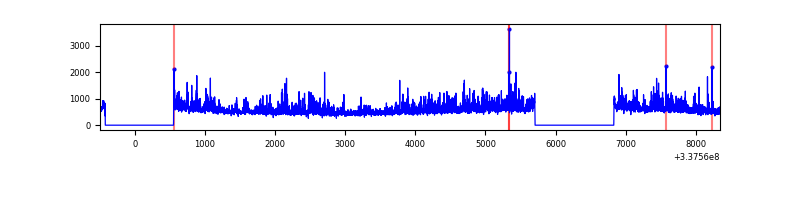 |
| B | 8844 | 6745 | 21 | 21 | 0.24% | 0.31% | 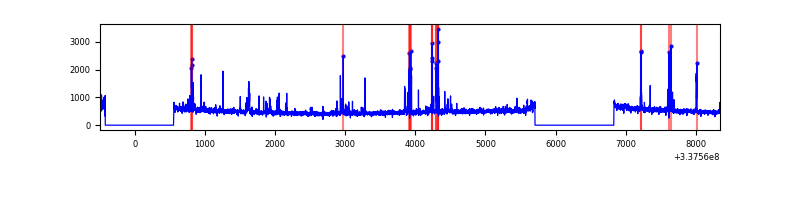 |
| C | 8843 | 6745 | 24 | 24 | 0.27% | 0.36% |  |
| D | 8843 | 6745 | 15 | 15 | 0.17% | 0.22% | 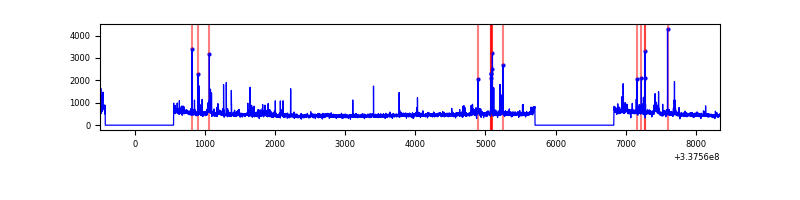 |
Top three noisy pixels from each quadrant. If the there are fewer than three noisy pixels in the level2.evt file, extra rows are filled as -1
| Pixel properties | Quadrant properties | ||||||
|---|---|---|---|---|---|---|---|
| Quadrant | DetID | PixID | Counts | Sigma | Mean | Median | Sigma |
| A | 0 | 13 | 932763 | 5606.78 | 829 | 813 | 166.2 |
| A | 13 | 254 | 10665 | 59.27 | 829 | 813 | 166.2 |
| A | 12 | 96 | 8184 | 44.35 | 829 | 813 | 166.2 |
| B | 0 | 229 | 192668 | 1223.09 | 836 | 815 | 156.9 |
| B | 0 | 189 | 37369 | 233.04 | 836 | 815 | 156.9 |
| B | 10 | 246 | 27421 | 169.62 | 836 | 815 | 156.9 |
| C | 15 | 208 | 193507 | 1020.35 | 817 | 822 | 188.8 |
| C | 14 | 238 | 132028 | 694.79 | 817 | 822 | 188.8 |
| C | 8 | 128 | 12665 | 62.71 | 817 | 822 | 188.8 |
| D | 2 | 250 | 82029 | 422.31 | 818 | 799 | 192.3 |
| D | 15 | 21 | 81914 | 421.71 | 818 | 799 | 192.3 |
| D | 1 | 52 | 73600 | 378.49 | 818 | 799 | 192.3 |
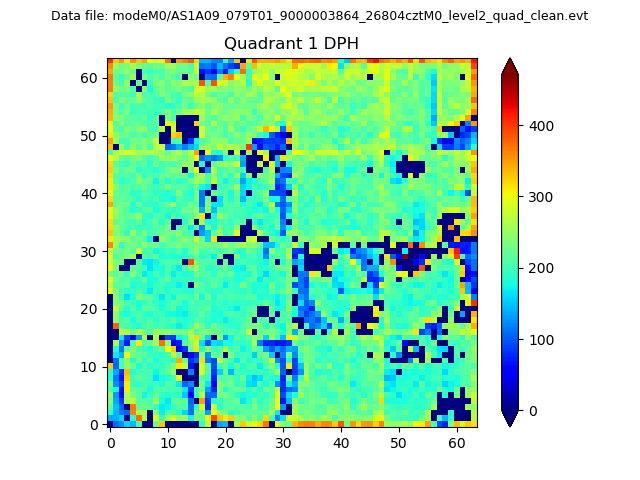
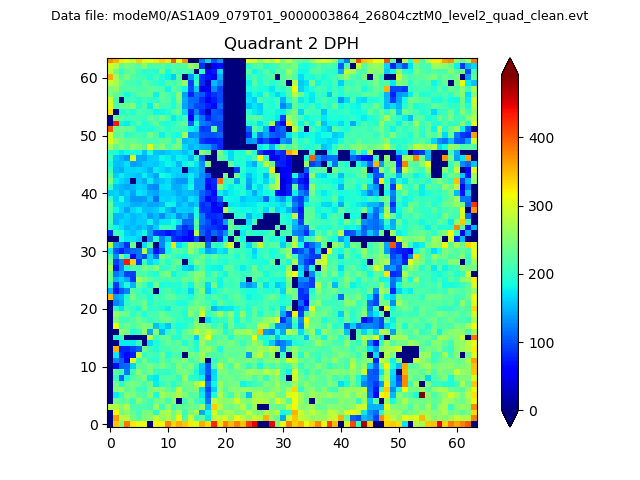
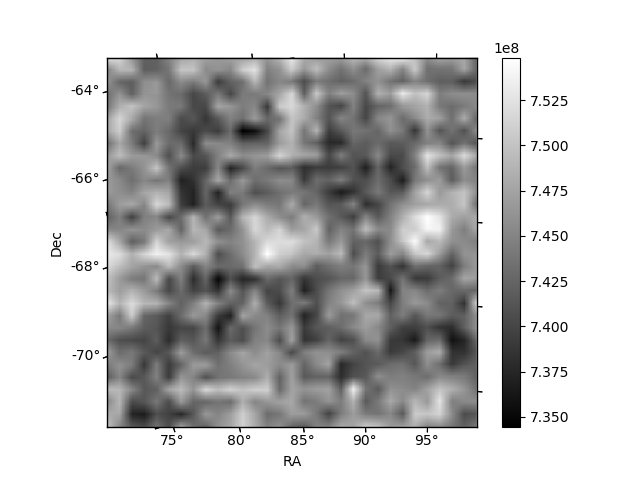
Histogram calculated using DETX and DETY for each event in the final _common_clean file
| Quadrant A | 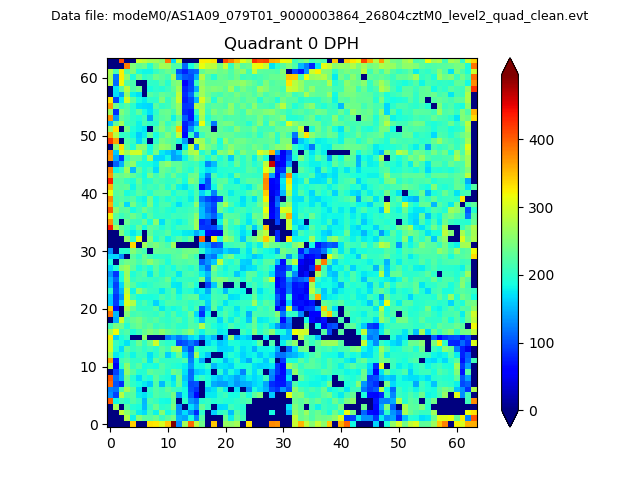 |
 |
Quadrant B |
|---|---|---|---|
| Quadrant D | 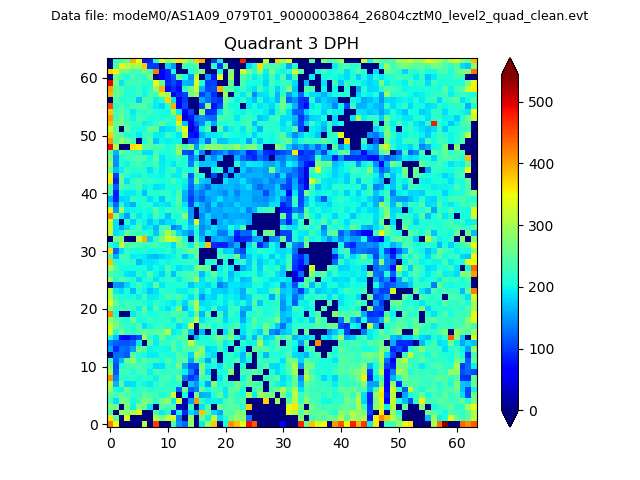 |
 |
Quadrant C |
| Plot type | Count rate plots | Images |
|---|---|---|
| Comparison with Poisson distribution Blue bars denote a histogram of data divided into 1 sec bins. Red curve is a Poisson curve with rate = median count rate of data. |
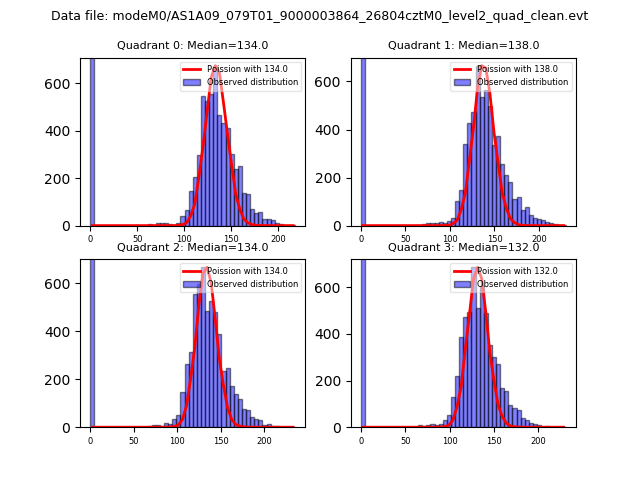 |
 |
| Quadrant-wise count rates Data is divided into 100 sec bins |
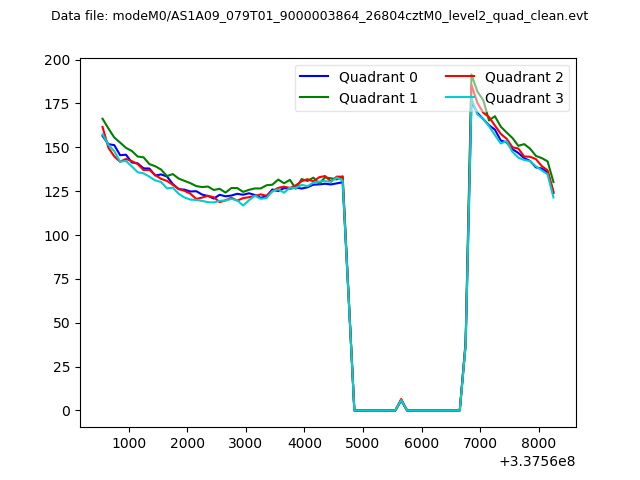 |
|
| Module-wise count rates for Quadrant A Data is divided into 100 sec bins |
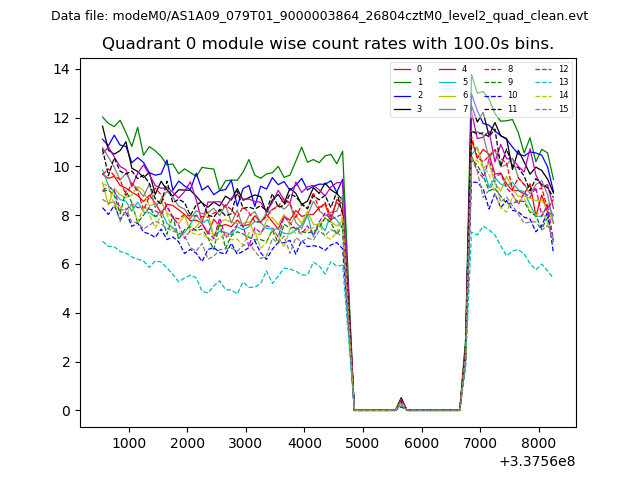 |
 |
| Module-wise count rates for Quadrant B Data is divided into 100 sec bins |
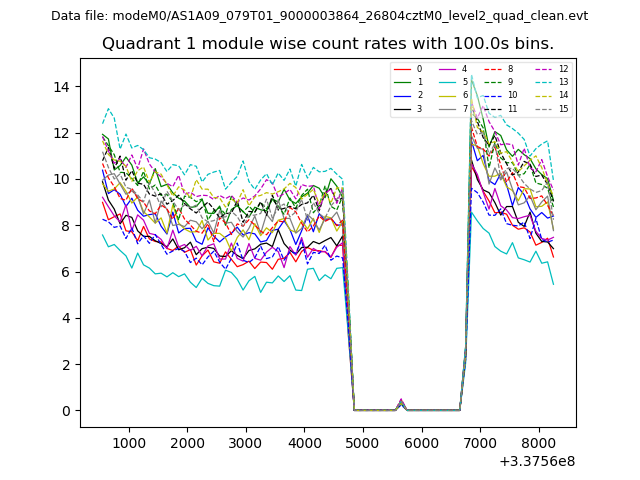 |
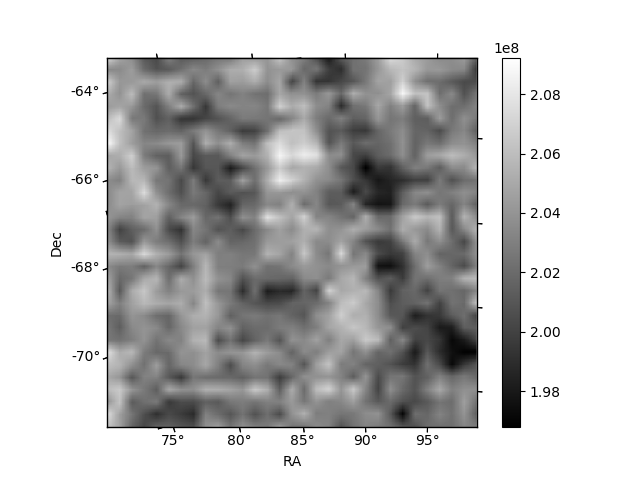 |
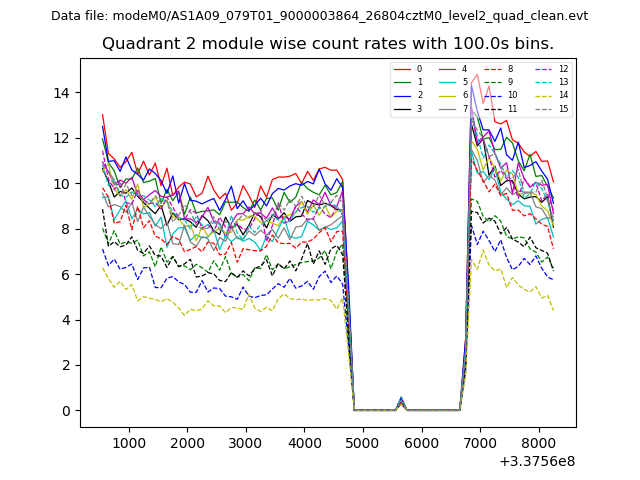
| Module-wise count rates for Quadrant C Data is divided into 100 sec bins |
 |
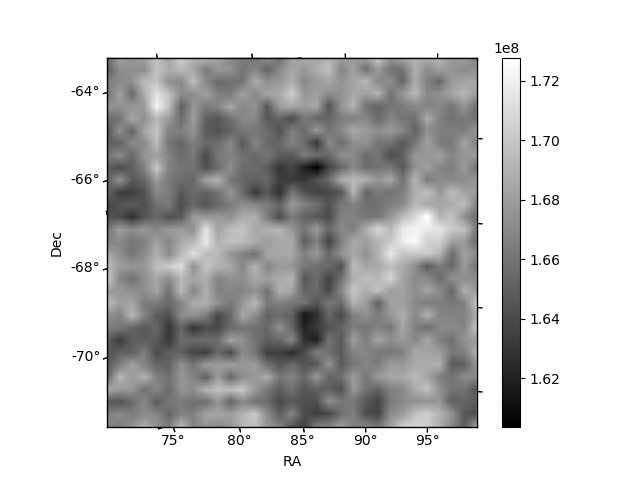 |
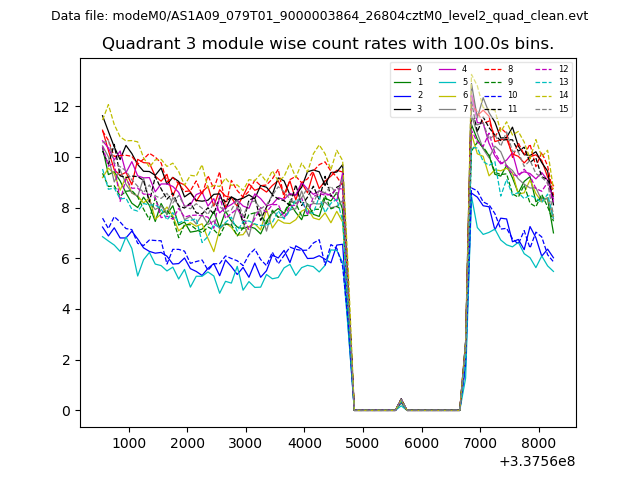
| Module-wise count rates for Quadrant D Data is divided into 100 sec bins |
 |
 |
| Parameter | Plot |
|---|---|
| CZT HV Monitor | 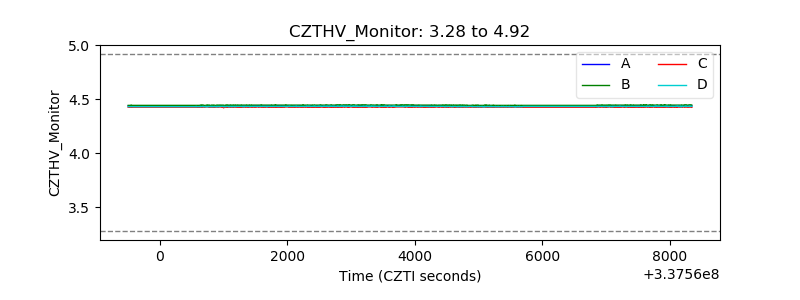 |
| D_VDD | 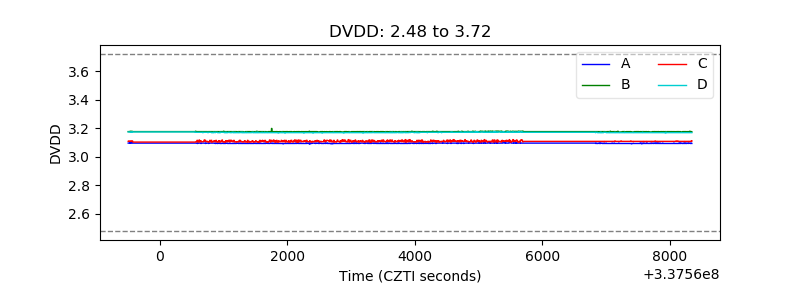 |
| Temperature 1 | 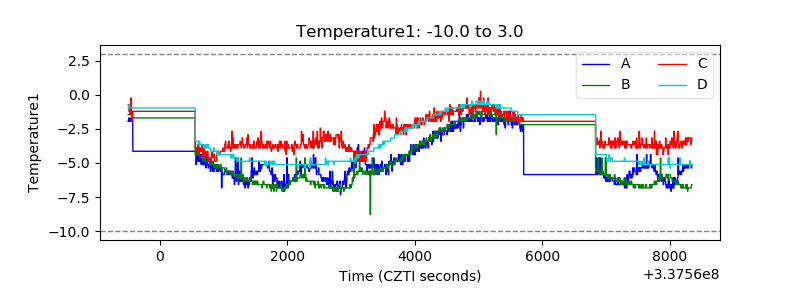 |
| Veto HV Monitor | 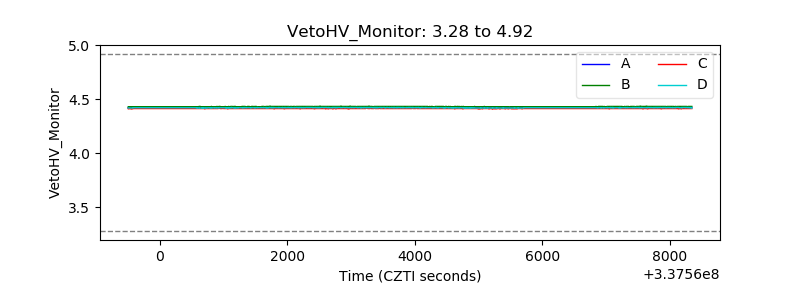 |
| Veto LLD | 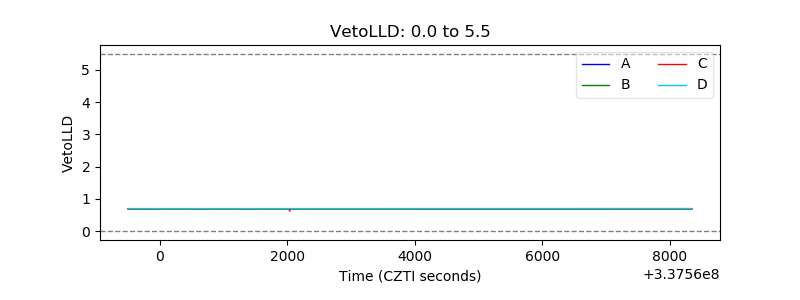 |
| Alpha Counter | 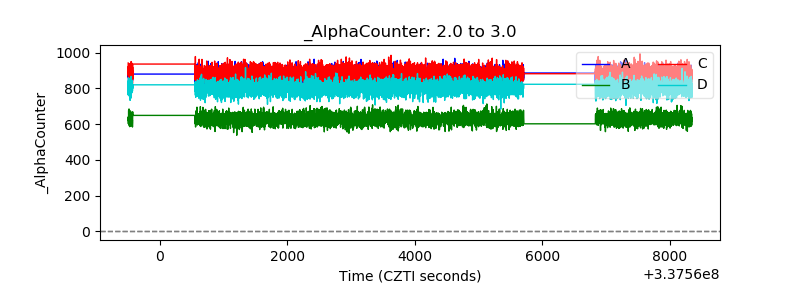 |
| _CPM_Rate | 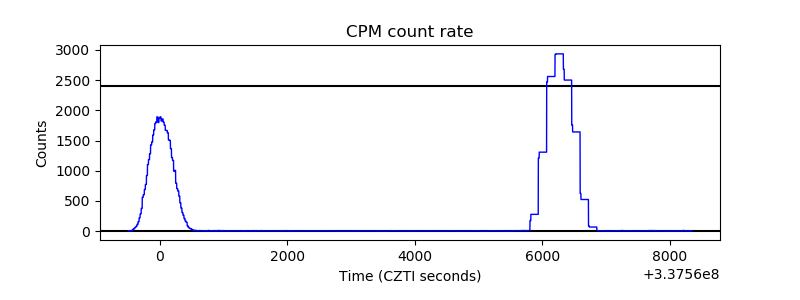 |
| CZT Counter | 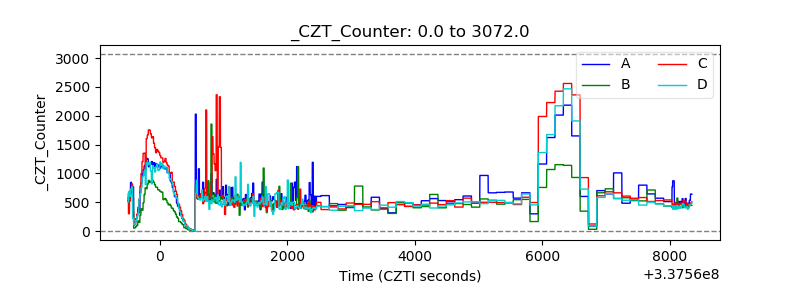 |
| +2.5 Volts monitor |  |
| +5 Volts monitor | 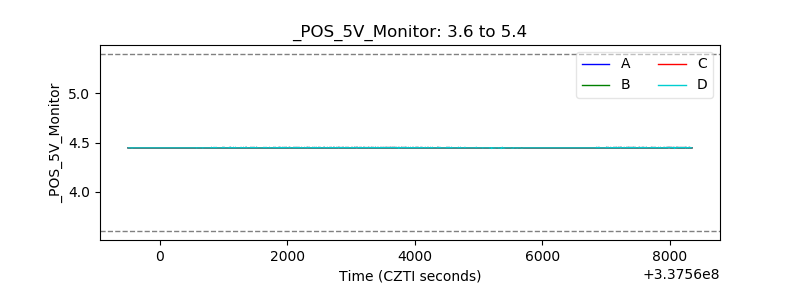 |
| _ROLL_ROT | 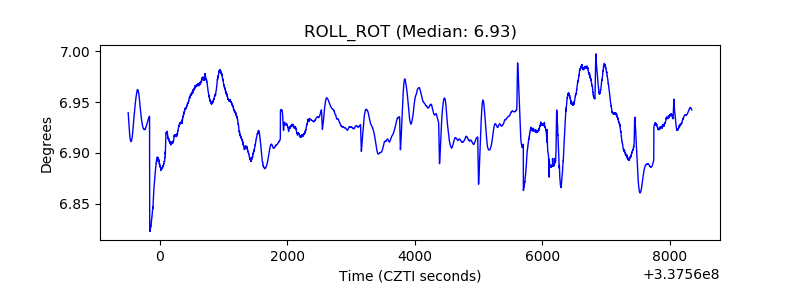 |
| _Roll_DEC | 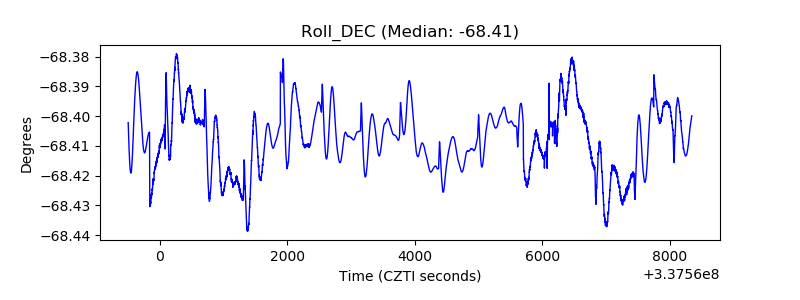 |
| _Roll_RA | 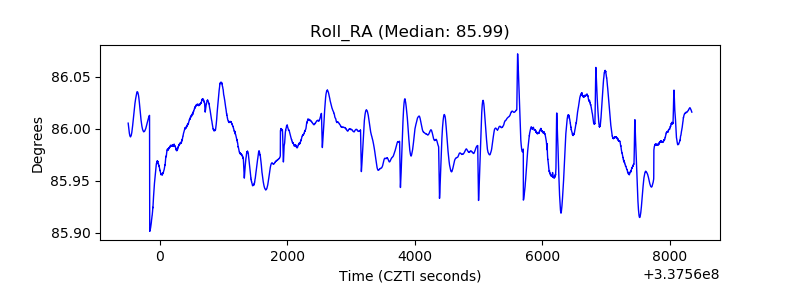 |
| Veto Counter | 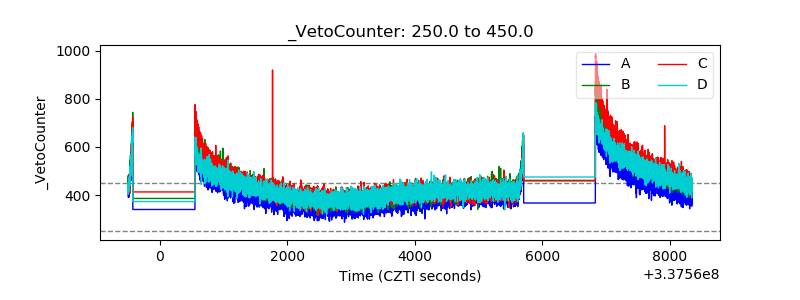 |