| Param | Original file | Final file |
|---|---|---|
| Filename | modeM0/AS1A09_079T01_9000003864_26805cztM0_level2.evt | modeM0/AS1A09_079T01_9000003864_26805cztM0_level2_quad_clean.evt |
| Size (bytes) | 489,173,760 | 121,291,200 |
| Size | 466.5 MB | 115.7 MB |
| Events in quadrant A | 3,976,857 | 795,778 |
| Events in quadrant B | 3,547,527 | 830,201 |
| Events in quadrant C | 3,512,638 | 811,366 |
| Events in quadrant D | 3,349,469 | 795,954 |
| Mode M9 | |||
|---|---|---|---|
| Quadrant | BADHDUFLAG | Total packets | Discarded packets |
| A | 0 | 19 | 0 |
| B | 0 | 20 | 0 |
| C | 0 | 20 | 0 |
| D | 0 | 20 | 0 |
| Mode M0 | |||
|---|---|---|---|
| Quadrant | BADHDUFLAG | Total packets | Discarded packets |
| A | 0 | 16150 | 0 |
| B | 0 | 14638 | 0 |
| C | 0 | 14310 | 0 |
| D | 0 | 14113 | 0 |
| Quadrant | Total seconds | Saturated seconds | Saturation percentage |
|---|---|---|---|
| A | 6313 | 34 | 0.538571% |
| B | 6312 | 66 | 1.045627% |
| C | 6312 | 118 | 1.869455% |
| D | 6312 | 42 | 0.665399% |
Noise dominated data is calculated using 1-second bins in cleaned event files. If a bin has >2000 counts, and if more than 50% of those come from <1% of pixels, then it is considered to be noise-dominated and hence unusable.
| Quadrant | # 1 sec bins | Bins with >0 counts | Bins with >2000 counts | High rate bins dominated by noise | Noise dominated (total time) | Noise dominated (detector-on time) | Marked lightcurve |
|---|---|---|---|---|---|---|---|
| A | 7558 | 6314 | 3 | 3 | 0.04% | 0.05% | 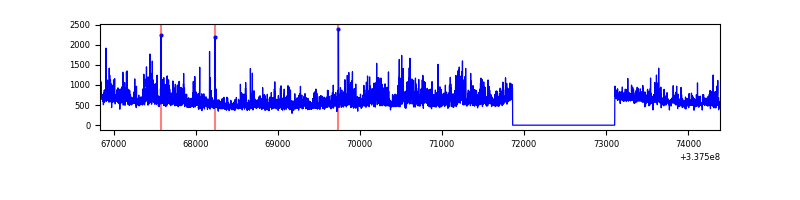 |
| B | 7557 | 6313 | 7 | 7 | 0.09% | 0.11% | 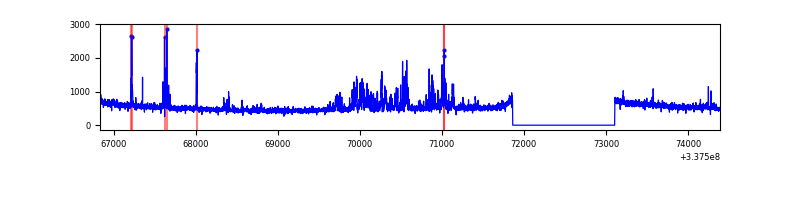 |
| C | 7557 | 6313 | 17 | 17 | 0.22% | 0.27% | 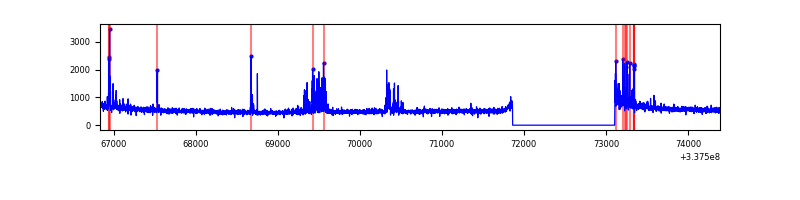 |
| D | 7557 | 6313 | 19 | 19 | 0.25% | 0.30% | 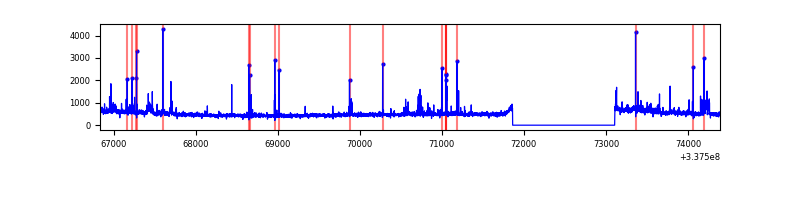 |
Top three noisy pixels from each quadrant. If the there are fewer than three noisy pixels in the level2.evt file, extra rows are filled as -1
| Pixel properties | Quadrant properties | ||||||
|---|---|---|---|---|---|---|---|
| Quadrant | DetID | PixID | Counts | Sigma | Mean | Median | Sigma |
| A | 0 | 13 | 827098 | 5181.97 | 807 | 794 | 159.5 |
| A | 12 | 96 | 33466 | 204.89 | 807 | 794 | 159.5 |
| A | 13 | 254 | 10143 | 58.63 | 807 | 794 | 159.5 |
| B | 0 | 189 | 233092 | 1543.21 | 813 | 793 | 150.5 |
| B | 0 | 229 | 85879 | 565.24 | 813 | 793 | 150.5 |
| B | 10 | 246 | 17902 | 113.66 | 813 | 793 | 150.5 |
| C | 15 | 208 | 243909 | 1300.82 | 805 | 811 | 186.9 |
| C | 14 | 238 | 130938 | 696.31 | 805 | 811 | 186.9 |
| C | 13 | 61 | 5473 | 24.95 | 805 | 811 | 186.9 |
| D | 15 | 21 | 98017 | 511.11 | 805 | 787 | 190.2 |
| D | 1 | 52 | 74461 | 387.29 | 805 | 787 | 190.2 |
| D | 2 | 250 | 57492 | 298.08 | 805 | 787 | 190.2 |
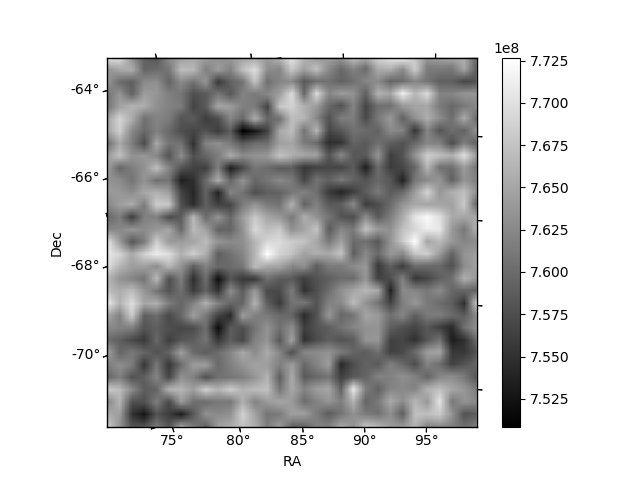
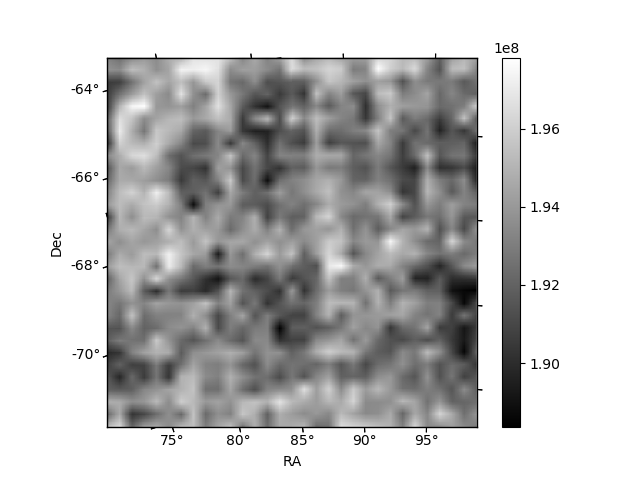
Histogram calculated using DETX and DETY for each event in the final _common_clean file
| Quadrant A | 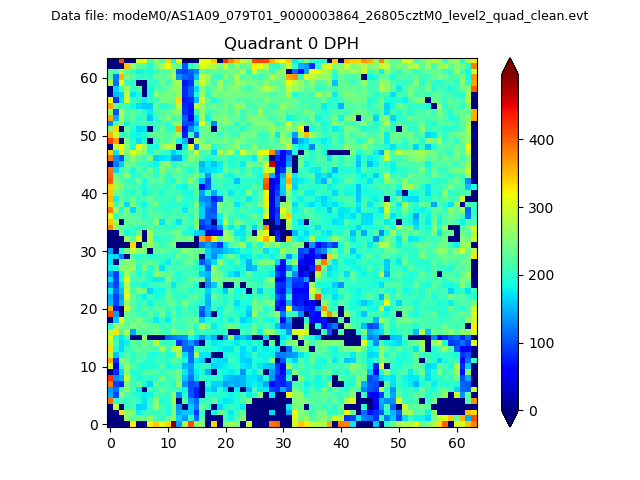 |
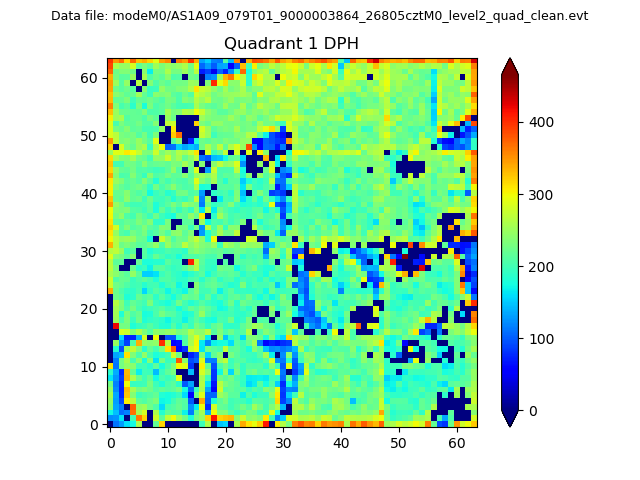 |
Quadrant B |
|---|---|---|---|
| Quadrant D | 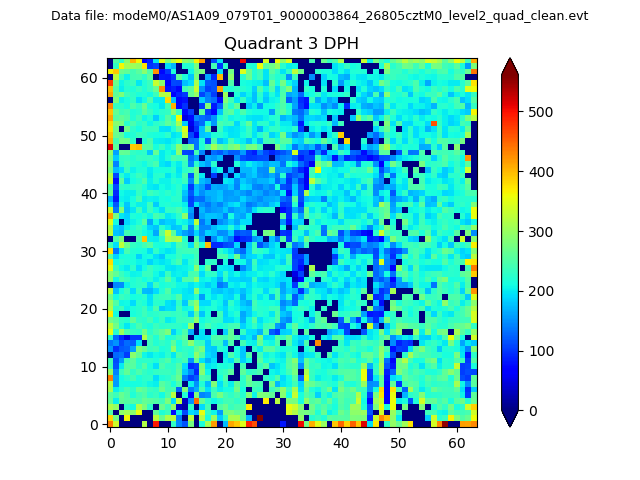 |
 |
Quadrant C |
| Plot type | Count rate plots | Images |
|---|---|---|
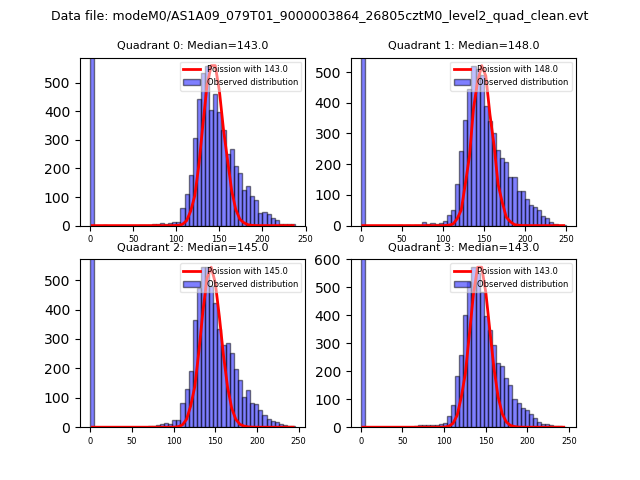
| Comparison with Poisson distribution Blue bars denote a histogram of data divided into 1 sec bins. Red curve is a Poisson curve with rate = median count rate of data. |
 |
 |
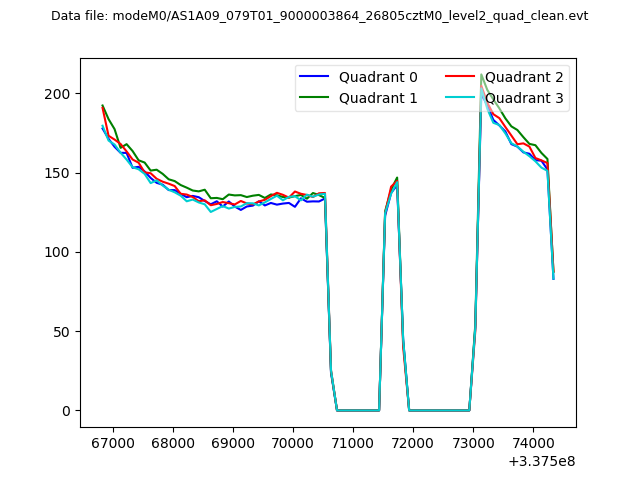
| Quadrant-wise count rates Data is divided into 100 sec bins |
 |
|
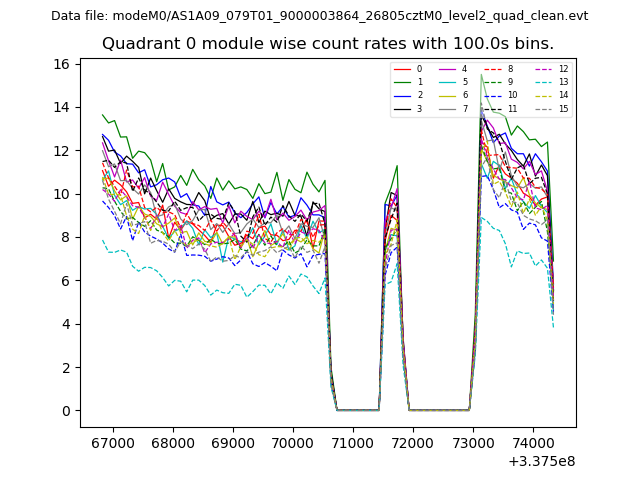
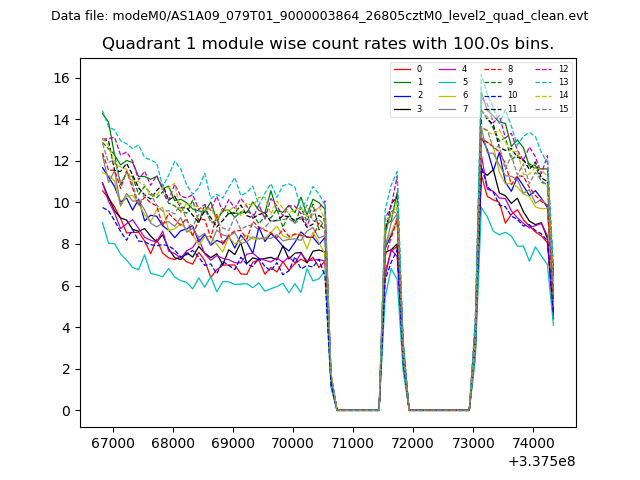
| Module-wise count rates for Quadrant A Data is divided into 100 sec bins |
 |
 |
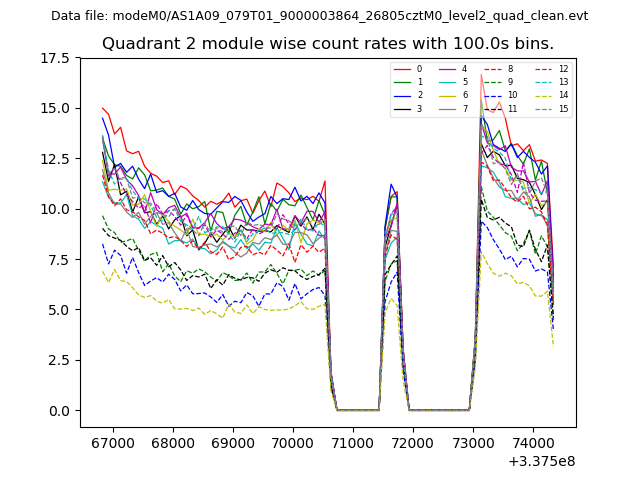
| Module-wise count rates for Quadrant B Data is divided into 100 sec bins |
 |
 |
| Module-wise count rates for Quadrant C Data is divided into 100 sec bins |
 |
 |
| Module-wise count rates for Quadrant D Data is divided into 100 sec bins |
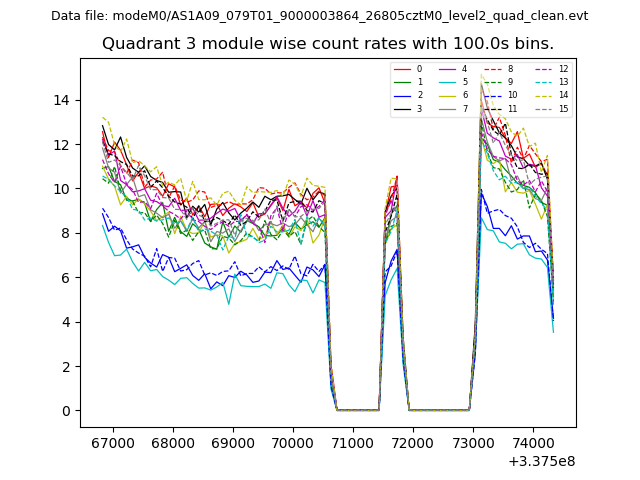 |
 |
| Parameter | Plot |
|---|---|
| CZT HV Monitor | 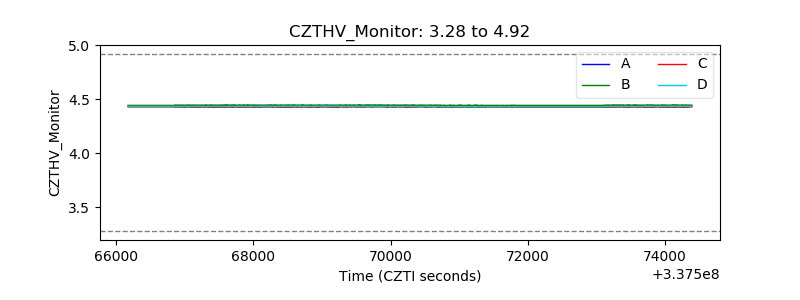 |
| D_VDD |  |
| Temperature 1 | 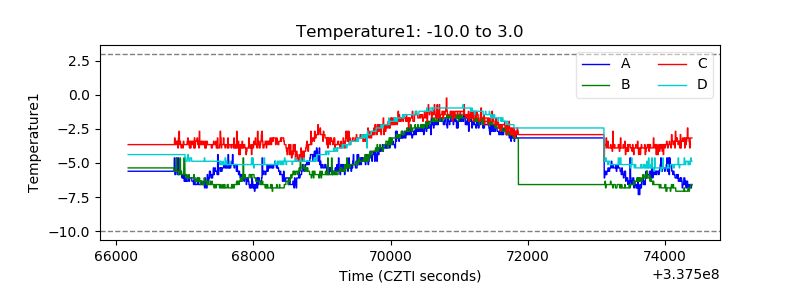 |
| Veto HV Monitor | 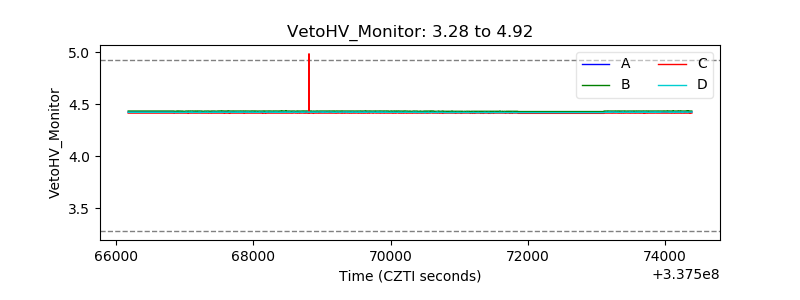 |
| Veto LLD | 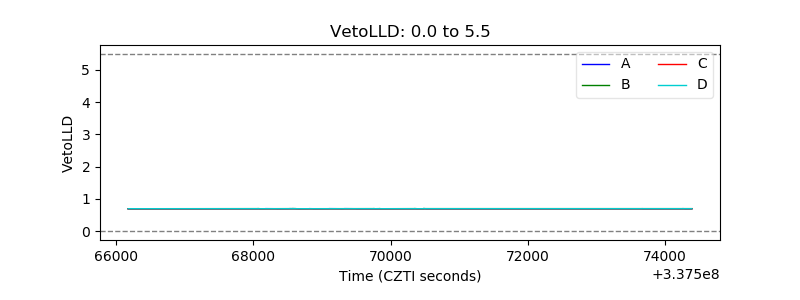 |
| Alpha Counter | 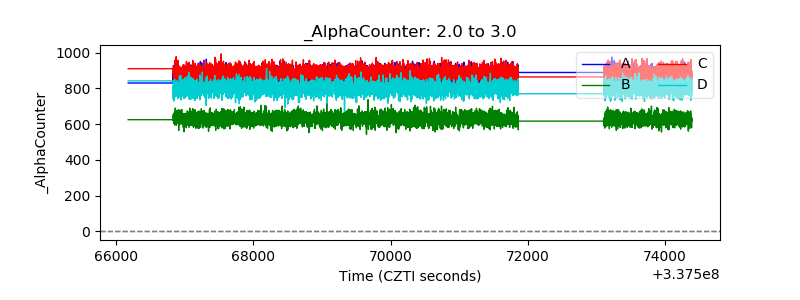 |
| _CPM_Rate | 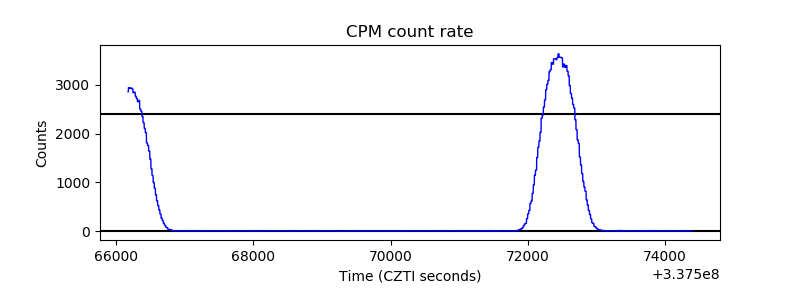 |
| CZT Counter |  |
| +2.5 Volts monitor |  |
| +5 Volts monitor |  |
| _ROLL_ROT | 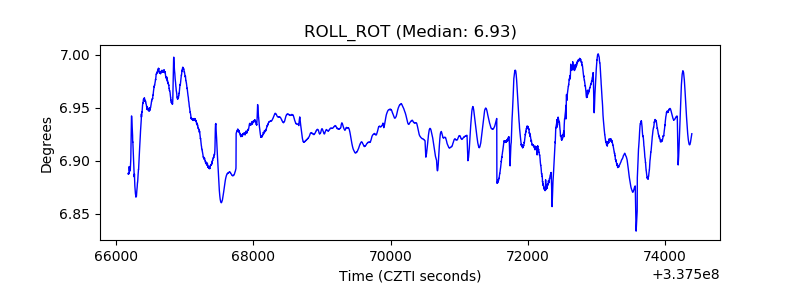 |
| _Roll_DEC | 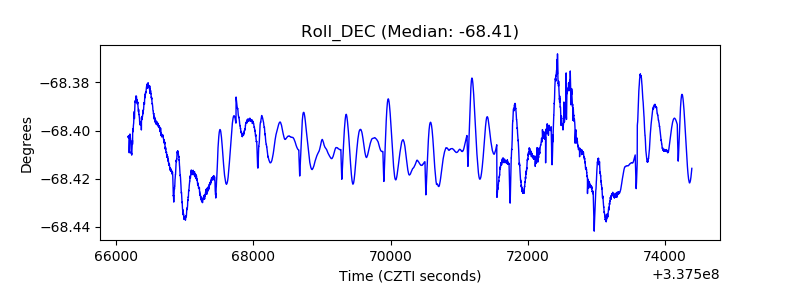 |
| _Roll_RA | 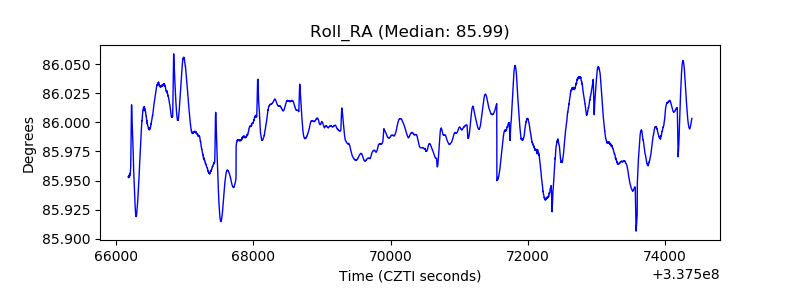 |
| Veto Counter | 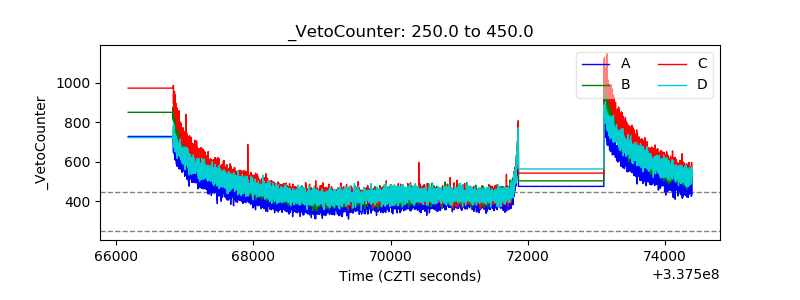 |