| Param | Original file | Final file |
|---|---|---|
| Filename | modeM0/AS1A09_079T01_9000003864_26806cztM0_level2.evt | modeM0/AS1A09_079T01_9000003864_26806cztM0_level2_quad_clean.evt |
| Size (bytes) | 499,944,960 | 129,360,960 |
| Size | 476.8 MB | 123.4 MB |
| Events in quadrant A | 3,982,535 | 852,759 |
| Events in quadrant B | 3,527,175 | 895,208 |
| Events in quadrant C | 3,573,321 | 875,252 |
| Events in quadrant D | 3,631,119 | 855,877 |
| Mode M9 | |||
|---|---|---|---|
| Quadrant | BADHDUFLAG | Total packets | Discarded packets |
| A | 0 | 17 | 0 |
| B | 0 | 18 | 0 |
| C | 0 | 18 | 0 |
| D | 0 | 18 | 0 |
| Mode M0 | |||
|---|---|---|---|
| Quadrant | BADHDUFLAG | Total packets | Discarded packets |
| A | 0 | 16091 | 0 |
| B | 0 | 14417 | 0 |
| C | 0 | 14474 | 0 |
| D | 0 | 14794 | 0 |
| Quadrant | Total seconds | Saturated seconds | Saturation percentage |
|---|---|---|---|
| A | 6293 | 22 | 0.349595% |
| B | 6293 | 77 | 1.223582% |
| C | 6293 | 107 | 1.700302% |
| D | 6292 | 50 | 0.794660% |
Noise dominated data is calculated using 1-second bins in cleaned event files. If a bin has >2000 counts, and if more than 50% of those come from <1% of pixels, then it is considered to be noise-dominated and hence unusable.
| Quadrant | # 1 sec bins | Bins with >0 counts | Bins with >2000 counts | High rate bins dominated by noise | Noise dominated (total time) | Noise dominated (detector-on time) | Marked lightcurve |
|---|---|---|---|---|---|---|---|
| A | 7623 | 6294 | 3 | 3 | 0.04% | 0.05% | 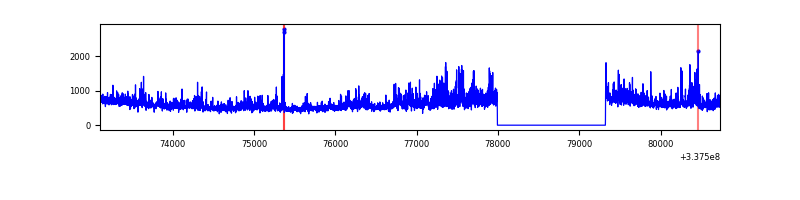 |
| B | 7623 | 6294 | 36 | 36 | 0.47% | 0.57% | 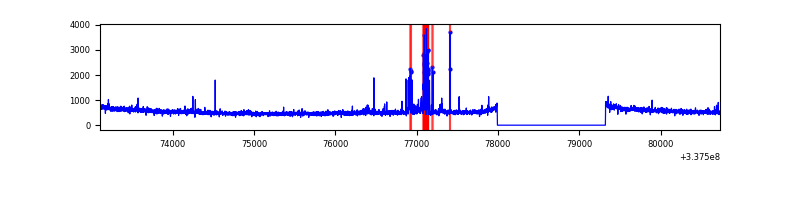 |
| C | 7623 | 6294 | 15 | 15 | 0.20% | 0.24% | 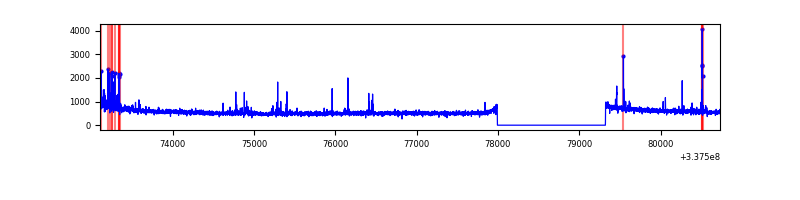 |
| D | 7622 | 6293 | 35 | 35 | 0.46% | 0.56% | 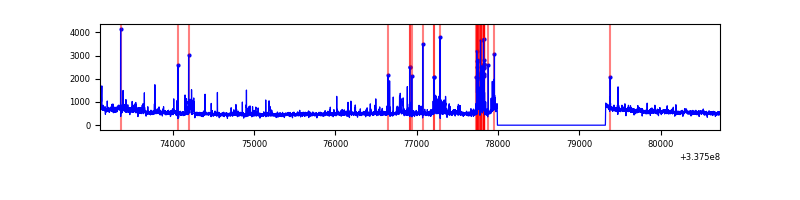 |
Top three noisy pixels from each quadrant. If the there are fewer than three noisy pixels in the level2.evt file, extra rows are filled as -1
| Pixel properties | Quadrant properties | ||||||
|---|---|---|---|---|---|---|---|
| Quadrant | DetID | PixID | Counts | Sigma | Mean | Median | Sigma |
| A | 0 | 13 | 694029 | 4213.86 | 837 | 823 | 164.5 |
| A | 6 | 16 | 33760 | 200.21 | 837 | 823 | 164.5 |
| A | 12 | 96 | 27692 | 163.33 | 837 | 823 | 164.5 |
| B | 0 | 189 | 173889 | 1126.42 | 842 | 823 | 153.6 |
| B | 10 | 246 | 26746 | 168.72 | 842 | 823 | 153.6 |
| B | 0 | 229 | 24593 | 154.71 | 842 | 823 | 153.6 |
| C | 15 | 208 | 147986 | 759.62 | 842 | 852 | 193.7 |
| C | 14 | 238 | 136000 | 697.74 | 842 | 852 | 193.7 |
| C | 2 | 16 | 8918 | 41.64 | 842 | 852 | 193.7 |
| D | 2 | 250 | 192187 | 967.33 | 841 | 825 | 197.8 |
| D | 1 | 52 | 133120 | 668.75 | 841 | 825 | 197.8 |
| D | 15 | 21 | 88432 | 442.85 | 841 | 825 | 197.8 |
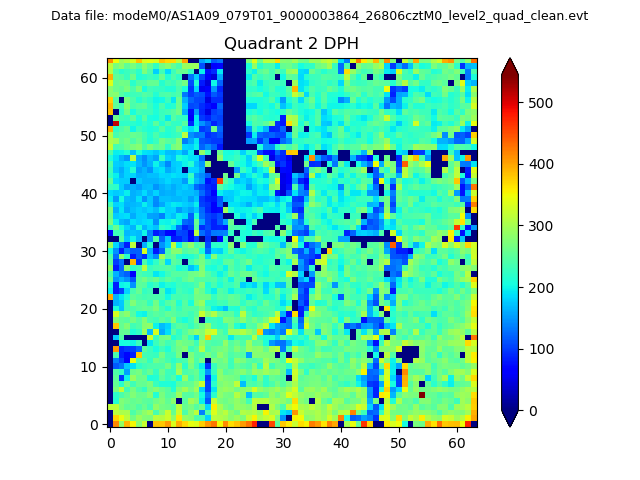
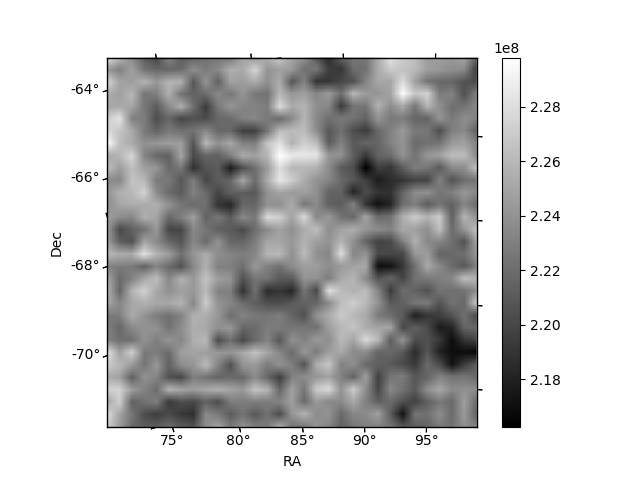
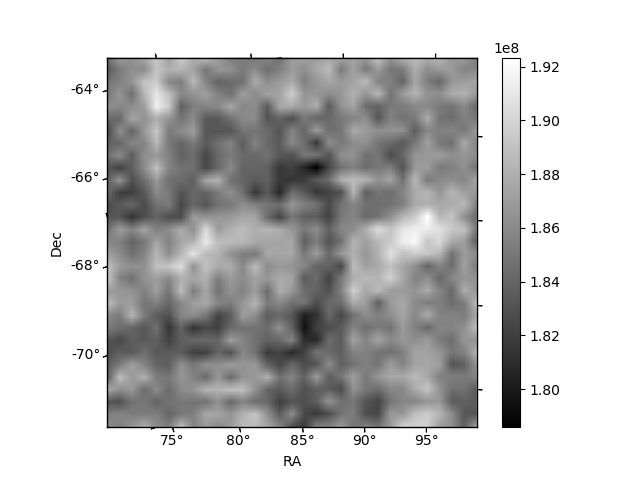
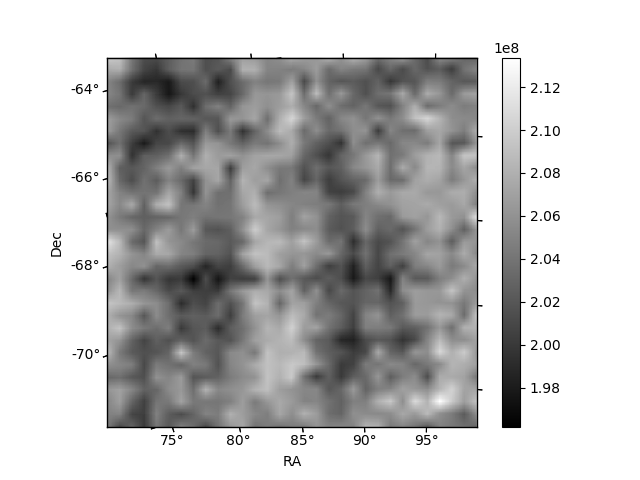
Histogram calculated using DETX and DETY for each event in the final _common_clean file
| Quadrant A | 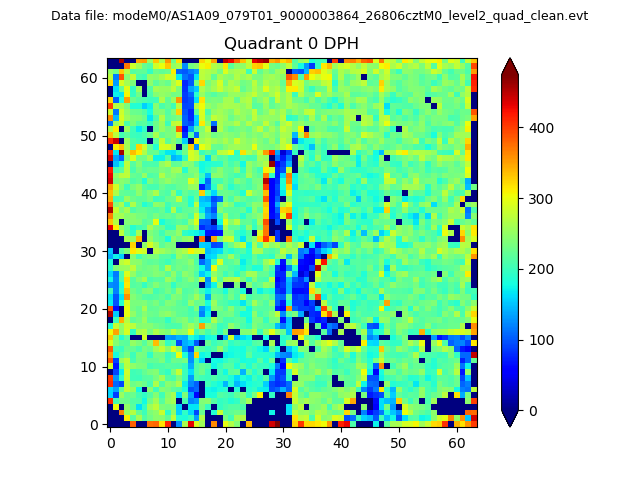 |
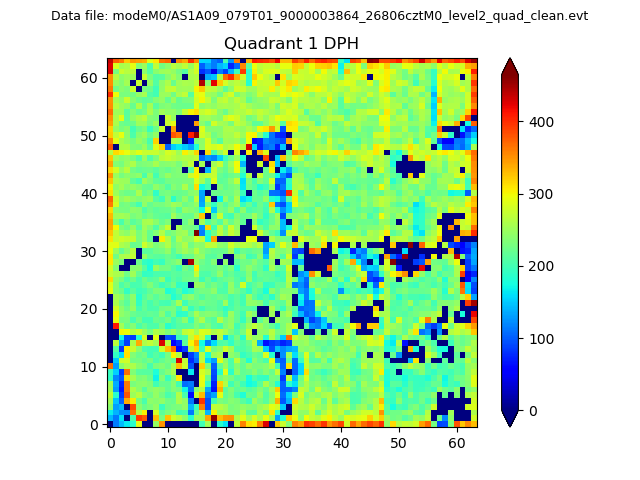 |
Quadrant B |
|---|---|---|---|
| Quadrant D | 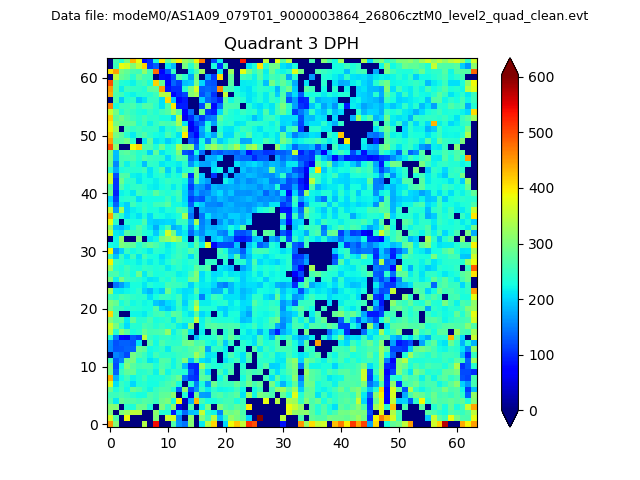 |
 |
Quadrant C |
| Plot type | Count rate plots | Images |
|---|---|---|
| Comparison with Poisson distribution Blue bars denote a histogram of data divided into 1 sec bins. Red curve is a Poisson curve with rate = median count rate of data. |
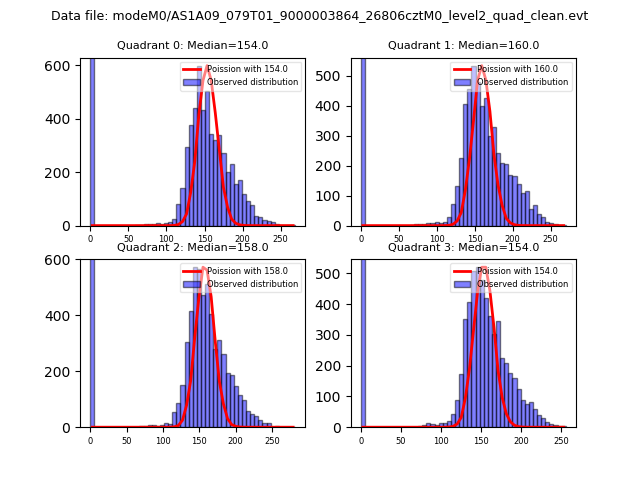 |
 |
| Quadrant-wise count rates Data is divided into 100 sec bins |
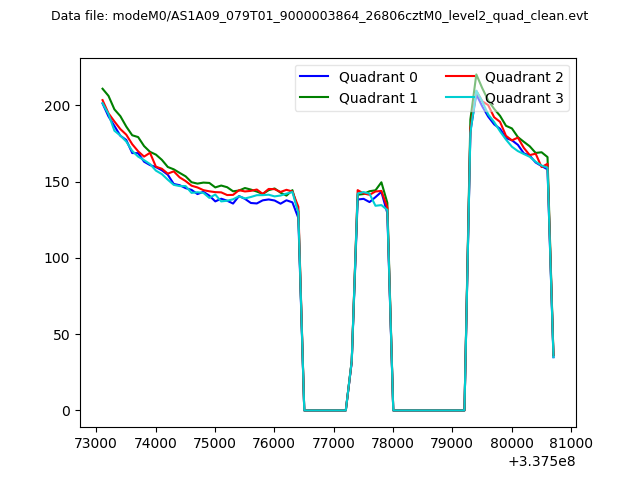 |
|
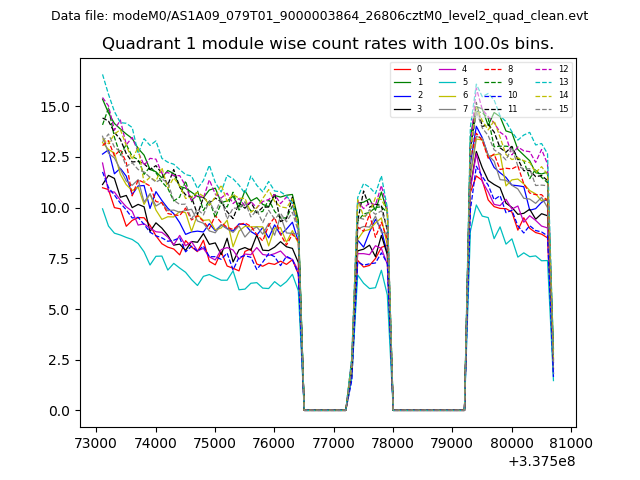
| Module-wise count rates for Quadrant A Data is divided into 100 sec bins |
 |
 |
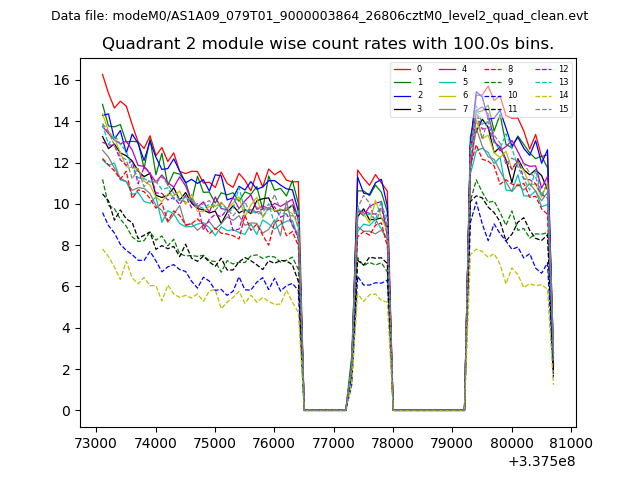
| Module-wise count rates for Quadrant B Data is divided into 100 sec bins |
 |
 |
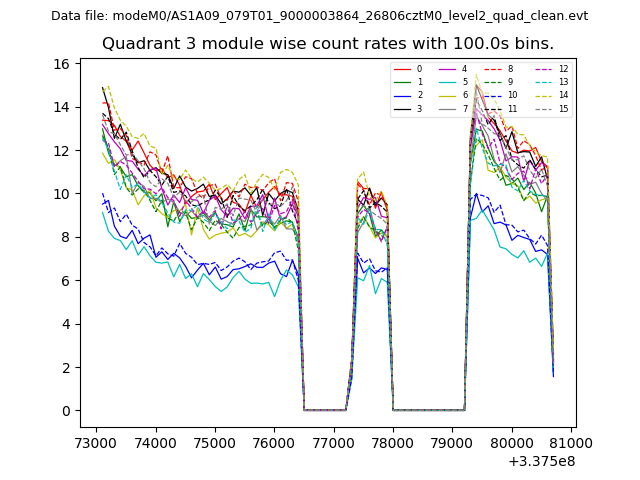
| Module-wise count rates for Quadrant C Data is divided into 100 sec bins |
 |
 |
| Module-wise count rates for Quadrant D Data is divided into 100 sec bins |
 |
 |
| Parameter | Plot |
|---|---|
| CZT HV Monitor | 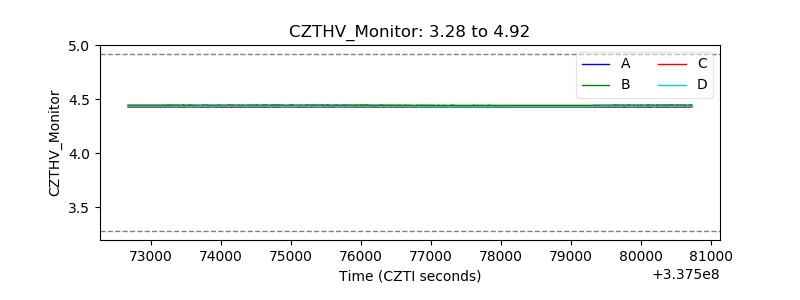 |
| D_VDD | 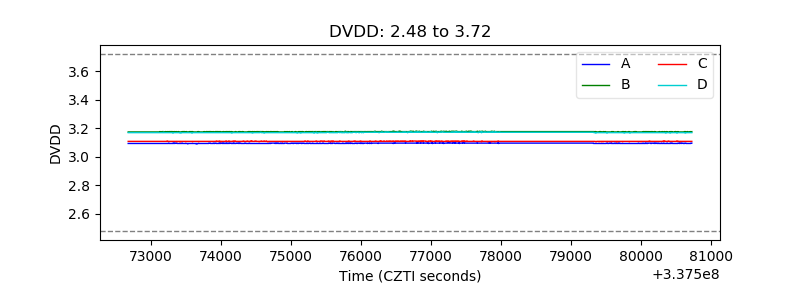 |
| Temperature 1 |  |
| Veto HV Monitor | 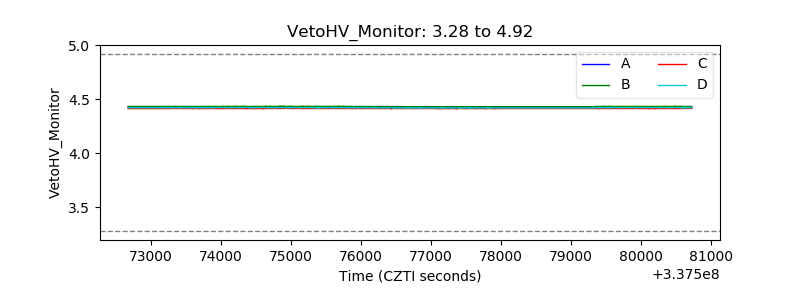 |
| Veto LLD | 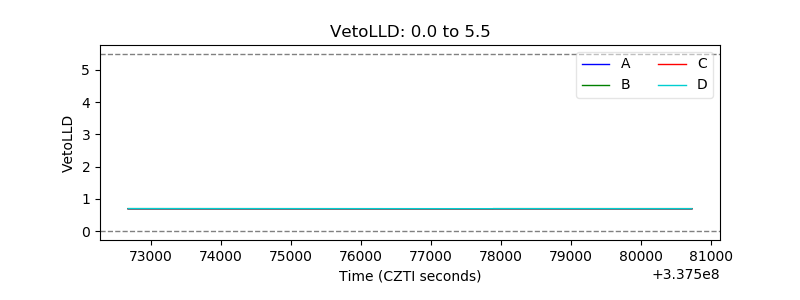 |
| Alpha Counter | 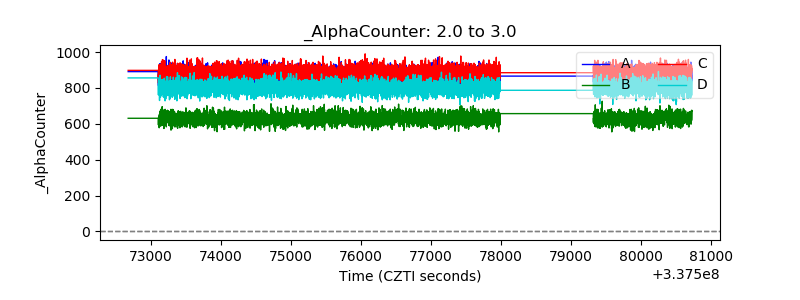 |
| _CPM_Rate | 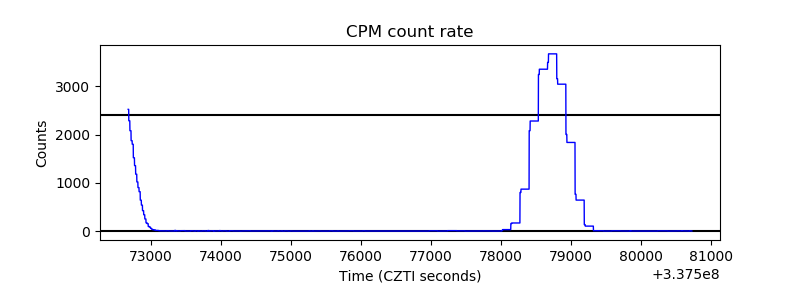 |
| CZT Counter | 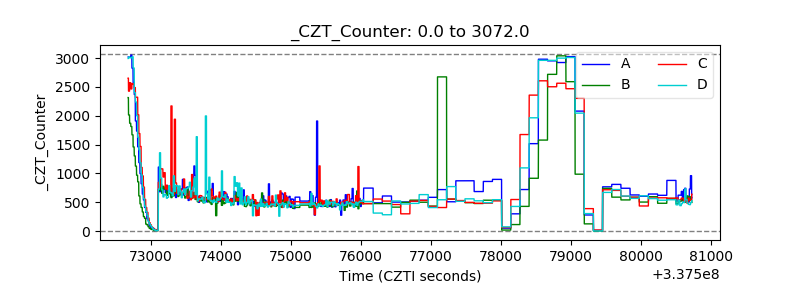 |
| +2.5 Volts monitor |  |
| +5 Volts monitor |  |
| _ROLL_ROT | 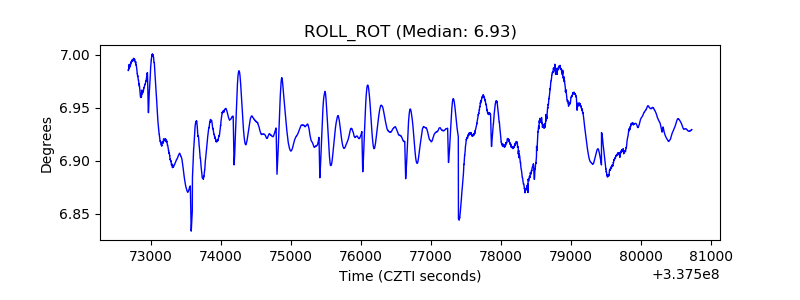 |
| _Roll_DEC | 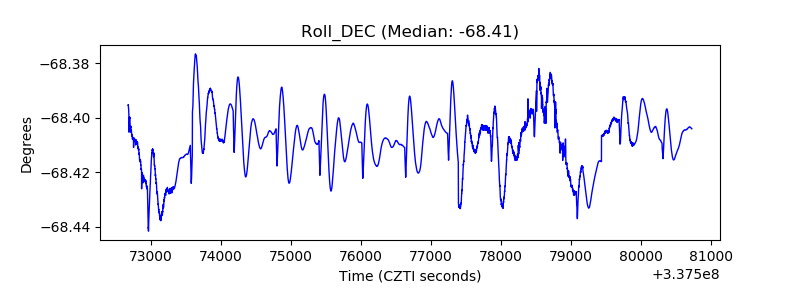 |
| _Roll_RA | 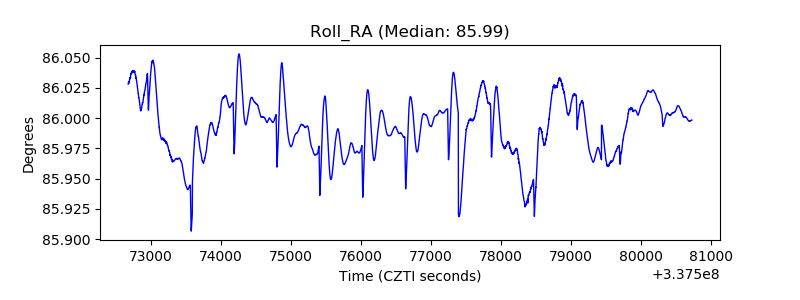 |
| Veto Counter | 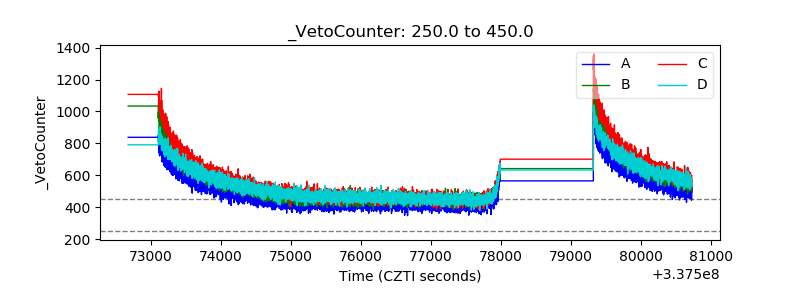 |