| Param | Original file | Final file |
|---|---|---|
| Filename | modeM0/AS1A09_079T01_9000003864_26807cztM0_level2.evt | modeM0/AS1A09_079T01_9000003864_26807cztM0_level2_quad_clean.evt |
| Size (bytes) | 590,253,120 | 129,309,120 |
| Size | 562.9 MB | 123.3 MB |
| Events in quadrant A | 4,572,687 | 867,422 |
| Events in quadrant B | 5,562,931 | 855,379 |
| Events in quadrant C | 3,609,301 | 889,167 |
| Events in quadrant D | 3,710,977 | 871,221 |
| Mode M9 | |||
|---|---|---|---|
| Quadrant | BADHDUFLAG | Total packets | Discarded packets |
| A | 0 | 16 | 0 |
| B | 0 | 17 | 0 |
| C | 0 | 17 | 0 |
| D | 0 | 17 | 0 |
| Mode M0 | |||
|---|---|---|---|
| Quadrant | BADHDUFLAG | Total packets | Discarded packets |
| A | 0 | 18046 | 0 |
| B | 0 | 20555 | 0 |
| C | 0 | 14652 | 0 |
| D | 0 | 14967 | 0 |
| Quadrant | Total seconds | Saturated seconds | Saturation percentage |
|---|---|---|---|
| A | 6197 | 73 | 1.177989% |
| B | 6197 | 1041 | 16.798451% |
| C | 6197 | 128 | 2.065516% |
| D | 6197 | 83 | 1.339358% |
Noise dominated data is calculated using 1-second bins in cleaned event files. If a bin has >2000 counts, and if more than 50% of those come from <1% of pixels, then it is considered to be noise-dominated and hence unusable.
| Quadrant | # 1 sec bins | Bins with >0 counts | Bins with >2000 counts | High rate bins dominated by noise | Noise dominated (total time) | Noise dominated (detector-on time) | Marked lightcurve |
|---|---|---|---|---|---|---|---|
| A | 7562 | 6198 | 16 | 16 | 0.21% | 0.26% | 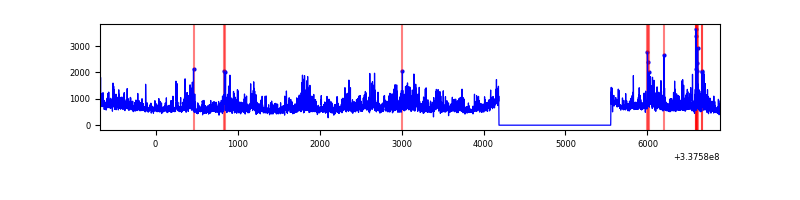 |
| B | 7562 | 6198 | 692 | 692 | 9.15% | 11.16% | 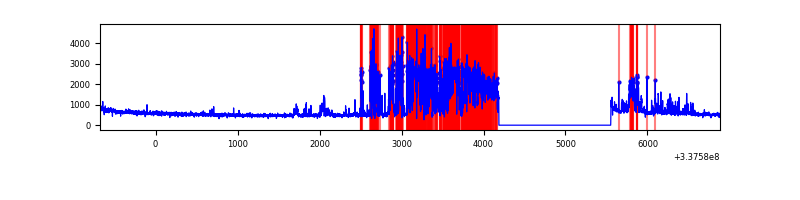 |
| C | 7562 | 6198 | 9 | 9 | 0.12% | 0.15% | 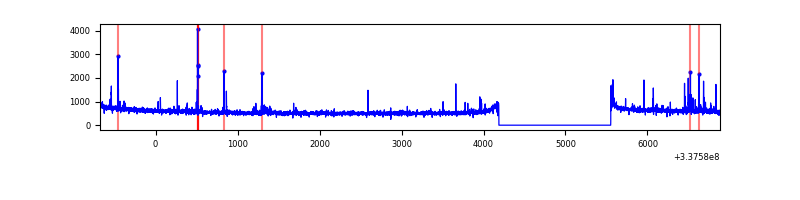 |
| D | 7562 | 6198 | 54 | 54 | 0.71% | 0.87% | 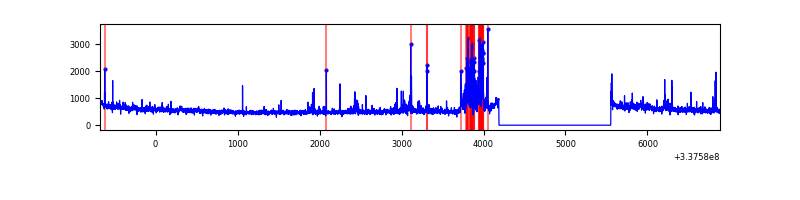 |
Top three noisy pixels from each quadrant. If the there are fewer than three noisy pixels in the level2.evt file, extra rows are filled as -1
| Pixel properties | Quadrant properties | ||||||
|---|---|---|---|---|---|---|---|
| Quadrant | DetID | PixID | Counts | Sigma | Mean | Median | Sigma |
| A | 0 | 13 | 1309239 | 7902.89 | 846 | 833 | 165.6 |
| A | 13 | 254 | 9583 | 52.85 | 846 | 833 | 165.6 |
| A | 0 | 226 | 7438 | 39.89 | 846 | 833 | 165.6 |
| B | 0 | 189 | 2409631 | 16603.43 | 797 | 779 | 145.1 |
| B | 10 | 246 | 17667 | 116.4 | 797 | 779 | 145.1 |
| B | 12 | 111 | 16334 | 107.22 | 797 | 779 | 145.1 |
| C | 14 | 238 | 136443 | 694.58 | 849 | 858 | 195.2 |
| C | 14 | 176 | 74539 | 377.45 | 849 | 858 | 195.2 |
| C | 15 | 208 | 69284 | 350.53 | 849 | 858 | 195.2 |
| D | 1 | 52 | 344070 | 1729.54 | 853 | 837 | 198.5 |
| D | 2 | 250 | 65300 | 324.83 | 853 | 837 | 198.5 |
| D | 15 | 21 | 60567 | 300.98 | 853 | 837 | 198.5 |
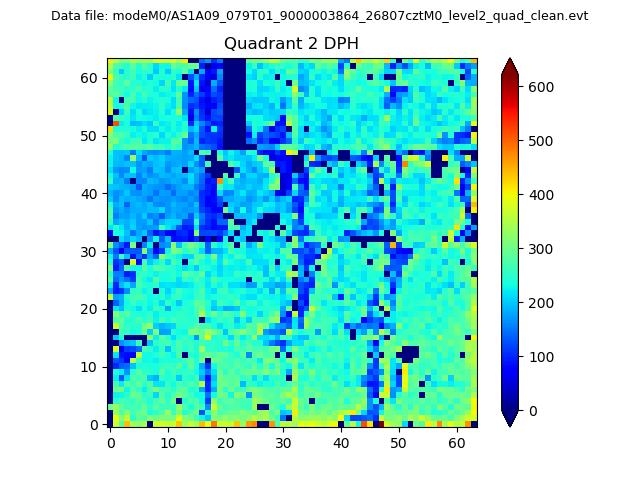
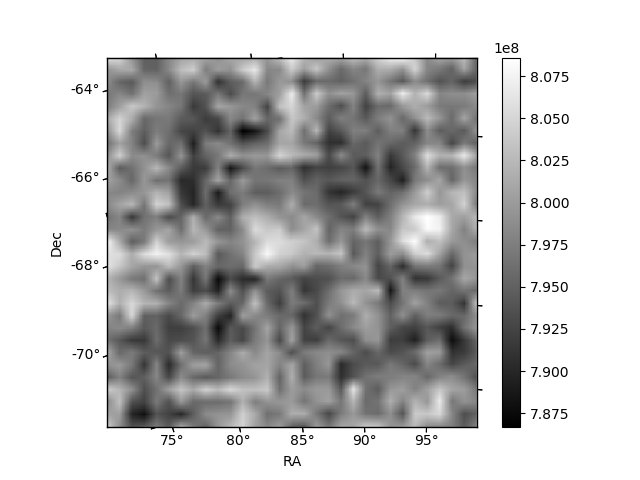
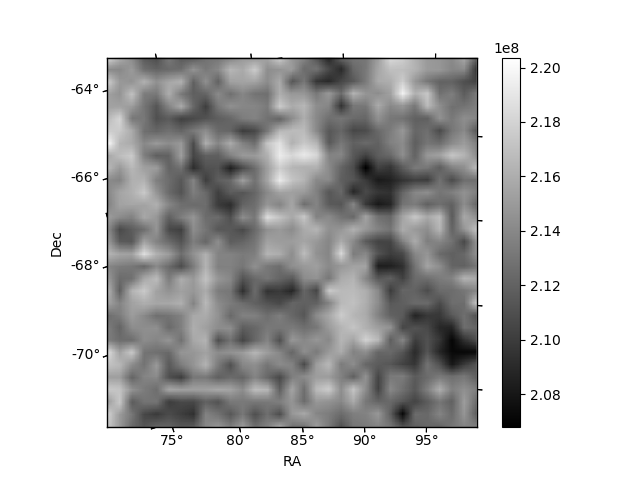
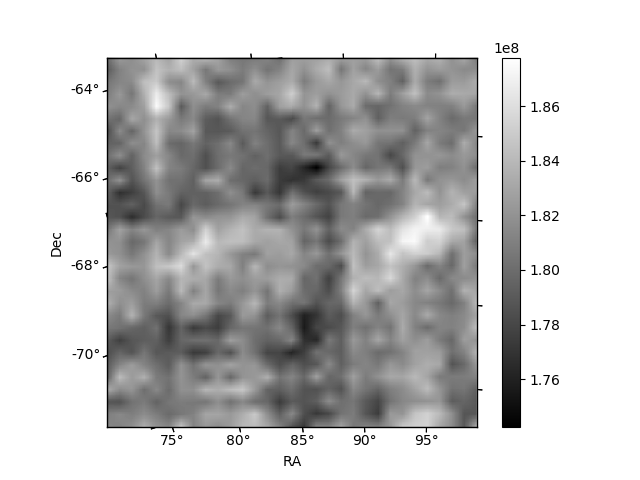
Histogram calculated using DETX and DETY for each event in the final _common_clean file
| Quadrant A | 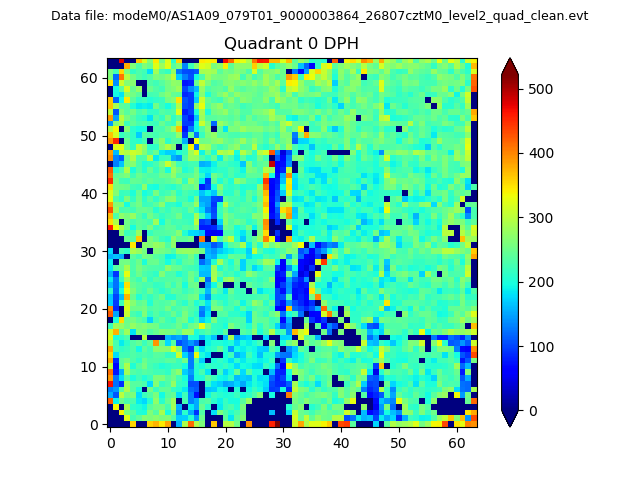 |
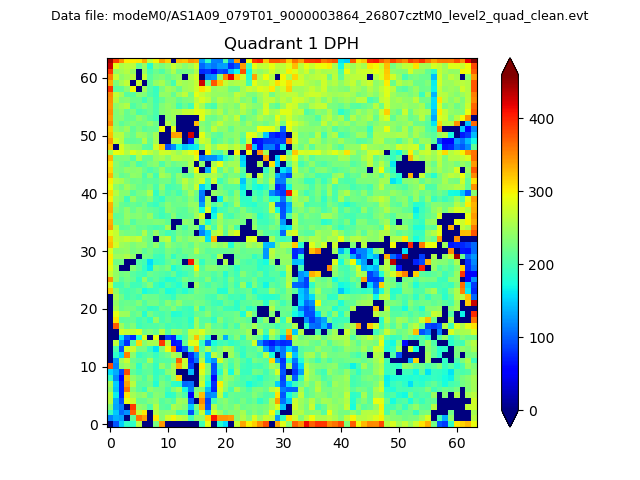 |
Quadrant B |
|---|---|---|---|
| Quadrant D | 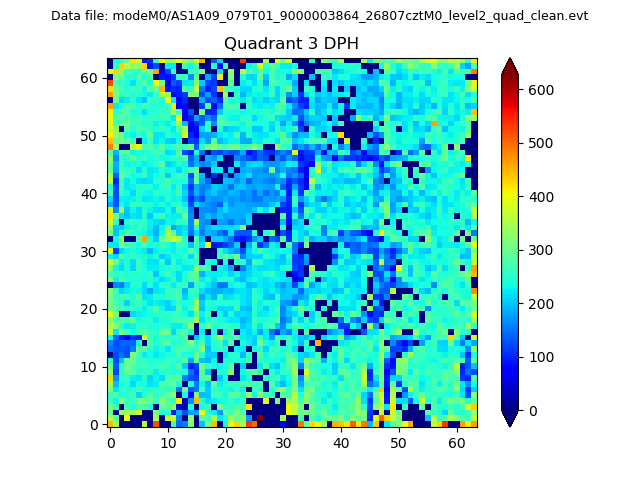 |
 |
Quadrant C |
| Plot type | Count rate plots | Images |
|---|---|---|
| Comparison with Poisson distribution Blue bars denote a histogram of data divided into 1 sec bins. Red curve is a Poisson curve with rate = median count rate of data. |
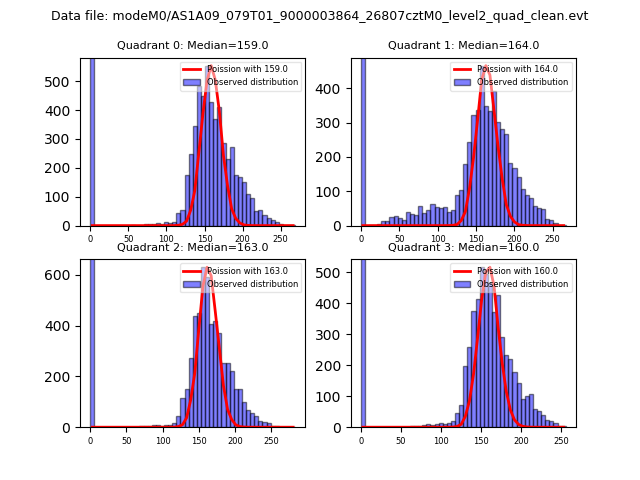 |
 |
| Quadrant-wise count rates Data is divided into 100 sec bins |
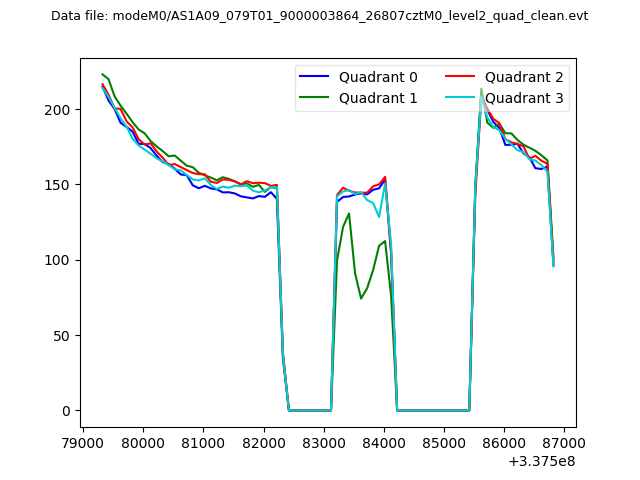 |
|
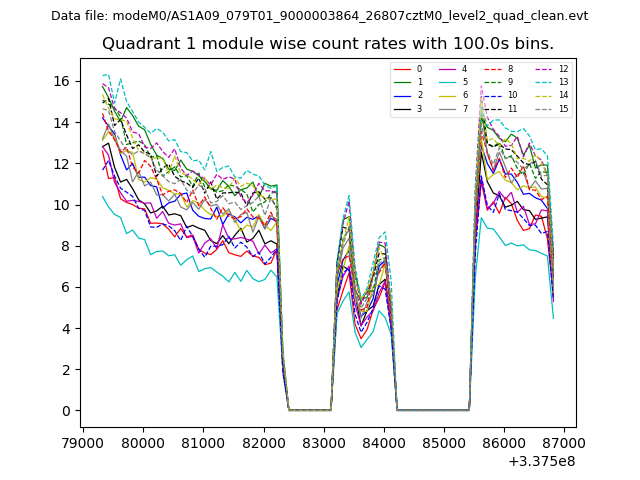
| Module-wise count rates for Quadrant A Data is divided into 100 sec bins |
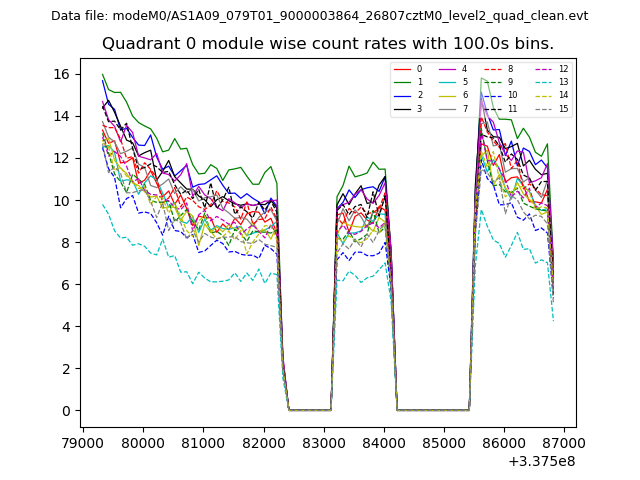 |
 |
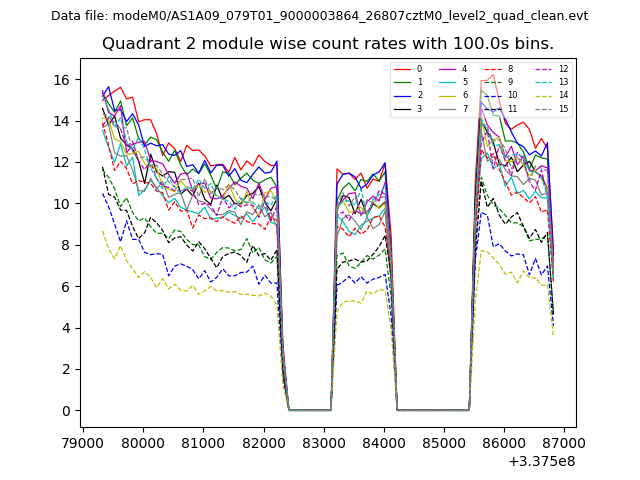
| Module-wise count rates for Quadrant B Data is divided into 100 sec bins |
 |
 |
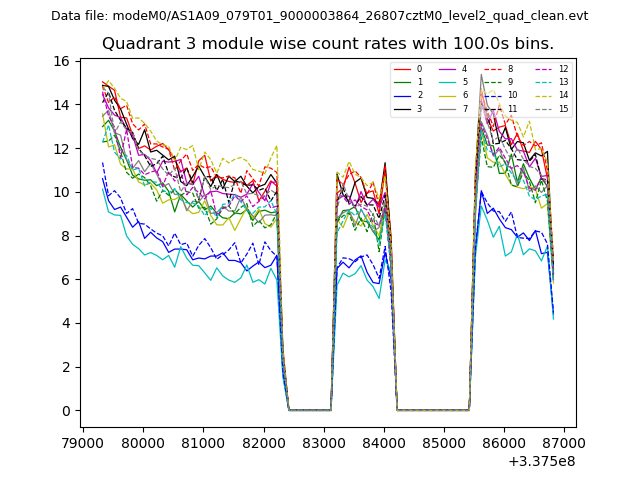
| Module-wise count rates for Quadrant C Data is divided into 100 sec bins |
 |
 |
| Module-wise count rates for Quadrant D Data is divided into 100 sec bins |
 |
 |
| Parameter | Plot |
|---|---|
| CZT HV Monitor | 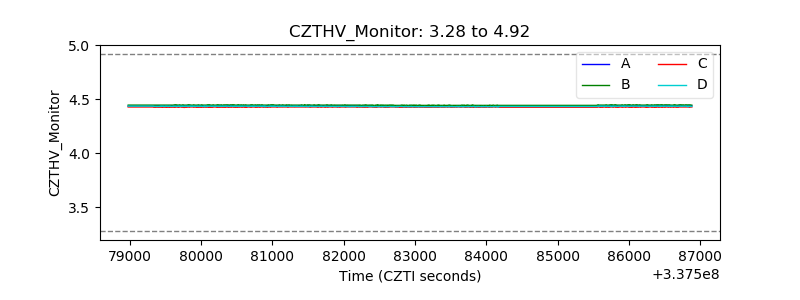 |
| D_VDD | 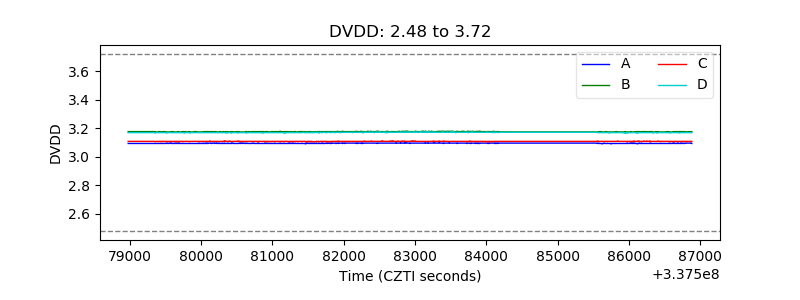 |
| Temperature 1 | 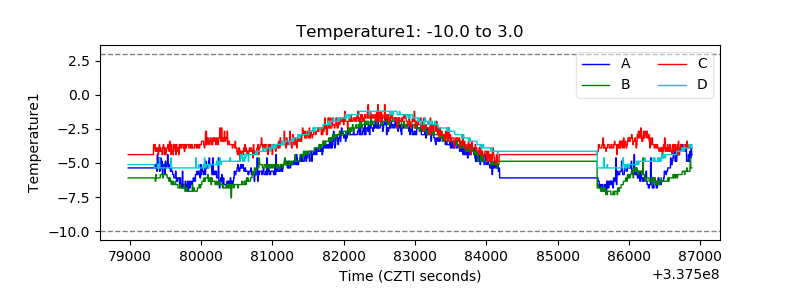 |
| Veto HV Monitor | 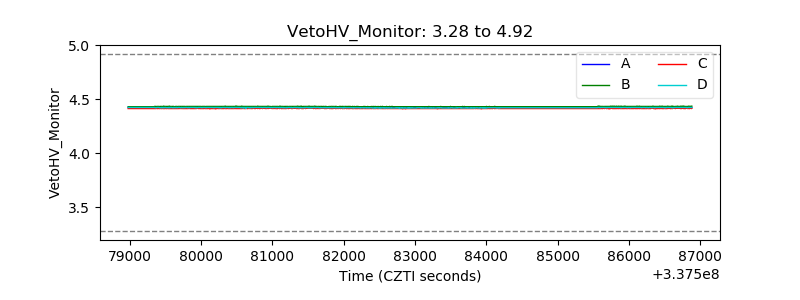 |
| Veto LLD | 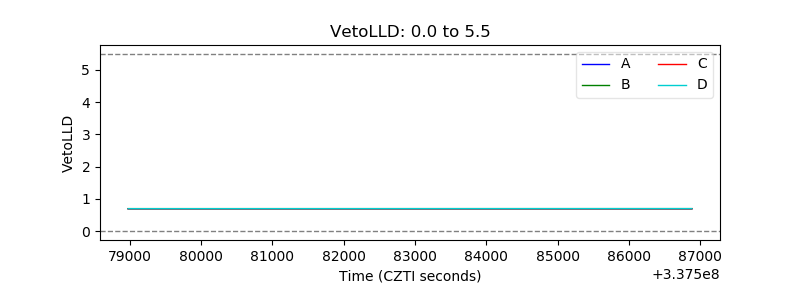 |
| Alpha Counter | 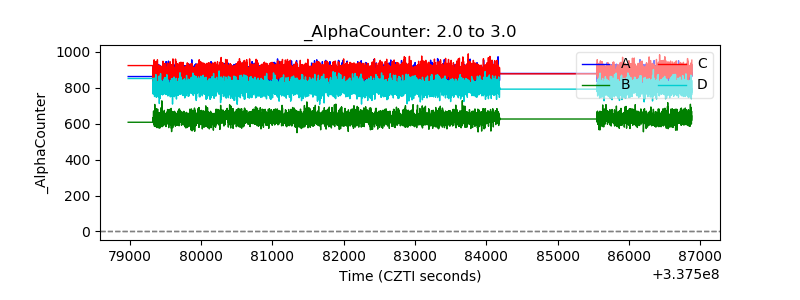 |
| _CPM_Rate | 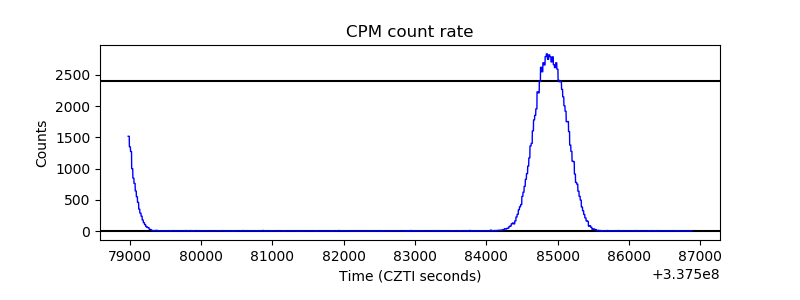 |
| CZT Counter | 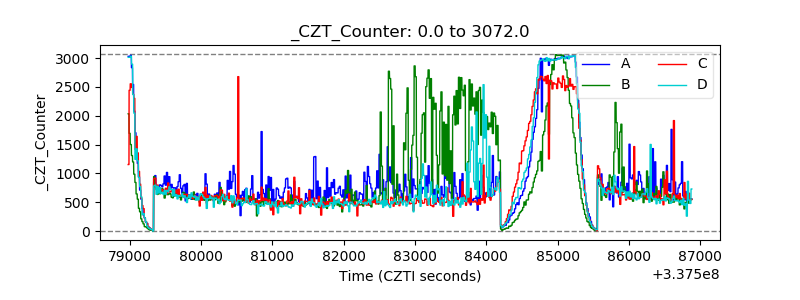 |
| +2.5 Volts monitor |  |
| +5 Volts monitor | 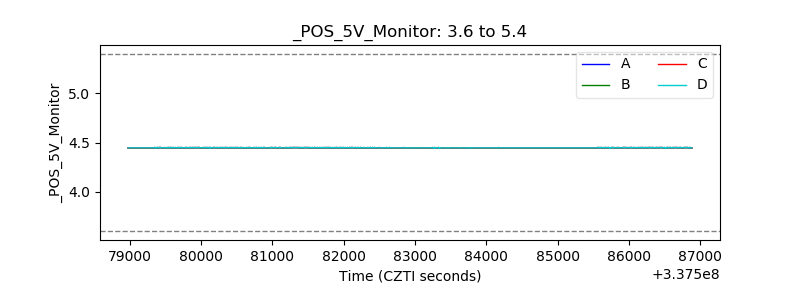 |
| _ROLL_ROT | 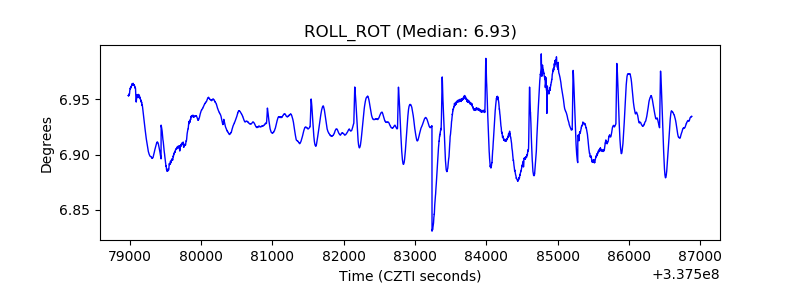 |
| _Roll_DEC |  |
| _Roll_RA | 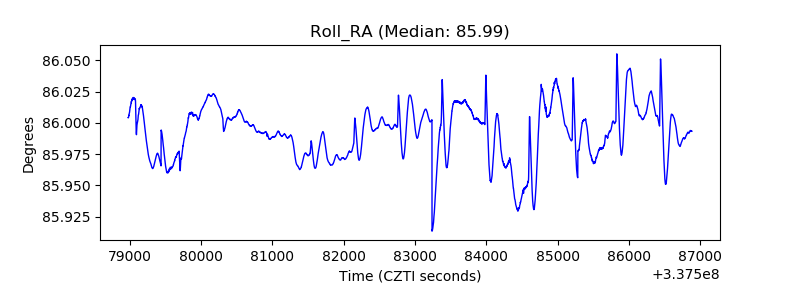 |
| Veto Counter | 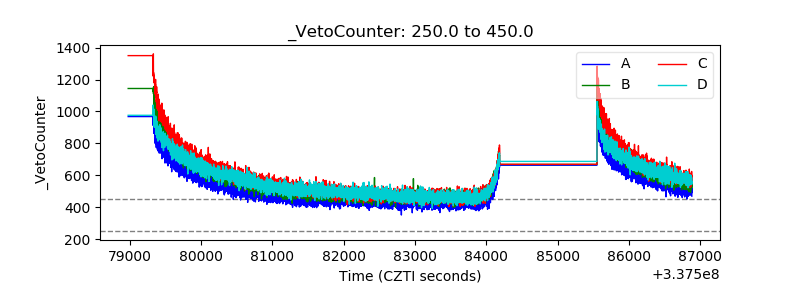 |