| Param | Original file | Final file |
|---|---|---|
| Filename | modeM0/AS1A09_079T01_9000003864_26808cztM0_level2.evt | modeM0/AS1A09_079T01_9000003864_26808cztM0_level2_quad_clean.evt |
| Size (bytes) | 548,870,400 | 114,200,640 |
| Size | 523.4 MB | 108.9 MB |
| Events in quadrant A | 4,372,010 | 757,865 |
| Events in quadrant B | 5,326,914 | 764,439 |
| Events in quadrant C | 3,297,436 | 773,695 |
| Events in quadrant D | 3,236,438 | 760,395 |
| Mode M9 | |||
|---|---|---|---|
| Quadrant | BADHDUFLAG | Total packets | Discarded packets |
| A | 0 | 14 | 0 |
| B | 0 | 14 | 0 |
| C | 0 | 14 | 0 |
| D | 0 | 14 | 0 |
| Mode M0 | |||
|---|---|---|---|
| Quadrant | BADHDUFLAG | Total packets | Discarded packets |
| A | 0 | 17034 | 0 |
| B | 0 | 19582 | 0 |
| C | 0 | 13300 | 0 |
| D | 0 | 13002 | 0 |
| Quadrant | Total seconds | Saturated seconds | Saturation percentage |
|---|---|---|---|
| A | 5766 | 141 | 2.445369% |
| B | 5766 | 799 | 13.857093% |
| C | 5766 | 131 | 2.271939% |
| D | 5766 | 91 | 1.578217% |
Noise dominated data is calculated using 1-second bins in cleaned event files. If a bin has >2000 counts, and if more than 50% of those come from <1% of pixels, then it is considered to be noise-dominated and hence unusable.
| Quadrant | # 1 sec bins | Bins with >0 counts | Bins with >2000 counts | High rate bins dominated by noise | Noise dominated (total time) | Noise dominated (detector-on time) | Marked lightcurve |
|---|---|---|---|---|---|---|---|
| A | 7091 | 5767 | 38 | 38 | 0.54% | 0.66% | 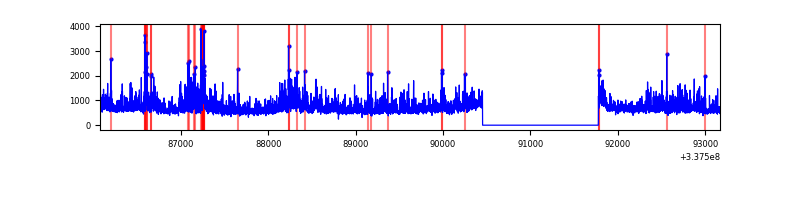 |
| B | 7091 | 5767 | 569 | 569 | 8.02% | 9.87% | 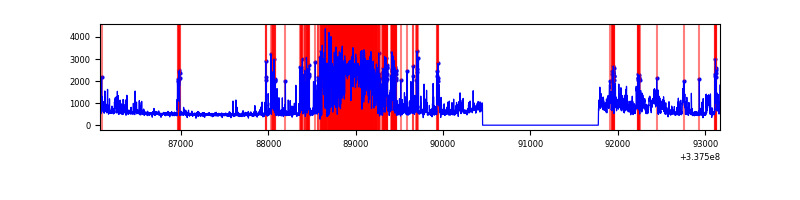 |
| C | 7091 | 5767 | 7 | 7 | 0.10% | 0.12% | 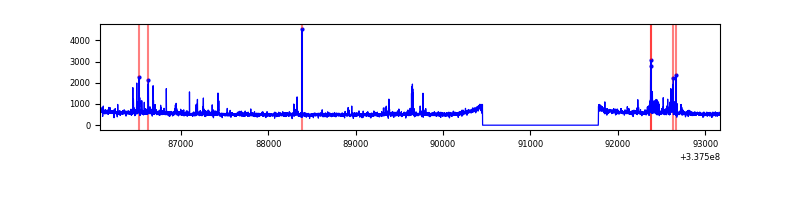 |
| D | 7091 | 5767 | 40 | 40 | 0.56% | 0.69% | 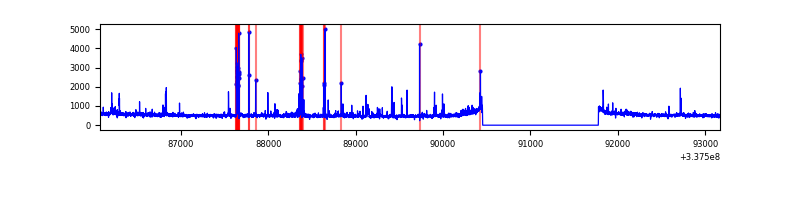 |
Top three noisy pixels from each quadrant. If the there are fewer than three noisy pixels in the level2.evt file, extra rows are filled as -1
| Pixel properties | Quadrant properties | ||||||
|---|---|---|---|---|---|---|---|
| Quadrant | DetID | PixID | Counts | Sigma | Mean | Median | Sigma |
| A | 0 | 13 | 1418273 | 9428.63 | 766 | 752 | 150.3 |
| A | 13 | 254 | 8044 | 48.5 | 766 | 752 | 150.3 |
| A | 0 | 226 | 6614 | 38.99 | 766 | 752 | 150.3 |
| B | 0 | 189 | 2369302 | 17756.77 | 726 | 707 | 133.4 |
| B | 0 | 229 | 88586 | 658.81 | 726 | 707 | 133.4 |
| B | 0 | 190 | 21494 | 155.84 | 726 | 707 | 133.4 |
| C | 14 | 238 | 122097 | 697.6 | 759 | 765 | 173.9 |
| C | 15 | 208 | 120357 | 687.59 | 759 | 765 | 173.9 |
| C | 14 | 176 | 66223 | 376.35 | 759 | 765 | 173.9 |
| D | 1 | 52 | 126856 | 700.04 | 766 | 751 | 180.1 |
| D | 2 | 250 | 122865 | 677.88 | 766 | 751 | 180.1 |
| D | 7 | 80 | 40599 | 221.2 | 766 | 751 | 180.1 |
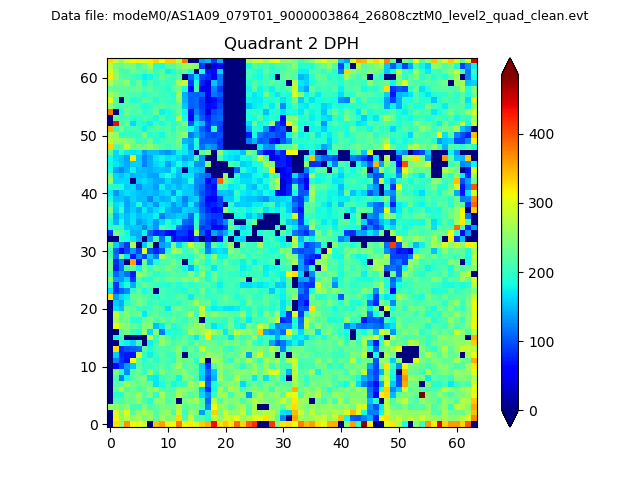
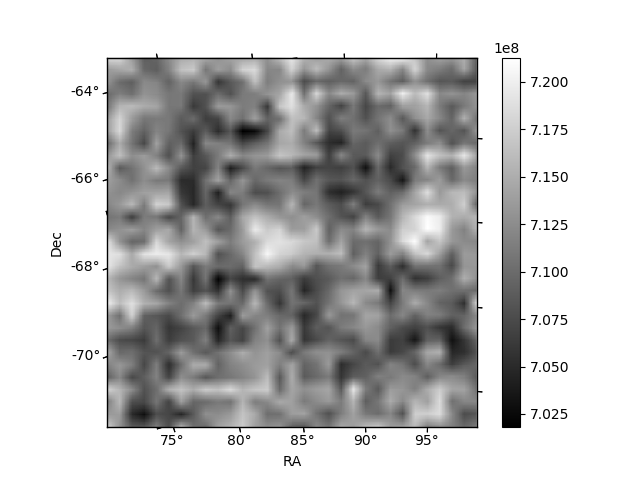
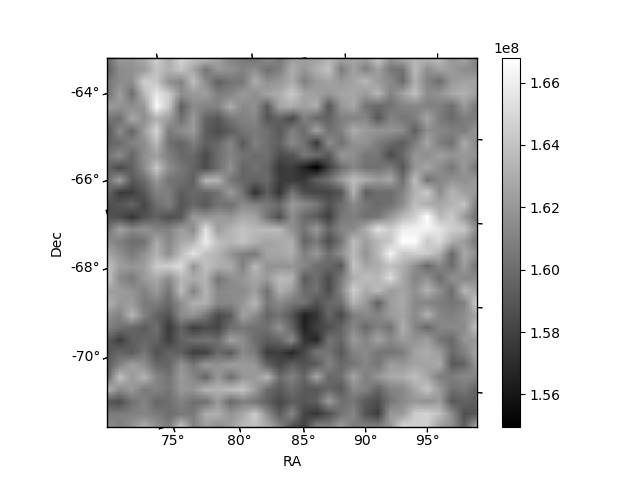
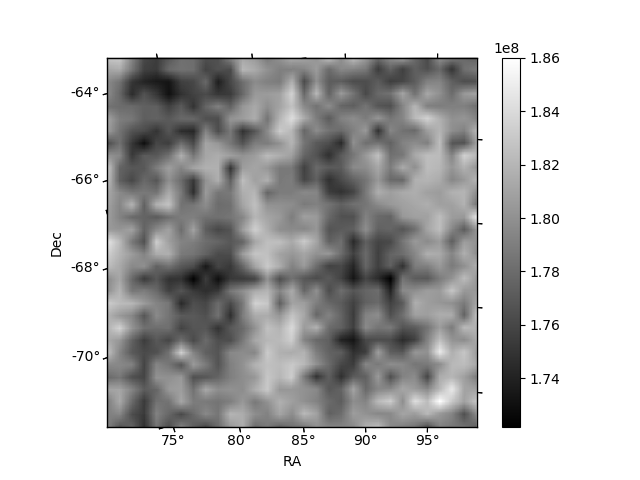
Histogram calculated using DETX and DETY for each event in the final _common_clean file
| Quadrant A | 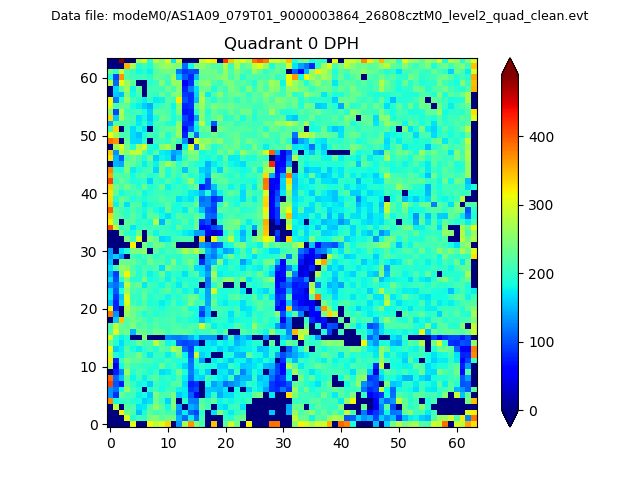 |
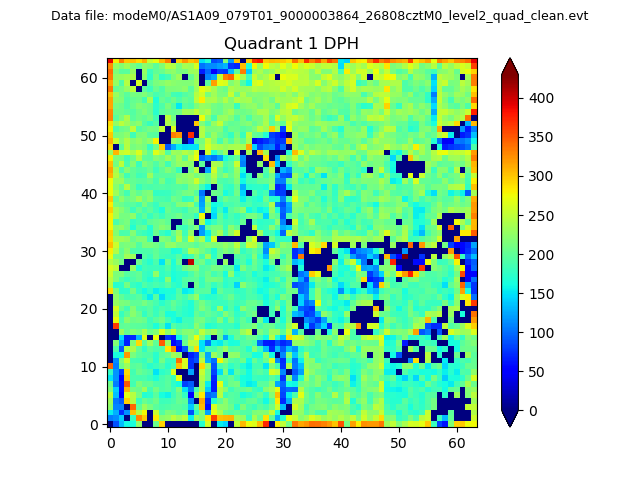 |
Quadrant B |
|---|---|---|---|
| Quadrant D | 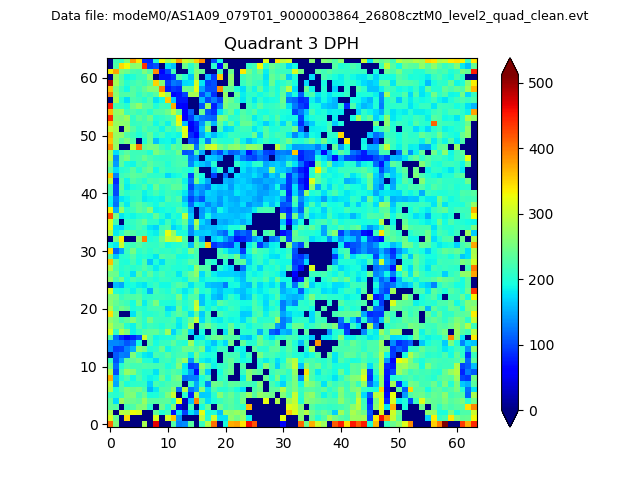 |
 |
Quadrant C |
| Plot type | Count rate plots | Images |
|---|---|---|
| Comparison with Poisson distribution Blue bars denote a histogram of data divided into 1 sec bins. Red curve is a Poisson curve with rate = median count rate of data. |
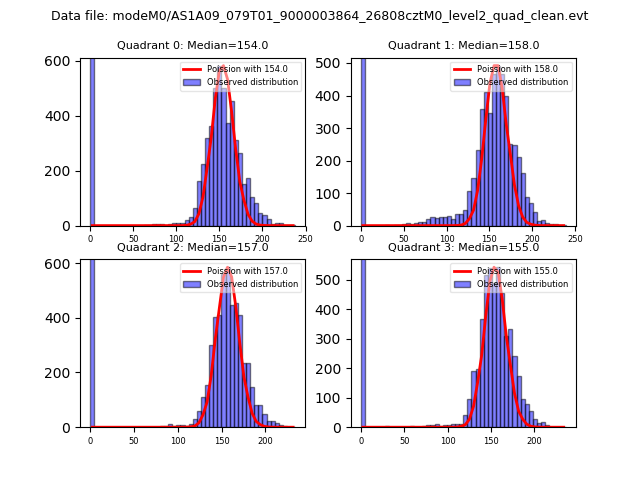 |
 |
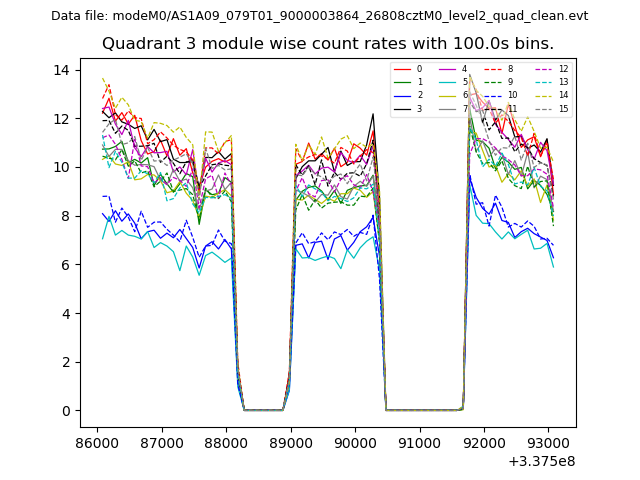
| Quadrant-wise count rates Data is divided into 100 sec bins |
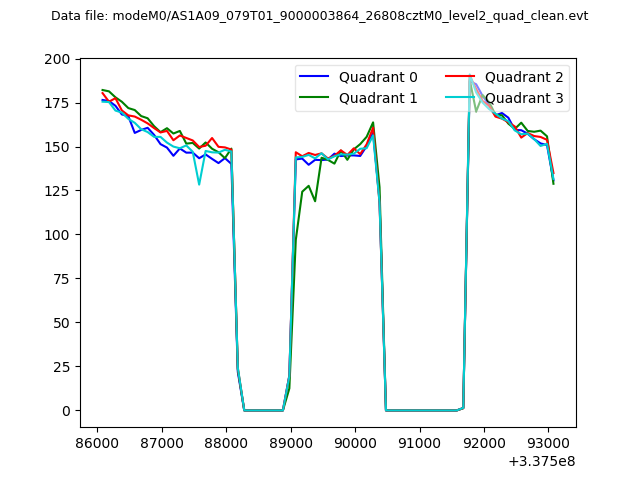 |
|
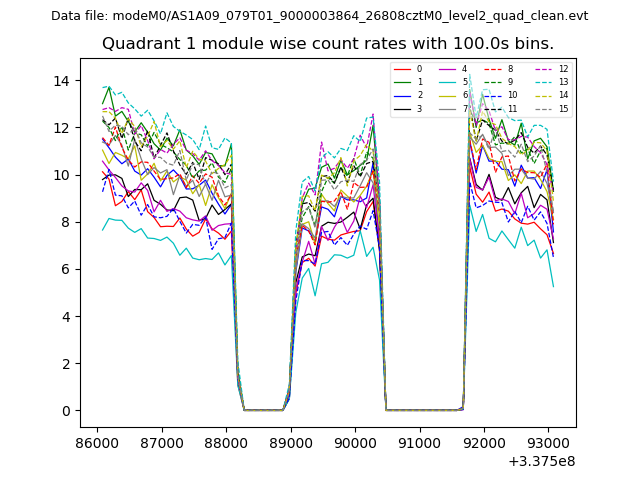
| Module-wise count rates for Quadrant A Data is divided into 100 sec bins |
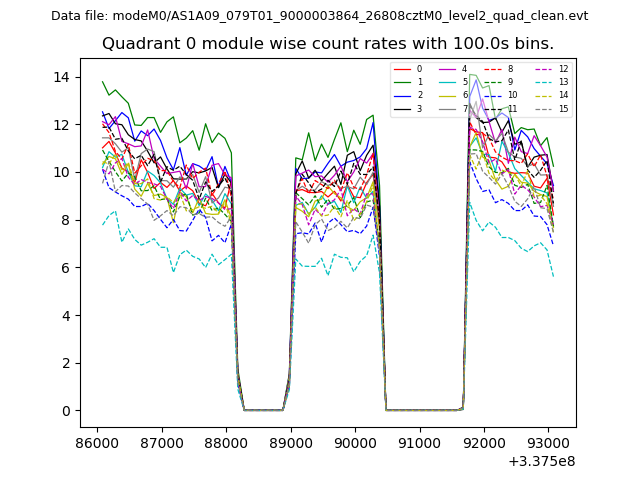 |
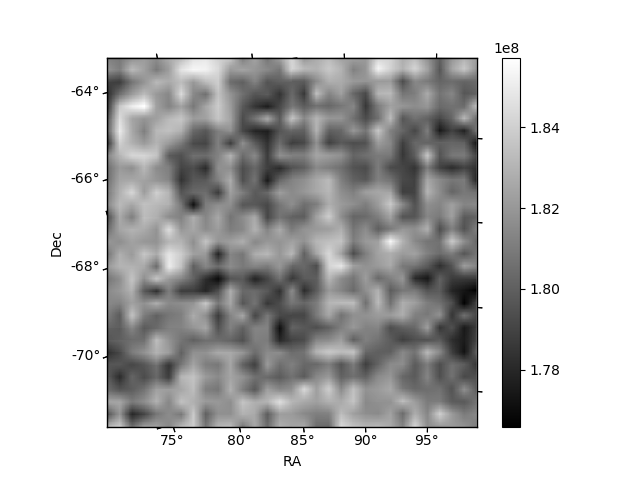 |
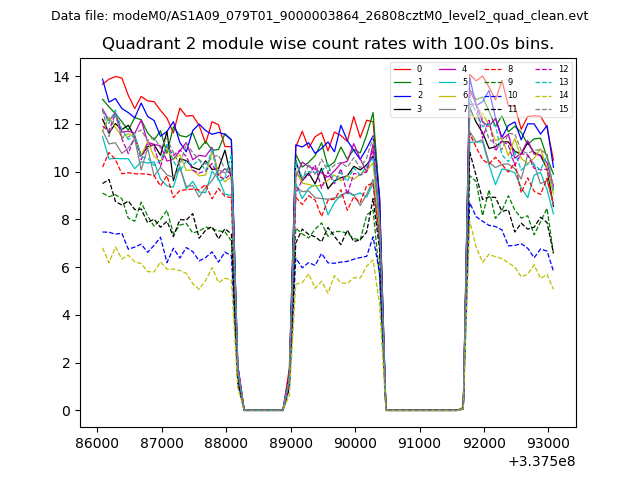
| Module-wise count rates for Quadrant B Data is divided into 100 sec bins |
 |
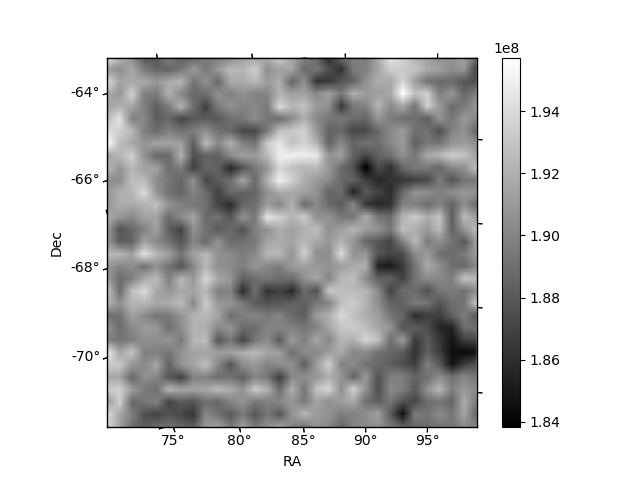 |
| Module-wise count rates for Quadrant C Data is divided into 100 sec bins |
 |
 |
| Module-wise count rates for Quadrant D Data is divided into 100 sec bins |
 |
 |
| Parameter | Plot |
|---|---|
| CZT HV Monitor | 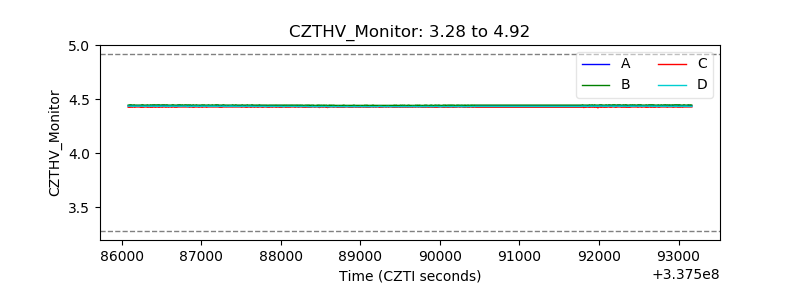 |
| D_VDD | 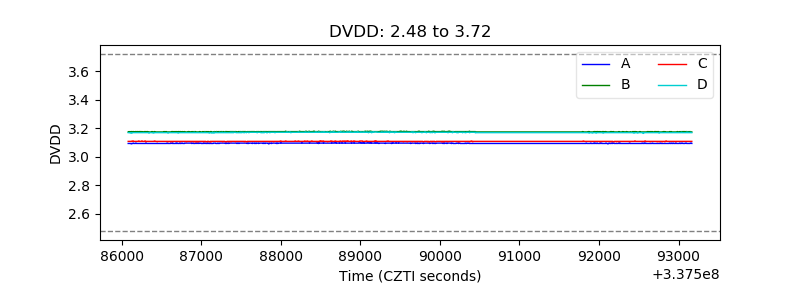 |
| Temperature 1 | 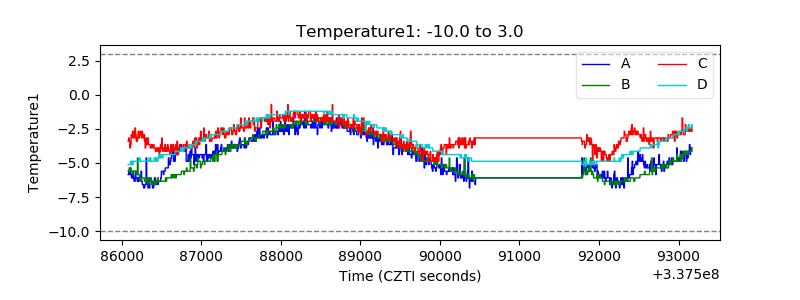 |
| Veto HV Monitor | 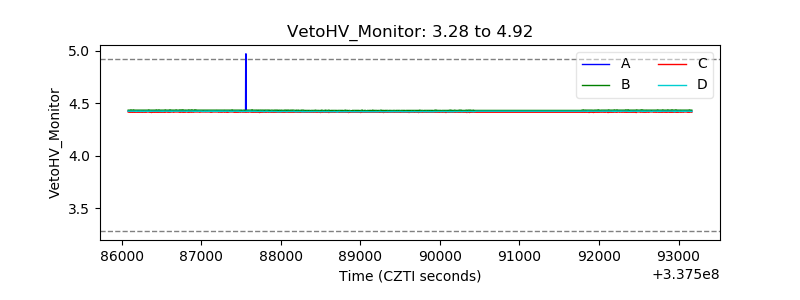 |
| Veto LLD | 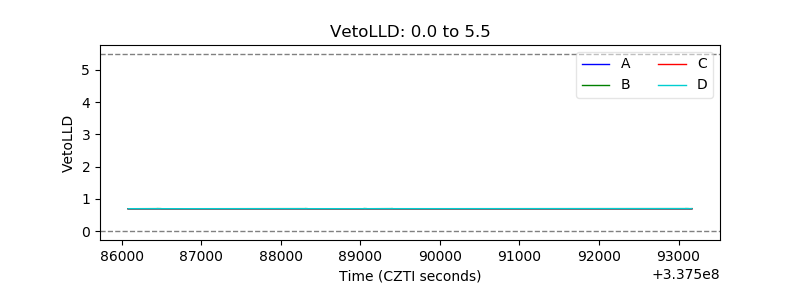 |
| Alpha Counter | 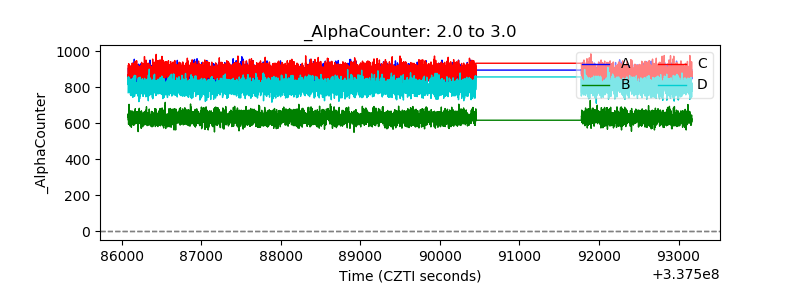 |
| _CPM_Rate | 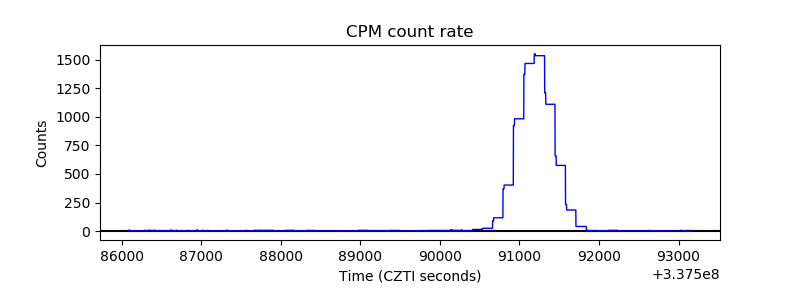 |
| CZT Counter | 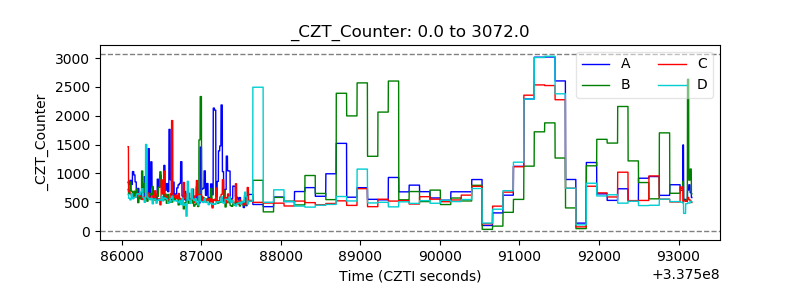 |
| +2.5 Volts monitor | 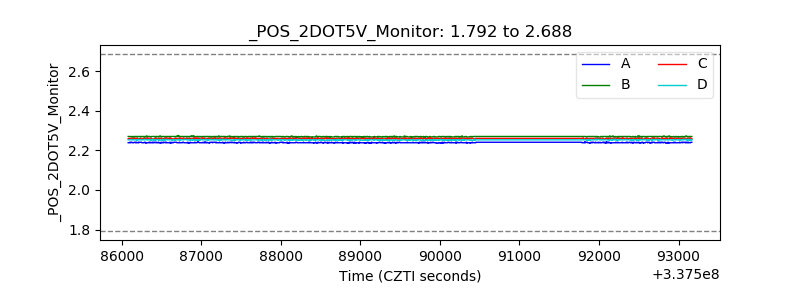 |
| +5 Volts monitor | 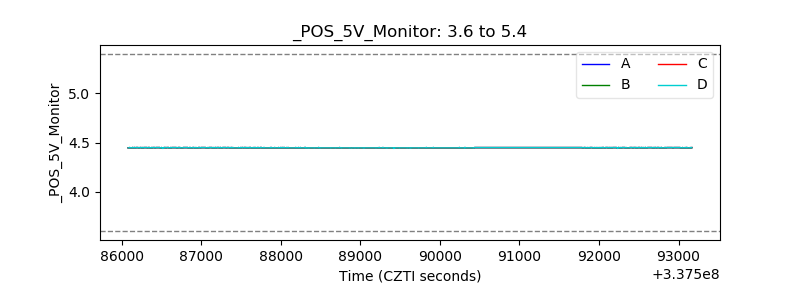 |
| _ROLL_ROT | 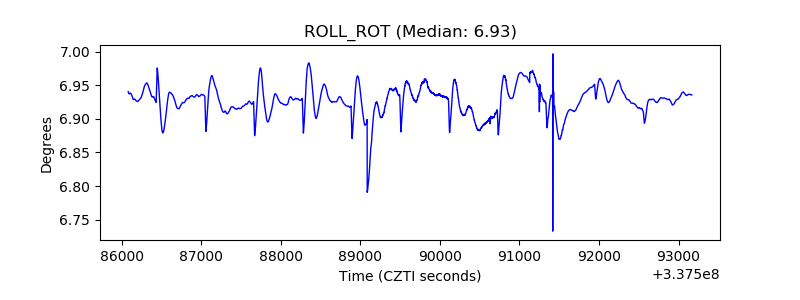 |
| _Roll_DEC | 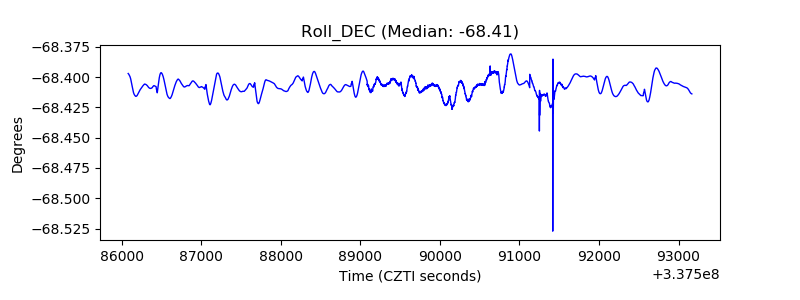 |
| _Roll_RA | 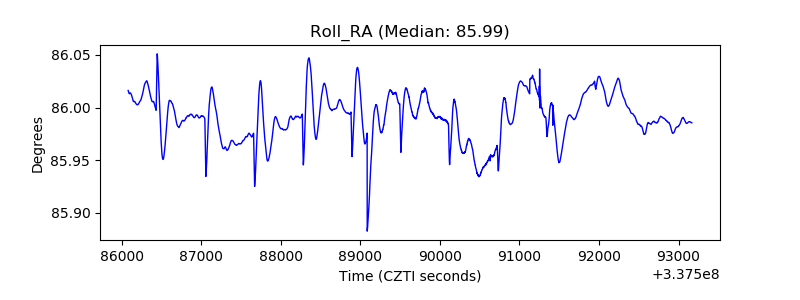 |
| Veto Counter | 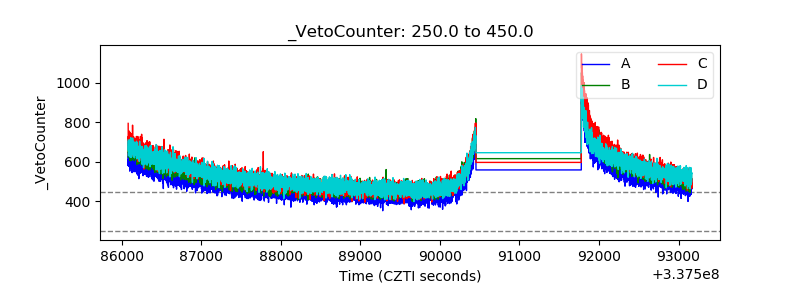 |