| Param | Original file | Final file |
|---|---|---|
| Filename | modeM0/AS1A09_079T01_9000003864_26809cztM0_level2.evt | modeM0/AS1A09_079T01_9000003864_26809cztM0_level2_quad_clean.evt |
| Size (bytes) | 710,648,640 | 113,129,280 |
| Size | 677.7 MB | 107.9 MB |
| Events in quadrant A | 4,634,447 | 766,408 |
| Events in quadrant B | 9,402,797 | 682,188 |
| Events in quadrant C | 3,354,721 | 778,824 |
| Events in quadrant D | 3,711,027 | 765,303 |
| Mode M9 | |||
|---|---|---|---|
| Quadrant | BADHDUFLAG | Total packets | Discarded packets |
| A | 0 | 11 | 0 |
| B | 0 | 11 | 0 |
| C | 0 | 11 | 0 |
| D | 0 | 11 | 0 |
| Mode M0 | |||
|---|---|---|---|
| Quadrant | BADHDUFLAG | Total packets | Discarded packets |
| A | 0 | 18094 | 0 |
| B | 0 | 32219 | 0 |
| C | 0 | 13625 | 0 |
| D | 0 | 14765 | 0 |
| Quadrant | Total seconds | Saturated seconds | Saturation percentage |
|---|---|---|---|
| A | 6198 | 191 | 3.081639% |
| B | 6198 | 2495 | 40.254921% |
| C | 6198 | 155 | 2.500807% |
| D | 6199 | 139 | 2.242297% |
Noise dominated data is calculated using 1-second bins in cleaned event files. If a bin has >2000 counts, and if more than 50% of those come from <1% of pixels, then it is considered to be noise-dominated and hence unusable.
| Quadrant | # 1 sec bins | Bins with >0 counts | Bins with >2000 counts | High rate bins dominated by noise | Noise dominated (total time) | Noise dominated (detector-on time) | Marked lightcurve |
|---|---|---|---|---|---|---|---|
| A | 7328 | 6199 | 35 | 35 | 0.48% | 0.56% |  |
| B | 7328 | 6199 | 1958 | 1958 | 26.72% | 31.59% | 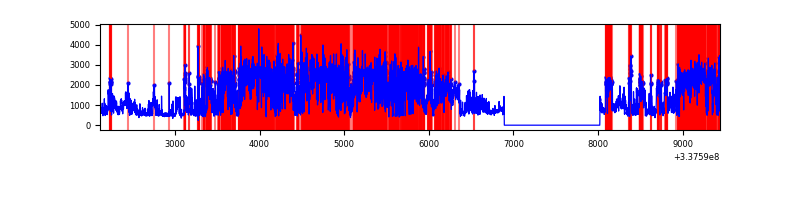 |
| C | 7328 | 6199 | 16 | 16 | 0.22% | 0.26% | 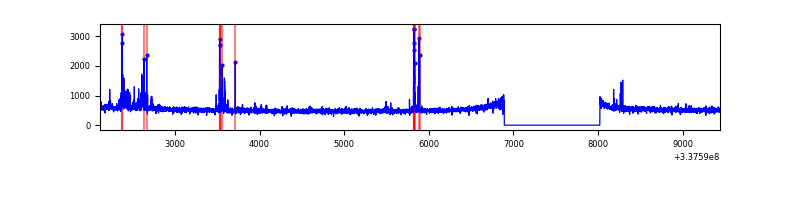 |
| D | 7329 | 6200 | 77 | 77 | 1.05% | 1.24% | 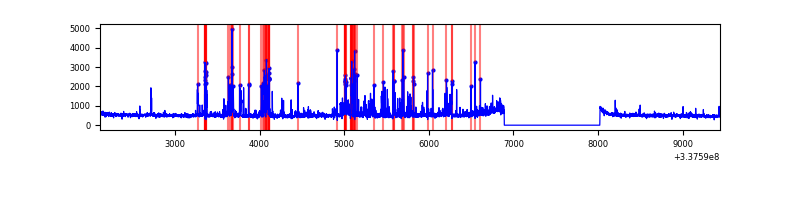 |
Top three noisy pixels from each quadrant. If the there are fewer than three noisy pixels in the level2.evt file, extra rows are filled as -1
| Pixel properties | Quadrant properties | ||||||
|---|---|---|---|---|---|---|---|
| Quadrant | DetID | PixID | Counts | Sigma | Mean | Median | Sigma |
| A | 0 | 13 | 1548686 | 9740.53 | 797 | 780 | 158.9 |
| A | 6 | 16 | 11398 | 66.82 | 797 | 780 | 158.9 |
| A | 13 | 254 | 9112 | 52.43 | 797 | 780 | 158.9 |
| B | 0 | 189 | 6587693 | 50993.11 | 688 | 670 | 129.2 |
| B | 0 | 229 | 73761 | 565.83 | 688 | 670 | 129.2 |
| B | 0 | 190 | 26929 | 203.28 | 688 | 670 | 129.2 |
| C | 15 | 208 | 163432 | 903.88 | 783 | 788 | 179.9 |
| C | 14 | 238 | 127209 | 702.57 | 783 | 788 | 179.9 |
| C | 3 | 233 | 11614 | 60.16 | 783 | 788 | 179.9 |
| D | 1 | 52 | 227684 | 1205.9 | 794 | 774 | 188.2 |
| D | 7 | 80 | 205303 | 1086.96 | 794 | 774 | 188.2 |
| D | 2 | 250 | 204759 | 1084.07 | 794 | 774 | 188.2 |
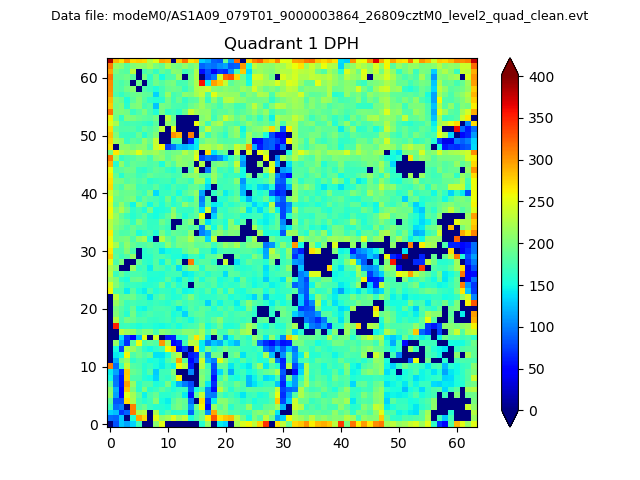
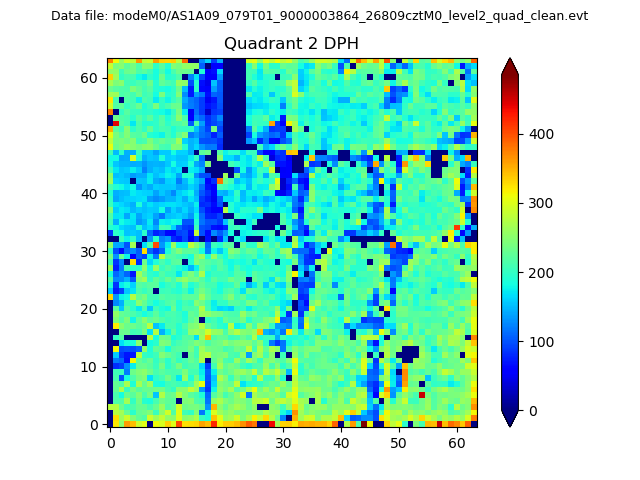
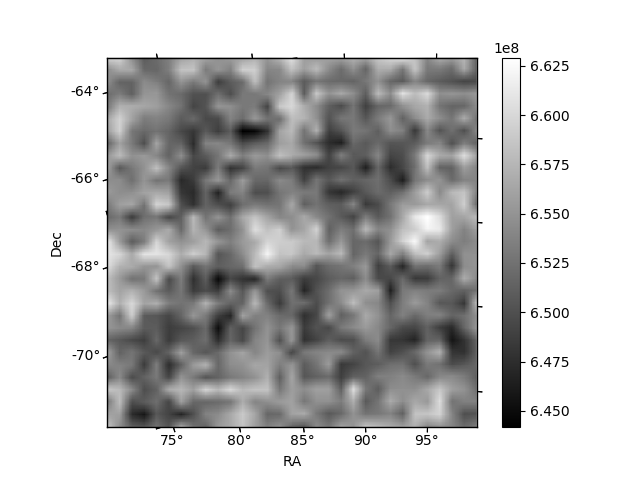
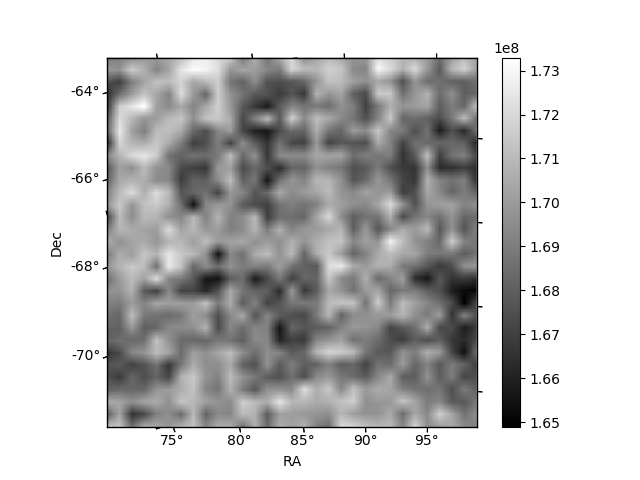
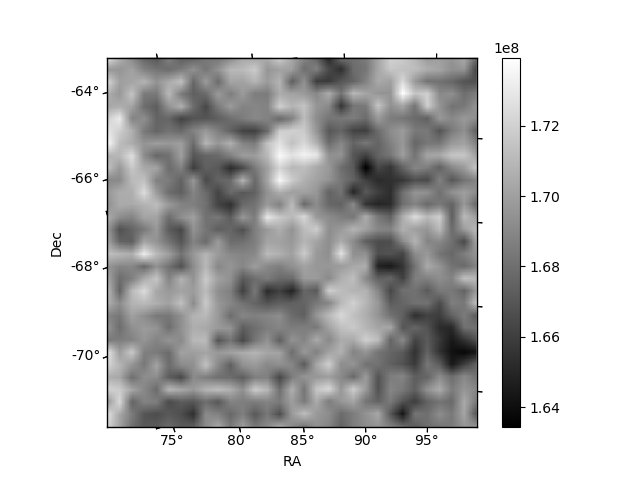
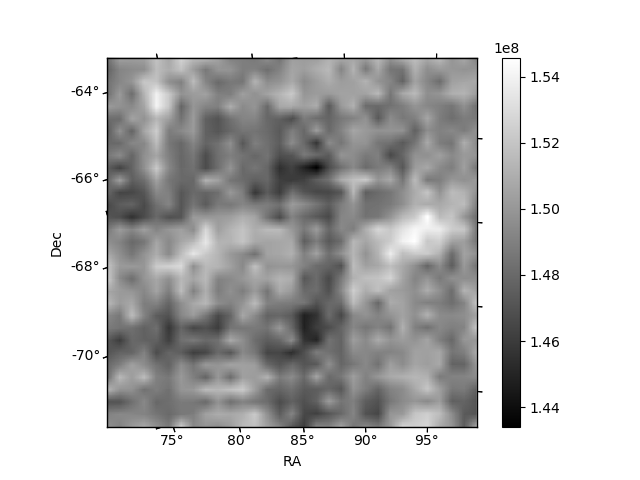
Histogram calculated using DETX and DETY for each event in the final _common_clean file
| Quadrant A | 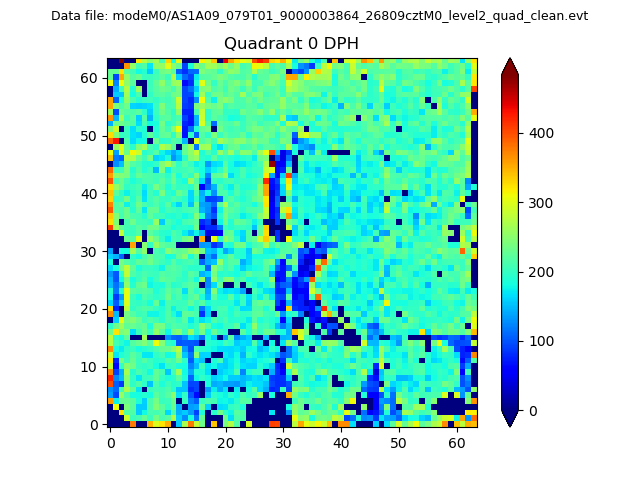 |
 |
Quadrant B |
|---|---|---|---|
| Quadrant D | 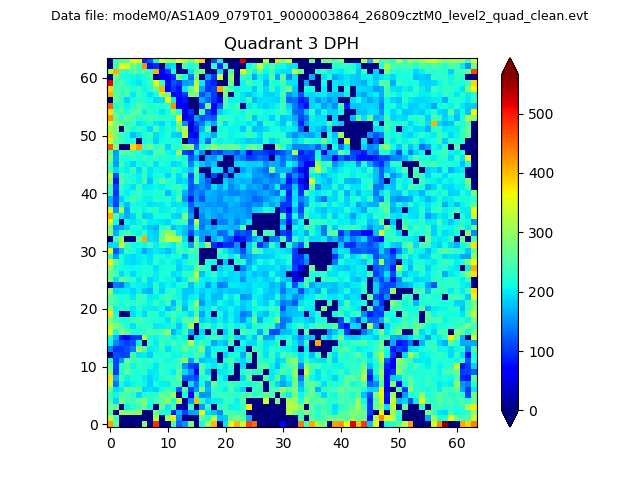 |
 |
Quadrant C |
| Plot type | Count rate plots | Images |
|---|---|---|
| Comparison with Poisson distribution Blue bars denote a histogram of data divided into 1 sec bins. Red curve is a Poisson curve with rate = median count rate of data. |
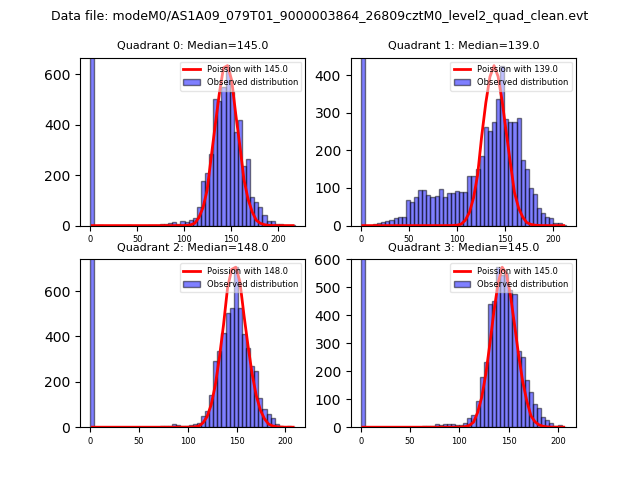 |
 |
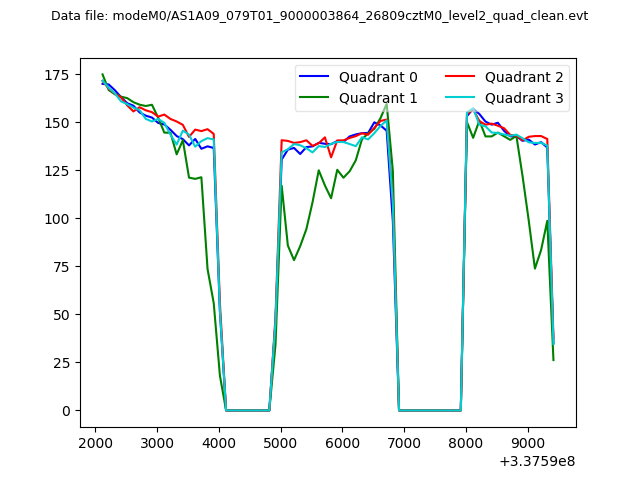
| Quadrant-wise count rates Data is divided into 100 sec bins |
 |
|
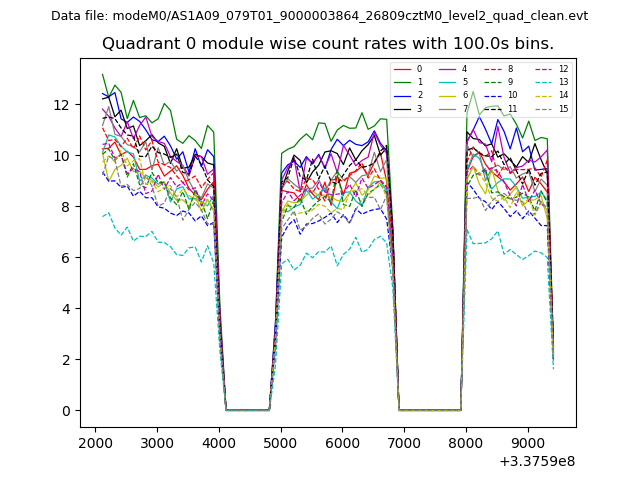
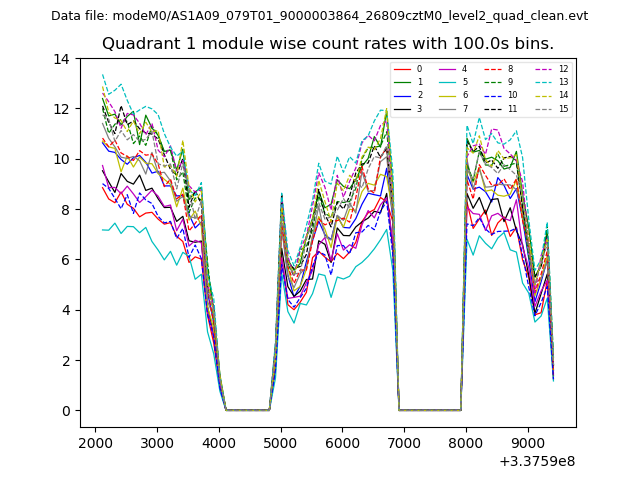
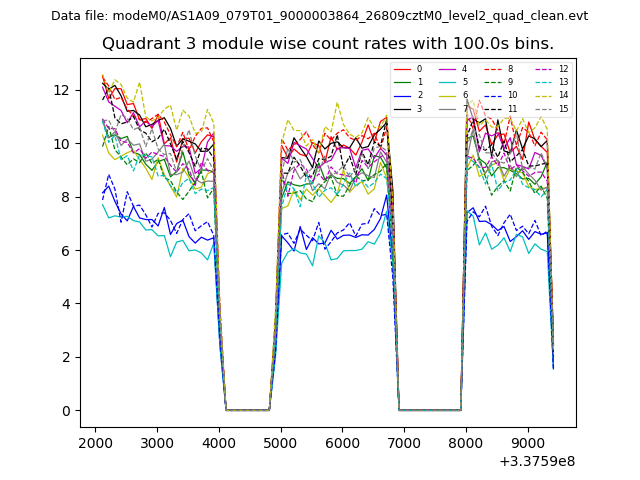
| Module-wise count rates for Quadrant A Data is divided into 100 sec bins |
 |
 |
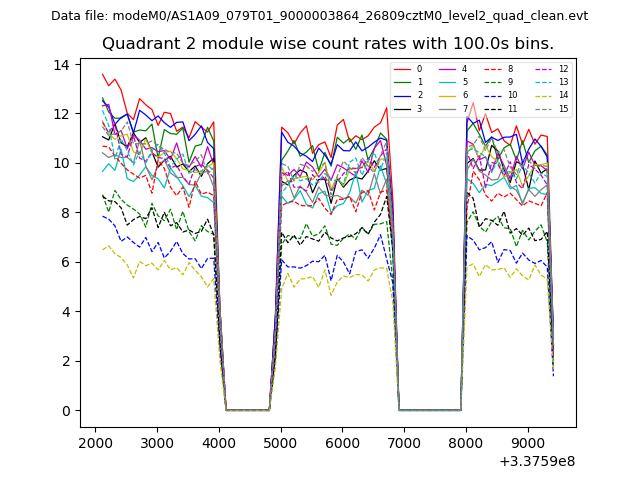
| Module-wise count rates for Quadrant B Data is divided into 100 sec bins |
 |
 |
| Module-wise count rates for Quadrant C Data is divided into 100 sec bins |
 |
 |
| Module-wise count rates for Quadrant D Data is divided into 100 sec bins |
 |
 |
| Parameter | Plot |
|---|---|
| CZT HV Monitor | 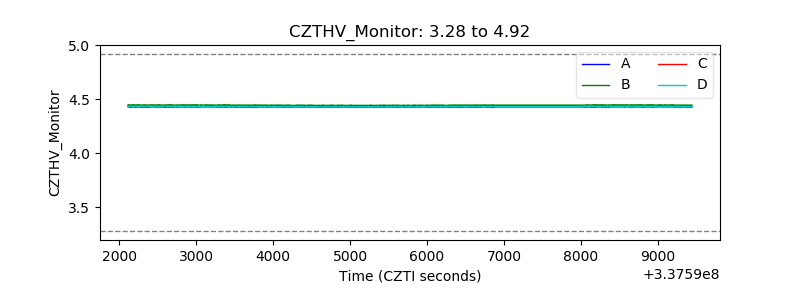 |
| D_VDD |  |
| Temperature 1 | 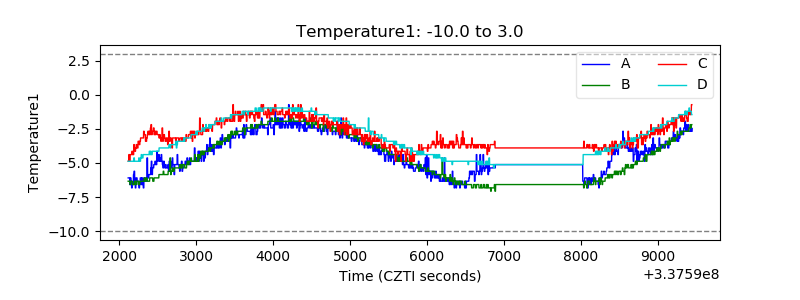 |
| Veto HV Monitor | 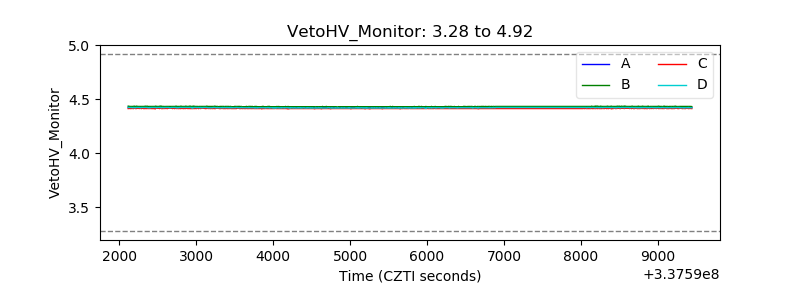 |
| Veto LLD | 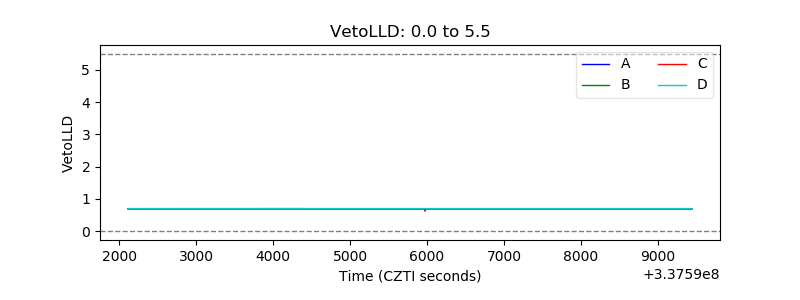 |
| Alpha Counter | 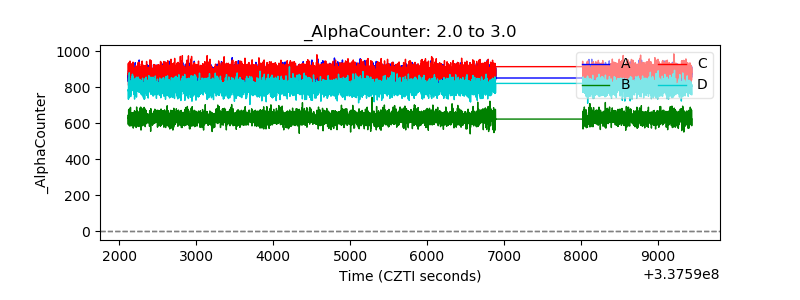 |
| _CPM_Rate | 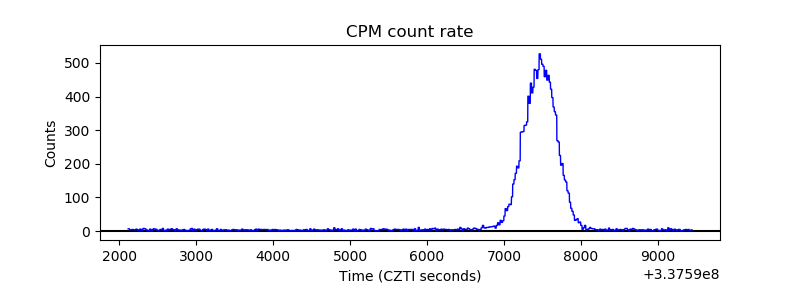 |
| CZT Counter | 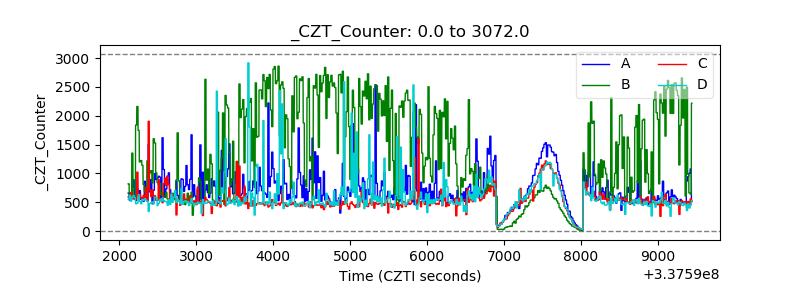 |
| +2.5 Volts monitor |  |
| +5 Volts monitor |  |
| _ROLL_ROT | 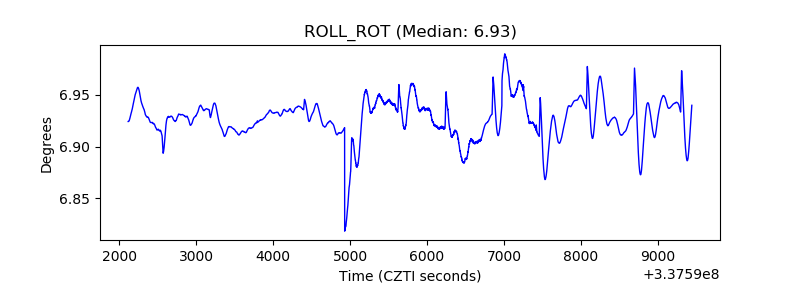 |
| _Roll_DEC |  |
| _Roll_RA | 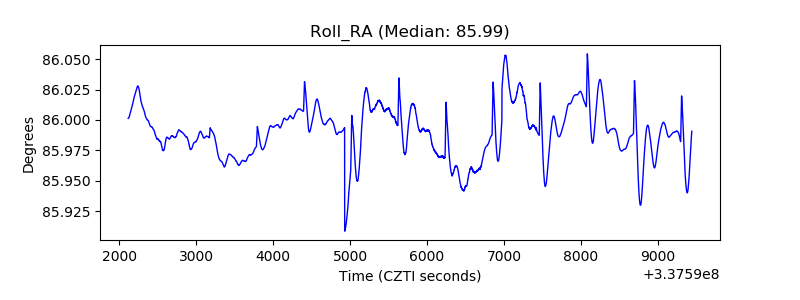 |
| Veto Counter | 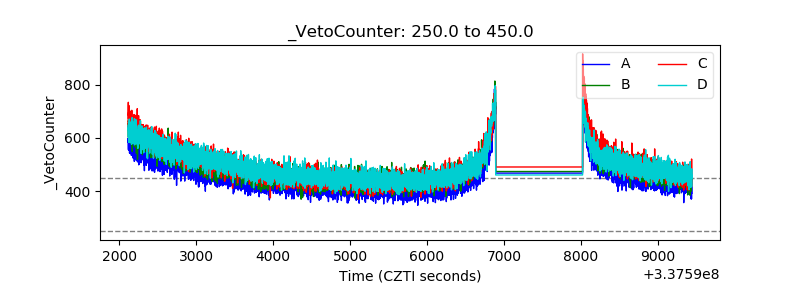 |