| Param | Original file | Final file |
|---|---|---|
| Filename | modeM0/AS1A09_079T01_9000003864_26810cztM0_level2.evt | modeM0/AS1A09_079T01_9000003864_26810cztM0_level2_quad_clean.evt |
| Size (bytes) | 808,323,840 | 99,040,320 |
| Size | 770.9 MB | 94.5 MB |
| Events in quadrant A | 4,094,795 | 690,477 |
| Events in quadrant B | 12,877,662 | 480,633 |
| Events in quadrant C | 3,164,567 | 699,215 |
| Events in quadrant D | 3,912,604 | 683,131 |
| Mode M9 | |||
|---|---|---|---|
| Quadrant | BADHDUFLAG | Total packets | Discarded packets |
| A | 0 | 8 | 0 |
| B | 0 | 8 | 0 |
| C | 0 | 8 | 0 |
| D | 0 | 8 | 0 |
| Mode M0 | |||
|---|---|---|---|
| Quadrant | BADHDUFLAG | Total packets | Discarded packets |
| A | 0 | 16374 | 0 |
| B | 0 | 42575 | 0 |
| C | 0 | 13217 | 0 |
| D | 0 | 15789 | 0 |
| Quadrant | Total seconds | Saturated seconds | Saturation percentage |
|---|---|---|---|
| A | 6365 | 100 | 1.571092% |
| B | 6366 | 4448 | 69.871191% |
| C | 6366 | 96 | 1.508011% |
| D | 6366 | 225 | 3.534402% |
Noise dominated data is calculated using 1-second bins in cleaned event files. If a bin has >2000 counts, and if more than 50% of those come from <1% of pixels, then it is considered to be noise-dominated and hence unusable.
| Quadrant | # 1 sec bins | Bins with >0 counts | Bins with >2000 counts | High rate bins dominated by noise | Noise dominated (total time) | Noise dominated (detector-on time) | Marked lightcurve |
|---|---|---|---|---|---|---|---|
| A | 7215 | 6366 | 13 | 13 | 0.18% | 0.20% | 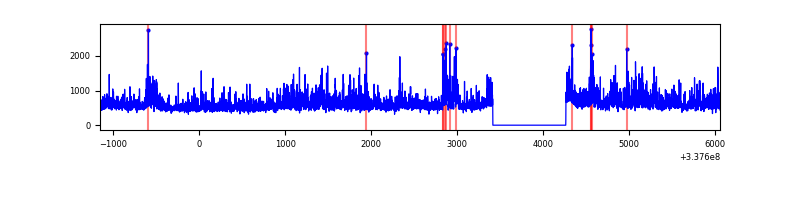 |
| B | 7215 | 6366 | 3855 | 3855 | 53.43% | 60.56% | 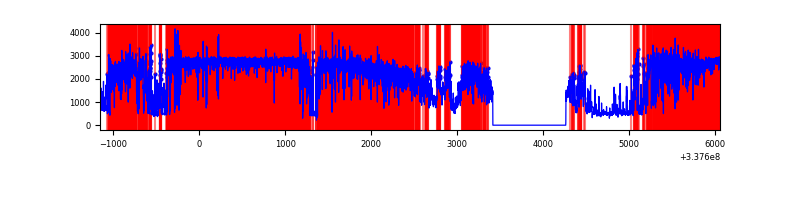 |
| C | 7216 | 6367 | 6 | 6 | 0.08% | 0.09% | 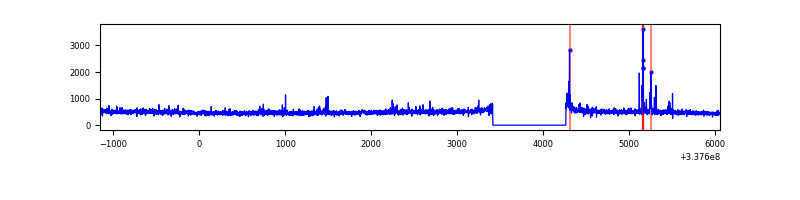 |
| D | 7216 | 6367 | 174 | 174 | 2.41% | 2.73% | 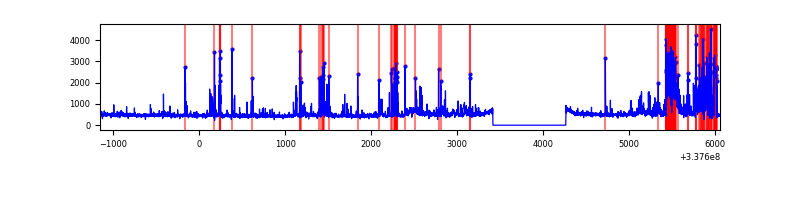 |
Top three noisy pixels from each quadrant. If the there are fewer than three noisy pixels in the level2.evt file, extra rows are filled as -1
| Pixel properties | Quadrant properties | ||||||
|---|---|---|---|---|---|---|---|
| Quadrant | DetID | PixID | Counts | Sigma | Mean | Median | Sigma |
| A | 0 | 13 | 1123750 | 7301.77 | 770 | 752 | 153.8 |
| A | 13 | 254 | 9395 | 56.2 | 770 | 752 | 153.8 |
| A | 3 | 137 | 6715 | 38.77 | 770 | 752 | 153.8 |
| B | 0 | 189 | 10815637 | 114405.35 | 504 | 491 | 94.5 |
| B | 10 | 246 | 27872 | 289.64 | 504 | 491 | 94.5 |
| B | 3 | 64 | 23186 | 240.07 | 504 | 491 | 94.5 |
| C | 14 | 238 | 122042 | 689.56 | 753 | 758 | 175.9 |
| C | 15 | 208 | 78431 | 441.61 | 753 | 758 | 175.9 |
| C | 3 | 233 | 22805 | 125.35 | 753 | 758 | 175.9 |
| D | 7 | 80 | 751610 | 4193.28 | 753 | 734 | 179.1 |
| D | 2 | 250 | 171441 | 953.32 | 753 | 734 | 179.1 |
| D | 1 | 52 | 101445 | 562.42 | 753 | 734 | 179.1 |
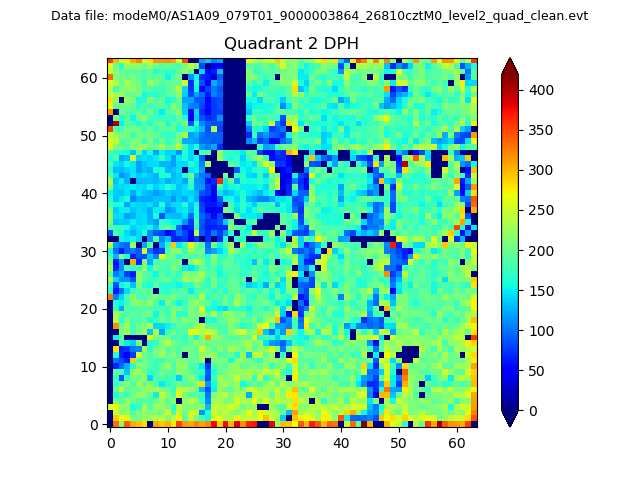
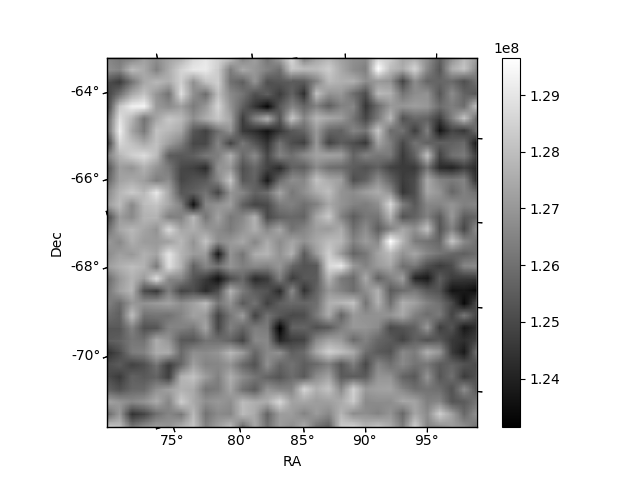
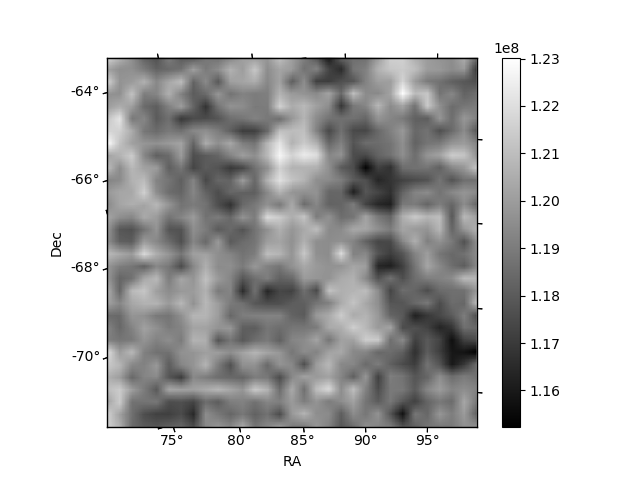
Histogram calculated using DETX and DETY for each event in the final _common_clean file
| Quadrant A | 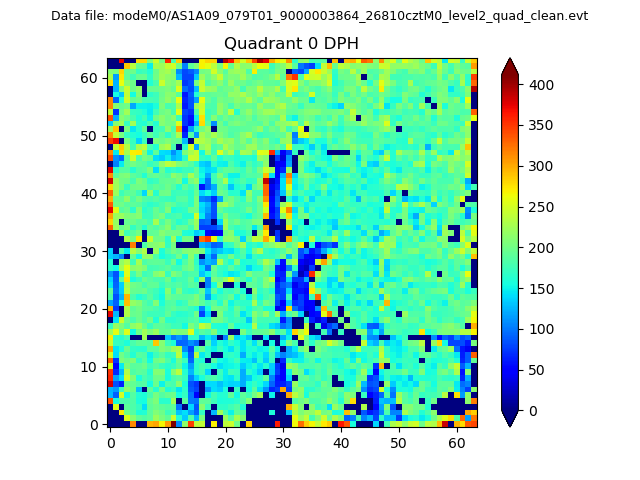 |
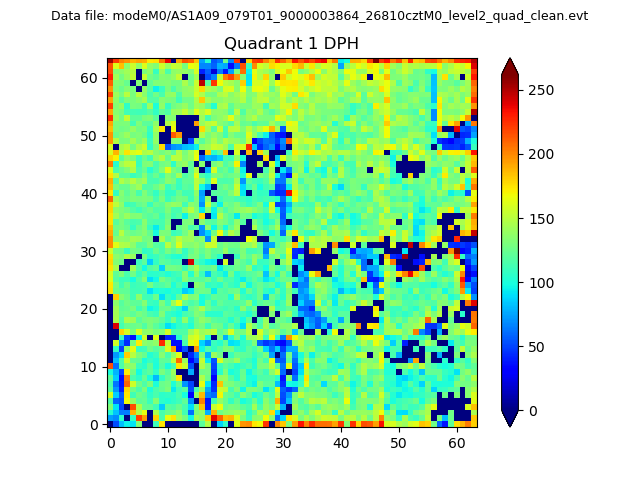 |
Quadrant B |
|---|---|---|---|
| Quadrant D | 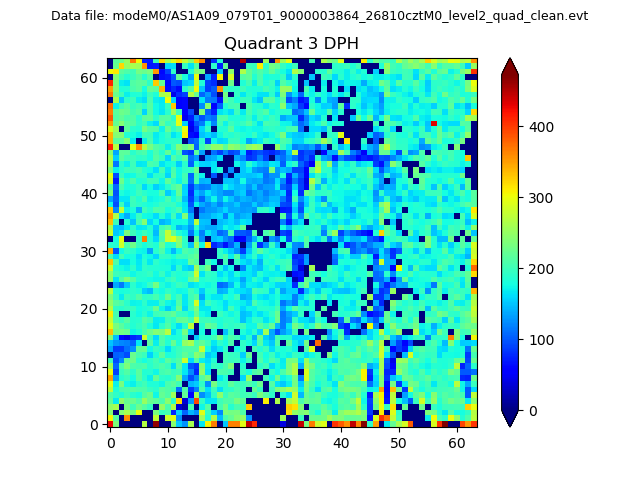 |
 |
Quadrant C |
| Plot type | Count rate plots | Images |
|---|---|---|
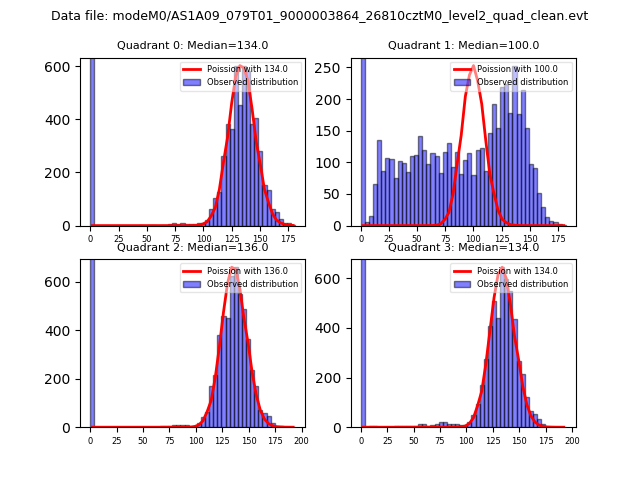
| Comparison with Poisson distribution Blue bars denote a histogram of data divided into 1 sec bins. Red curve is a Poisson curve with rate = median count rate of data. |
 |
 |
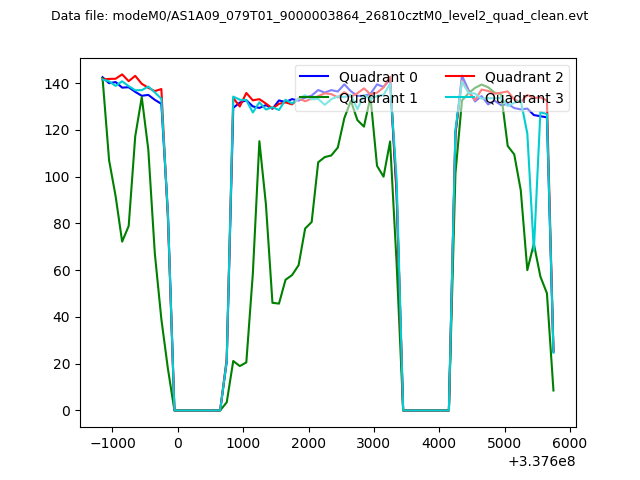
| Quadrant-wise count rates Data is divided into 100 sec bins |
 |
|
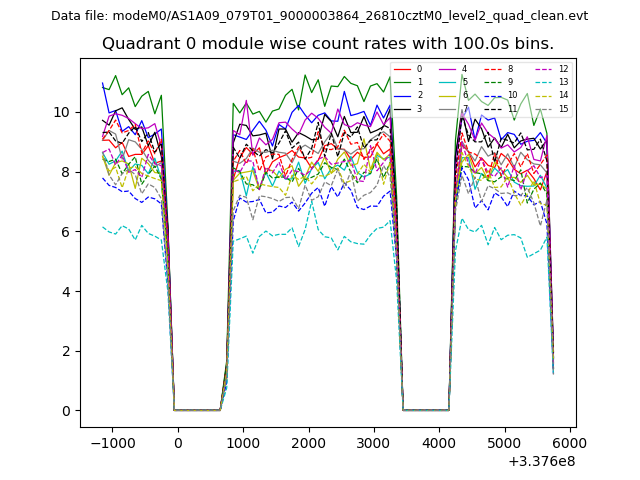
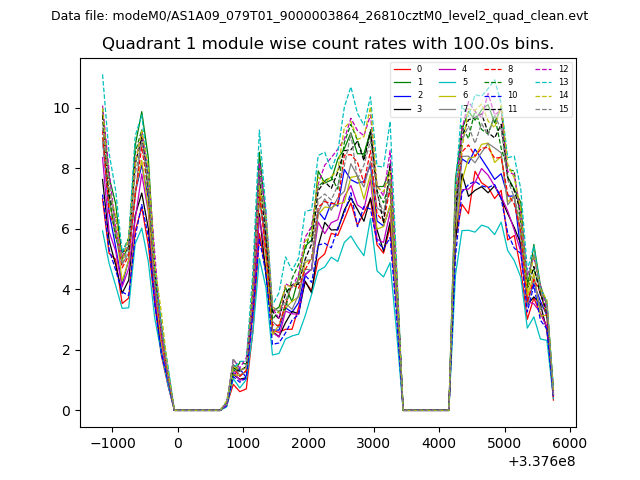
| Module-wise count rates for Quadrant A Data is divided into 100 sec bins |
 |
 |
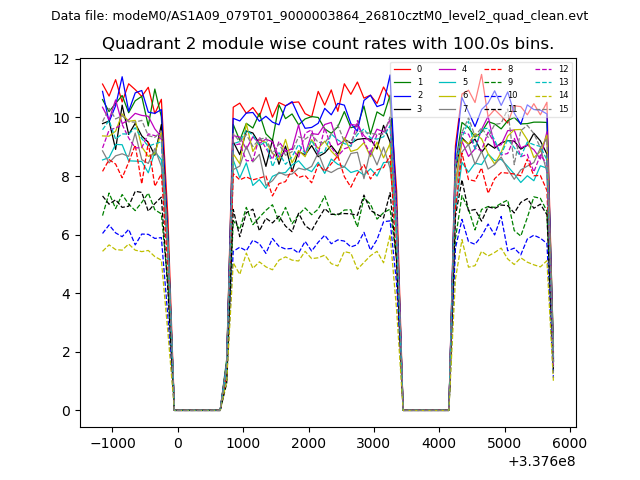
| Module-wise count rates for Quadrant B Data is divided into 100 sec bins |
 |
 |
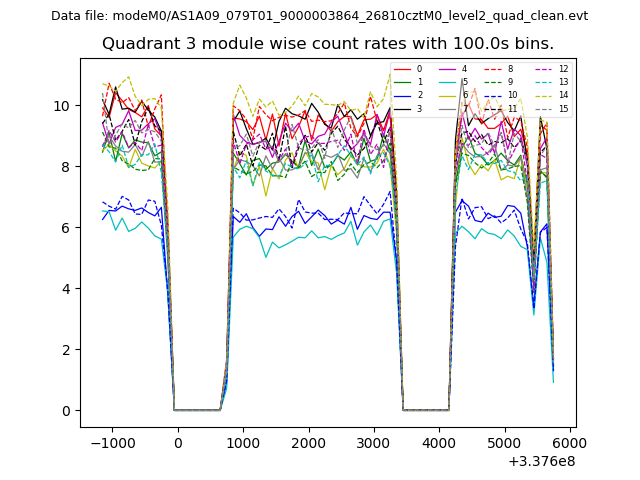
| Module-wise count rates for Quadrant C Data is divided into 100 sec bins |
 |
 |
| Module-wise count rates for Quadrant D Data is divided into 100 sec bins |
 |
 |
| Parameter | Plot |
|---|---|
| CZT HV Monitor | 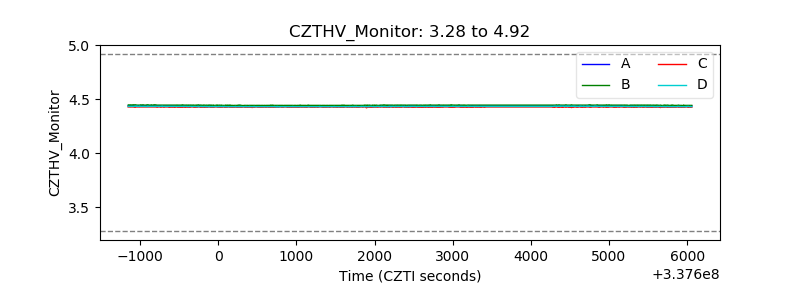 |
| D_VDD | 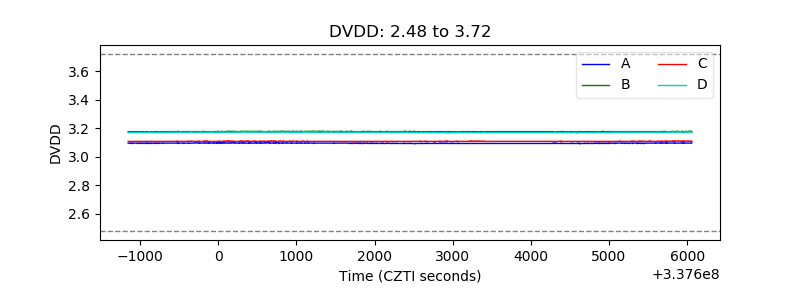 |
| Temperature 1 | 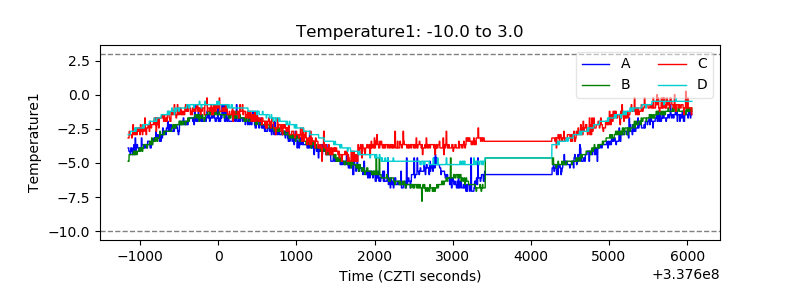 |
| Veto HV Monitor | 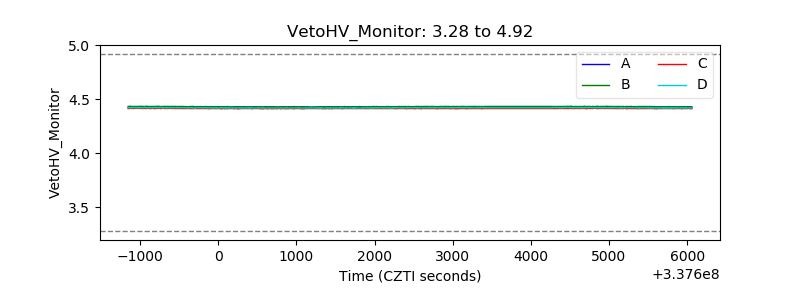 |
| Veto LLD | 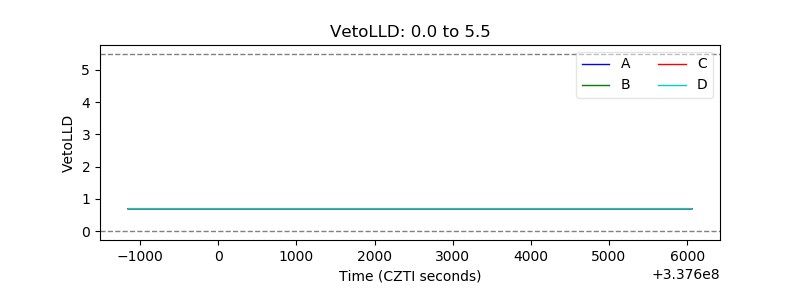 |
| Alpha Counter | 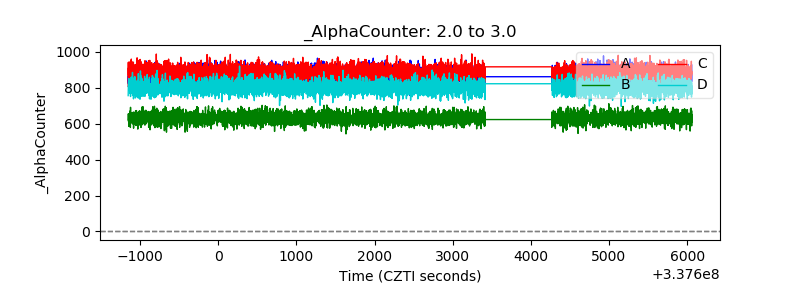 |
| _CPM_Rate | 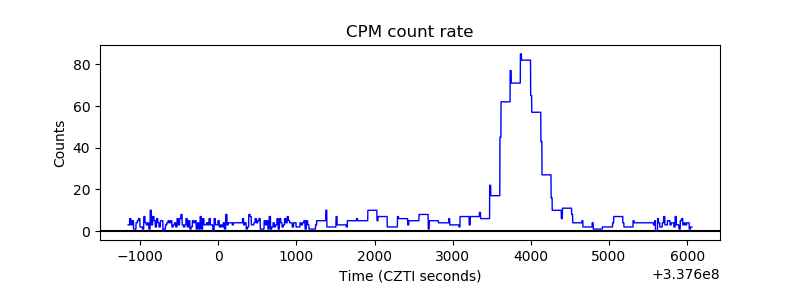 |
| CZT Counter | 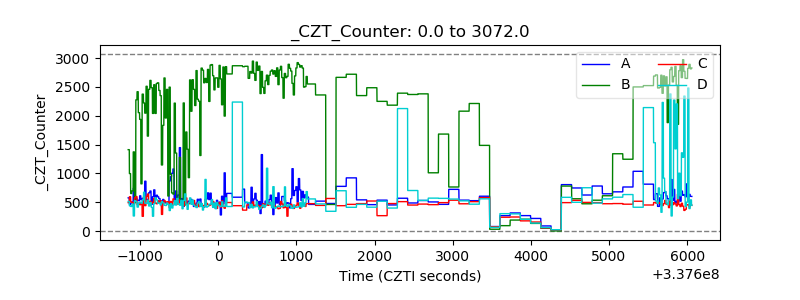 |
| +2.5 Volts monitor |  |
| +5 Volts monitor |  |
| _ROLL_ROT | 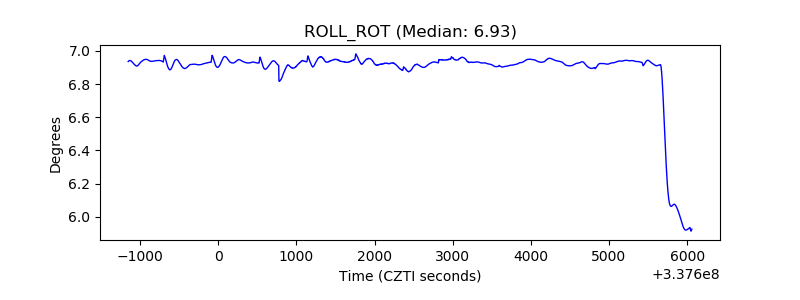 |
| _Roll_DEC | 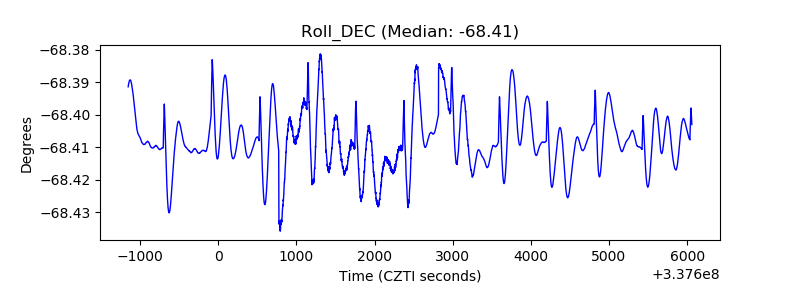 |
| _Roll_RA | 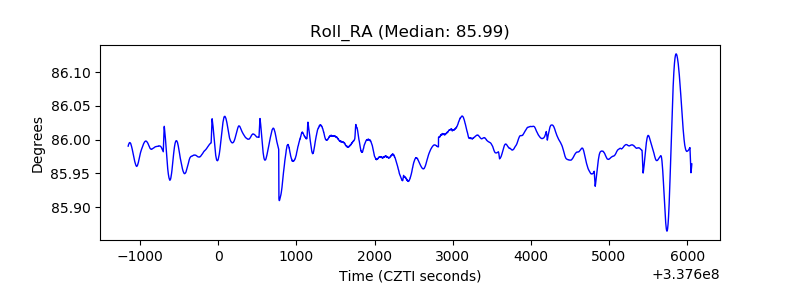 |
| Veto Counter | 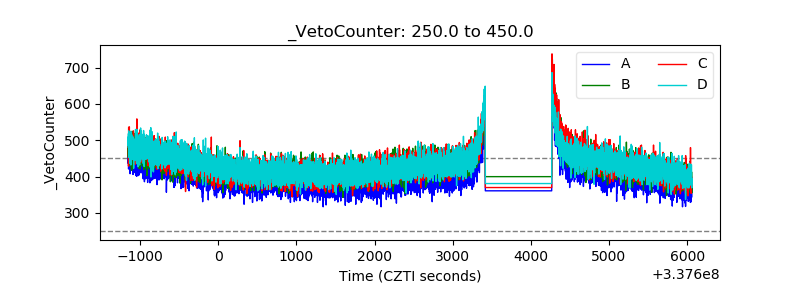 |