| Param | Original file | Final file |
|---|---|---|
| Filename | modeM0/AS1A09_079T01_9000003864_26811cztM0_level2.evt | modeM0/AS1A09_079T01_9000003864_26811cztM0_level2_quad_clean.evt |
| Size (bytes) | 723,009,600 | 95,955,840 |
| Size | 689.5 MB | 91.5 MB |
| Events in quadrant A | 4,039,116 | 636,011 |
| Events in quadrant B | 9,758,214 | 555,682 |
| Events in quadrant C | 3,137,552 | 642,695 |
| Events in quadrant D | 4,526,580 | 622,299 |
| Mode M9 | |||
|---|---|---|---|
| Quadrant | BADHDUFLAG | Total packets | Discarded packets |
| A | 0 | 3 | 0 |
| B | 0 | 3 | 0 |
| C | 0 | 3 | 0 |
| D | 0 | 3 | 0 |
| Mode M0 | |||
|---|---|---|---|
| Quadrant | BADHDUFLAG | Total packets | Discarded packets |
| A | 0 | 16145 | 0 |
| B | 0 | 33282 | 0 |
| C | 0 | 13417 | 0 |
| D | 0 | 17773 | 0 |
| Quadrant | Total seconds | Saturated seconds | Saturation percentage |
|---|---|---|---|
| A | 6421 | 174 | 2.709858% |
| B | 6421 | 2970 | 46.254477% |
| C | 6421 | 169 | 2.631989% |
| D | 6422 | 368 | 5.730302% |
Noise dominated data is calculated using 1-second bins in cleaned event files. If a bin has >2000 counts, and if more than 50% of those come from <1% of pixels, then it is considered to be noise-dominated and hence unusable.
| Quadrant | # 1 sec bins | Bins with >0 counts | Bins with >2000 counts | High rate bins dominated by noise | Noise dominated (total time) | Noise dominated (detector-on time) | Marked lightcurve |
|---|---|---|---|---|---|---|---|
| A | 6761 | 6422 | 2 | 2 | 0.03% | 0.03% | 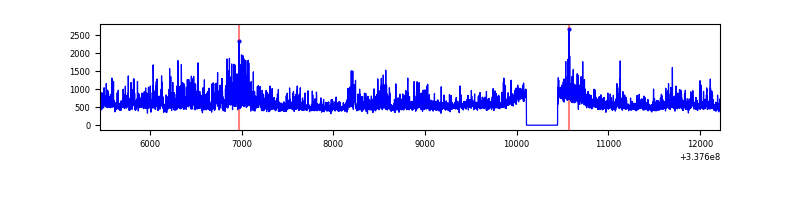 |
| B | 6761 | 6422 | 2548 | 2548 | 37.69% | 39.68% | 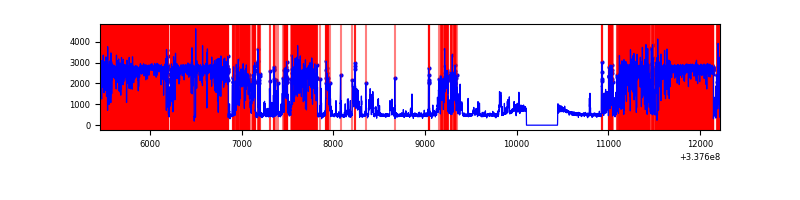 |
| C | 6761 | 6422 | 1 | 1 | 0.01% | 0.02% | 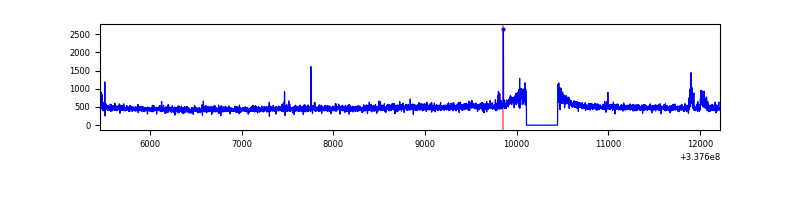 |
| D | 6762 | 6423 | 195 | 195 | 2.88% | 3.04% | 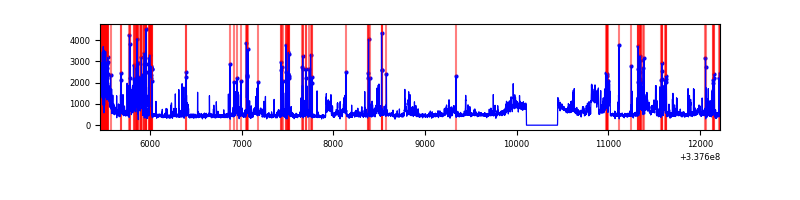 |
Top three noisy pixels from each quadrant. If the there are fewer than three noisy pixels in the level2.evt file, extra rows are filled as -1
| Pixel properties | Quadrant properties | ||||||
|---|---|---|---|---|---|---|---|
| Quadrant | DetID | PixID | Counts | Sigma | Mean | Median | Sigma |
| A | 0 | 13 | 1024288 | 6554.45 | 776 | 758 | 156.2 |
| A | 6 | 16 | 16221 | 99.02 | 776 | 758 | 156.2 |
| A | 13 | 254 | 10397 | 61.72 | 776 | 758 | 156.2 |
| B | 0 | 189 | 7280880 | 62540.54 | 604 | 587 | 116.4 |
| B | 10 | 246 | 65207 | 555.11 | 604 | 587 | 116.4 |
| B | 3 | 112 | 22185 | 185.54 | 604 | 587 | 116.4 |
| C | 14 | 238 | 119224 | 668.04 | 756 | 757 | 177.3 |
| C | 3 | 233 | 46979 | 260.64 | 756 | 757 | 177.3 |
| C | 15 | 208 | 19411 | 105.19 | 756 | 757 | 177.3 |
| D | 7 | 80 | 1162959 | 6472.19 | 755 | 736 | 179.6 |
| D | 2 | 250 | 381852 | 2122.36 | 755 | 736 | 179.6 |
| D | 1 | 52 | 78441 | 432.72 | 755 | 736 | 179.6 |
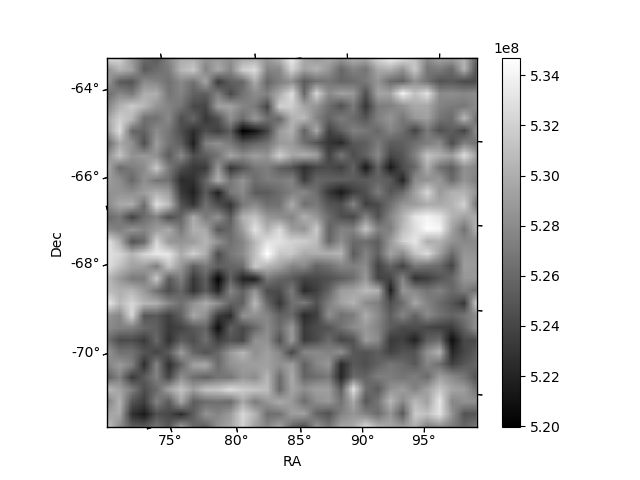
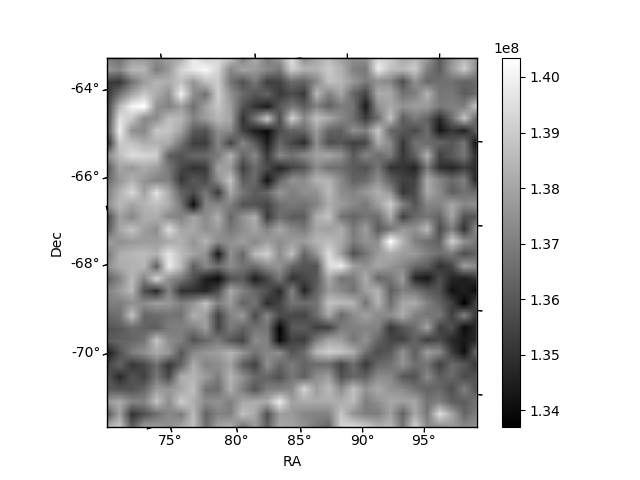
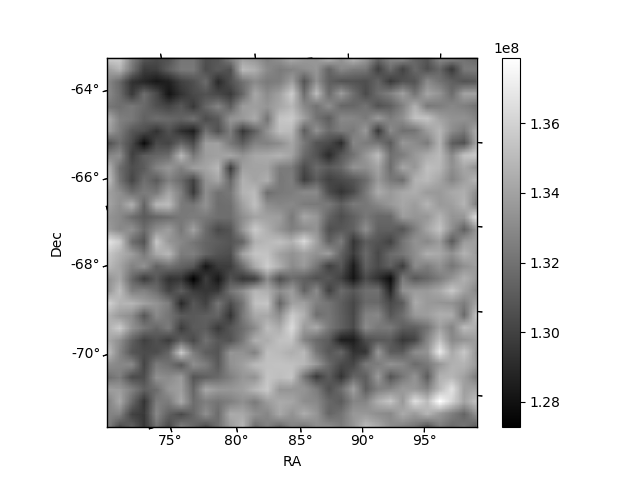
Histogram calculated using DETX and DETY for each event in the final _common_clean file
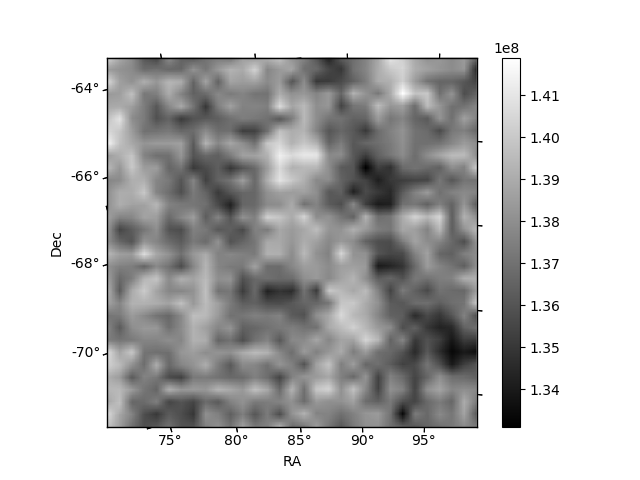
| Quadrant A | 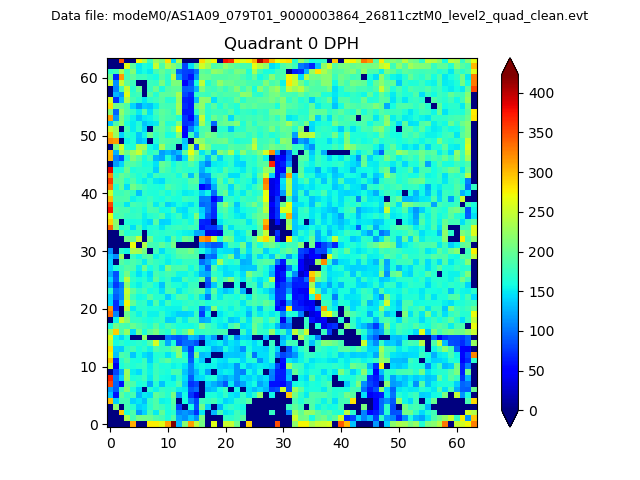 |
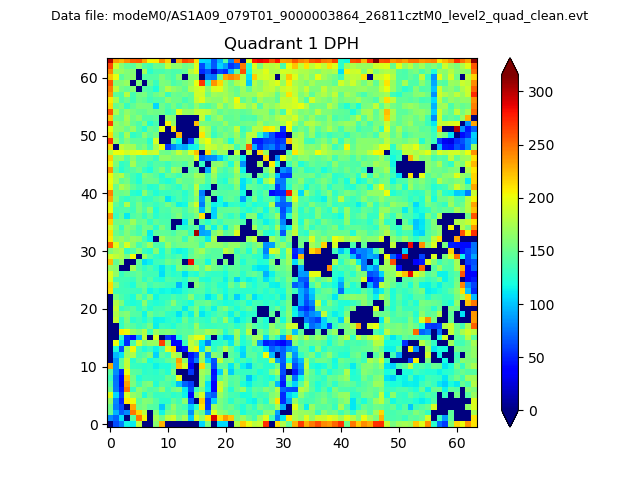 |
Quadrant B |
|---|---|---|---|
| Quadrant D | 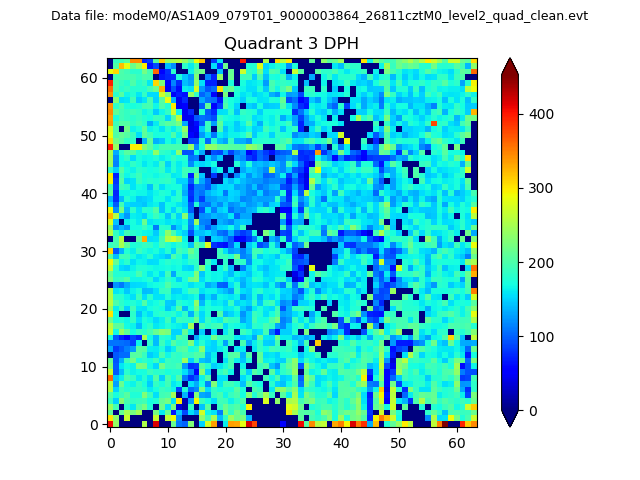 |
 |
Quadrant C |
| Plot type | Count rate plots | Images |
|---|---|---|
| Comparison with Poisson distribution Blue bars denote a histogram of data divided into 1 sec bins. Red curve is a Poisson curve with rate = median count rate of data. |
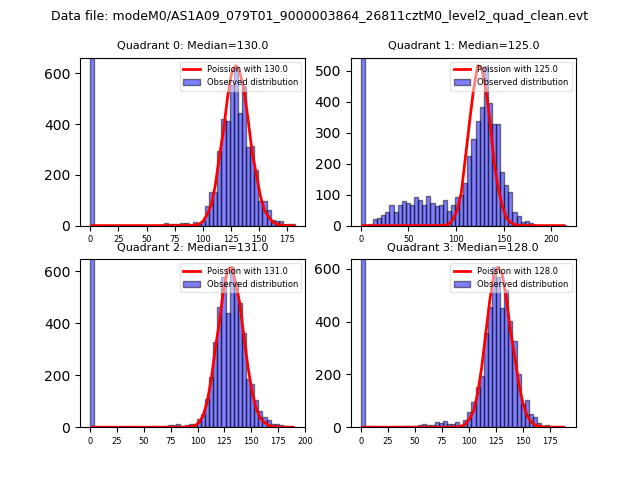 |
 |
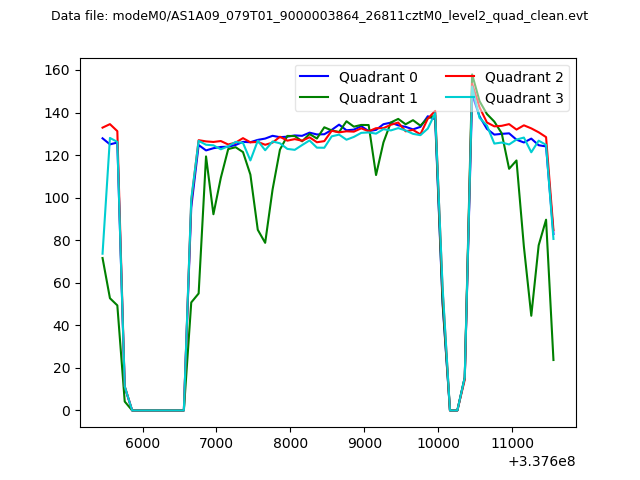
| Quadrant-wise count rates Data is divided into 100 sec bins |
 |
|
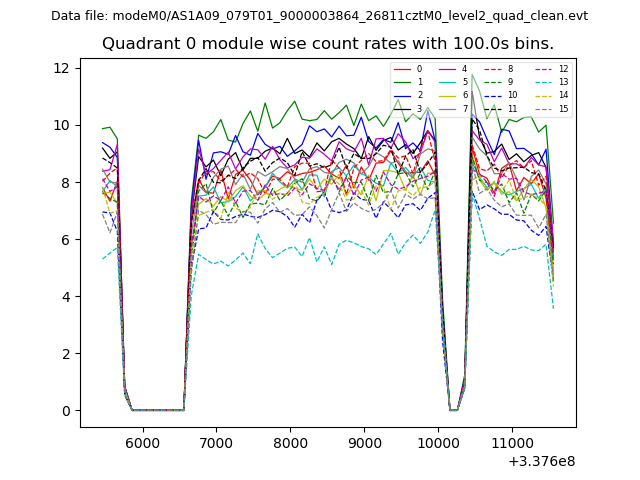
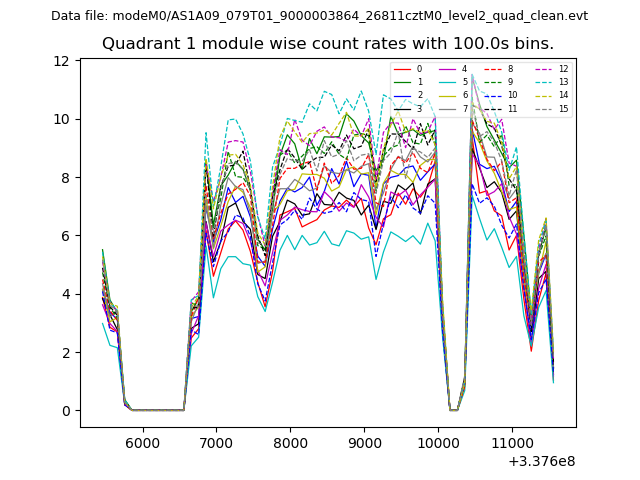
| Module-wise count rates for Quadrant A Data is divided into 100 sec bins |
 |
 |
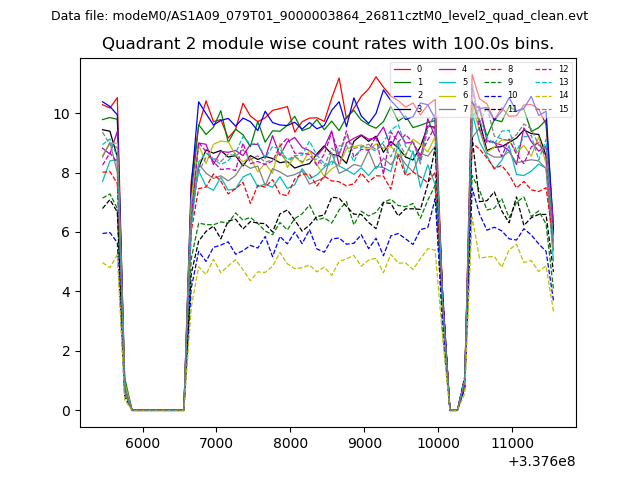
| Module-wise count rates for Quadrant B Data is divided into 100 sec bins |
 |
 |
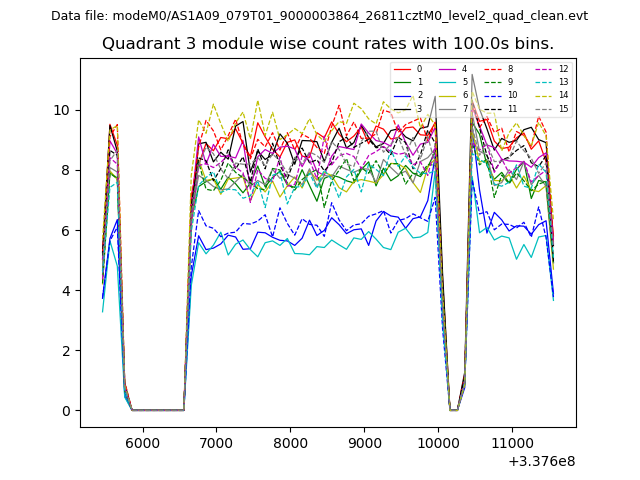
| Module-wise count rates for Quadrant C Data is divided into 100 sec bins |
 |
 |
| Module-wise count rates for Quadrant D Data is divided into 100 sec bins |
 |
 |
| Parameter | Plot |
|---|---|
| CZT HV Monitor | 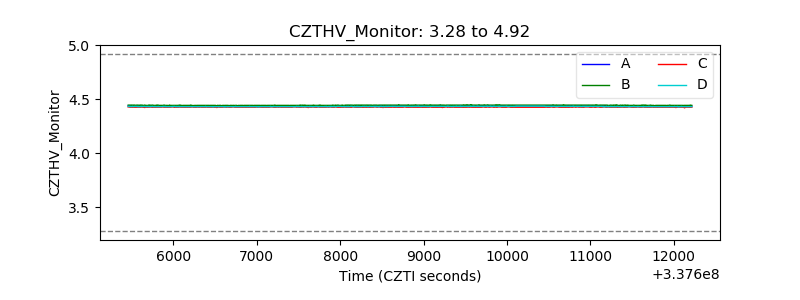 |
| D_VDD |  |
| Temperature 1 | 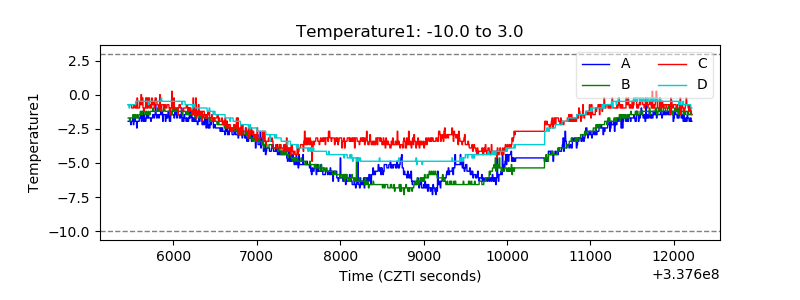 |
| Veto HV Monitor | 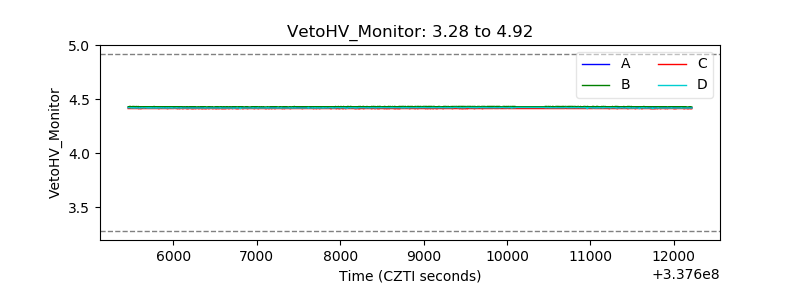 |
| Veto LLD | 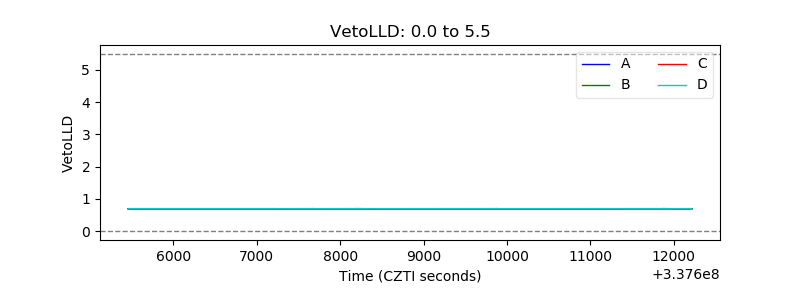 |
| Alpha Counter |  |
| _CPM_Rate | 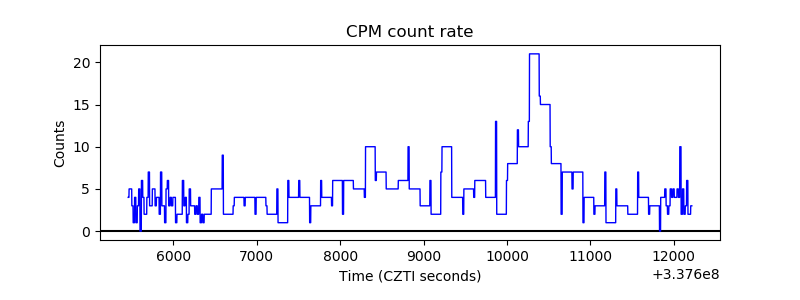 |
| CZT Counter |  |
| +2.5 Volts monitor |  |
| +5 Volts monitor |  |
| _ROLL_ROT | 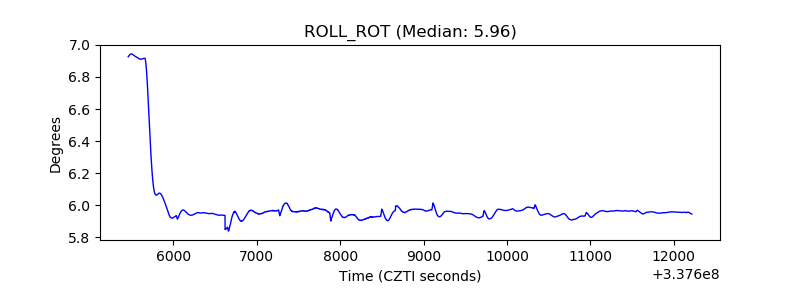 |
| _Roll_DEC | 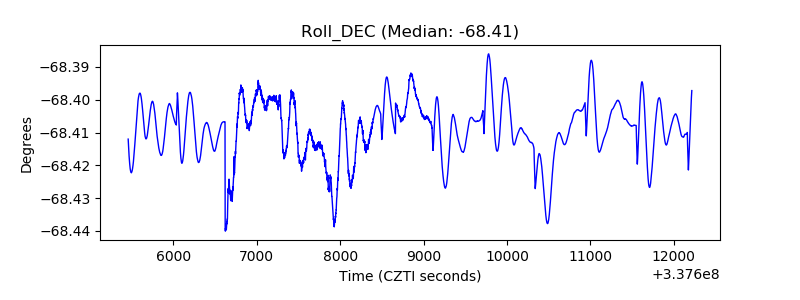 |
| _Roll_RA | 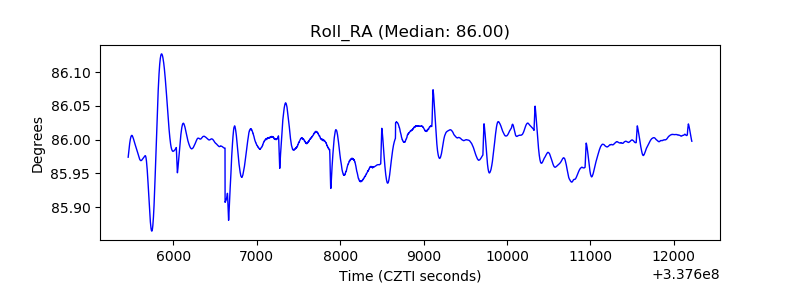 |
| Veto Counter | 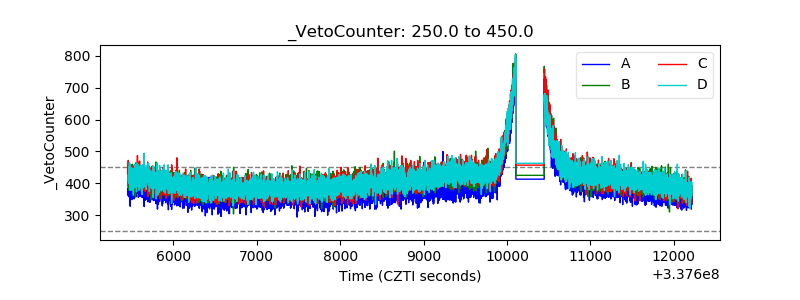 |