| Param | Original file | Final file |
|---|---|---|
| Filename | modeM0/AS1A09_079T01_9000003864_26812cztM0_level2.evt | modeM0/AS1A09_079T01_9000003864_26812cztM0_level2_quad_clean.evt |
| Size (bytes) | 798,903,360 | 94,682,880 |
| Size | 761.9 MB | 90.3 MB |
| Events in quadrant A | 4,600,962 | 627,939 |
| Events in quadrant B | 8,225,783 | 590,780 |
| Events in quadrant C | 3,406,861 | 633,230 |
| Events in quadrant D | 7,505,528 | 544,113 |
| Mode M9 | |||
|---|---|---|---|
| Quadrant | BADHDUFLAG | Total packets | Discarded packets |
| A | 0 | 2 | 0 |
| B | 0 | 2 | 0 |
| C | 0 | 2 | 0 |
| D | 0 | 2 | 0 |
| Mode M0 | |||
|---|---|---|---|
| Quadrant | BADHDUFLAG | Total packets | Discarded packets |
| A | 0 | 18195 | 0 |
| B | 0 | 28924 | 0 |
| C | 0 | 14341 | 0 |
| D | 0 | 26869 | 0 |
| Quadrant | Total seconds | Saturated seconds | Saturation percentage |
|---|---|---|---|
| A | 6741 | 232 | 3.441626% |
| B | 6741 | 2339 | 34.698116% |
| C | 6741 | 177 | 2.625723% |
| D | 6741 | 1389 | 20.605251% |
Noise dominated data is calculated using 1-second bins in cleaned event files. If a bin has >2000 counts, and if more than 50% of those come from <1% of pixels, then it is considered to be noise-dominated and hence unusable.
| Quadrant | # 1 sec bins | Bins with >0 counts | Bins with >2000 counts | High rate bins dominated by noise | Noise dominated (total time) | Noise dominated (detector-on time) | Marked lightcurve |
|---|---|---|---|---|---|---|---|
| A | 6911 | 6742 | 46 | 46 | 0.67% | 0.68% | 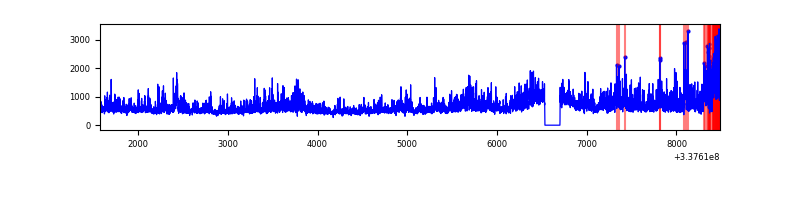 |
| B | 6910 | 6741 | 1968 | 1968 | 28.48% | 29.19% | 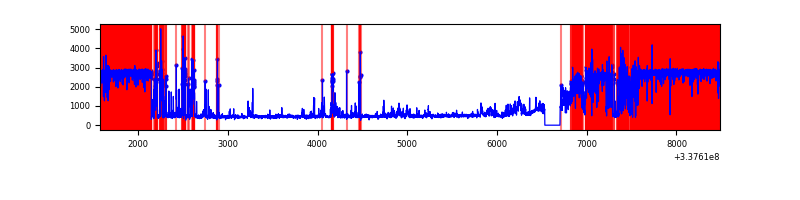 |
| C | 6911 | 6742 | 15 | 15 | 0.22% | 0.22% | 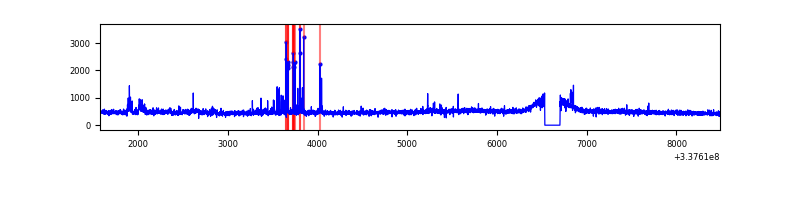 |
| D | 6911 | 6741 | 1026 | 1026 | 14.85% | 15.22% | 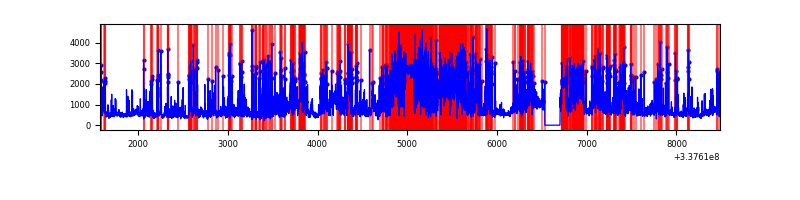 |
Top three noisy pixels from each quadrant. If the there are fewer than three noisy pixels in the level2.evt file, extra rows are filled as -1
| Pixel properties | Quadrant properties | ||||||
|---|---|---|---|---|---|---|---|
| Quadrant | DetID | PixID | Counts | Sigma | Mean | Median | Sigma |
| A | 0 | 13 | 1458509 | 8974.39 | 810 | 790 | 162.4 |
| A | 13 | 254 | 10601 | 60.4 | 810 | 790 | 162.4 |
| A | 6 | 16 | 9733 | 55.06 | 810 | 790 | 162.4 |
| B | 0 | 189 | 5616382 | 45369.0 | 645 | 629 | 123.8 |
| B | 10 | 246 | 22958 | 180.39 | 645 | 629 | 123.8 |
| B | 0 | 229 | 18326 | 142.97 | 645 | 629 | 123.8 |
| C | 14 | 238 | 124898 | 672.67 | 788 | 790 | 184.5 |
| C | 3 | 233 | 99067 | 532.67 | 788 | 790 | 184.5 |
| C | 15 | 208 | 97377 | 523.51 | 788 | 790 | 184.5 |
| D | 7 | 80 | 3013654 | 17106.91 | 734 | 715 | 176.1 |
| D | 1 | 52 | 1171894 | 6649.74 | 734 | 715 | 176.1 |
| D | 2 | 250 | 465351 | 2638.12 | 734 | 715 | 176.1 |
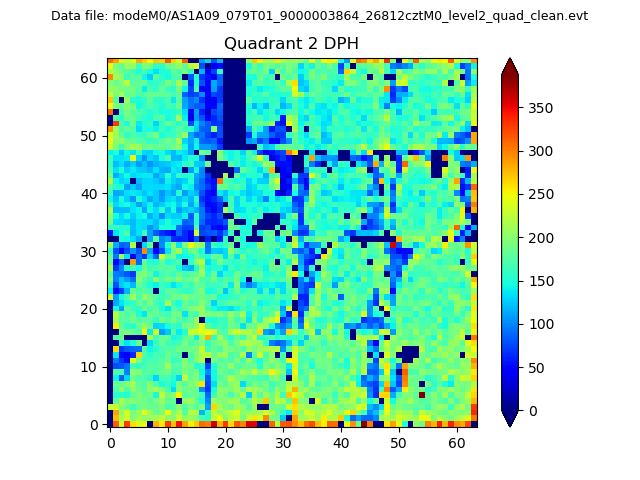
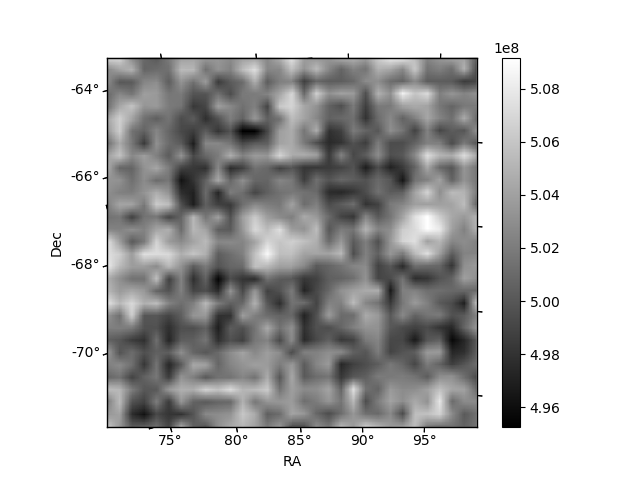
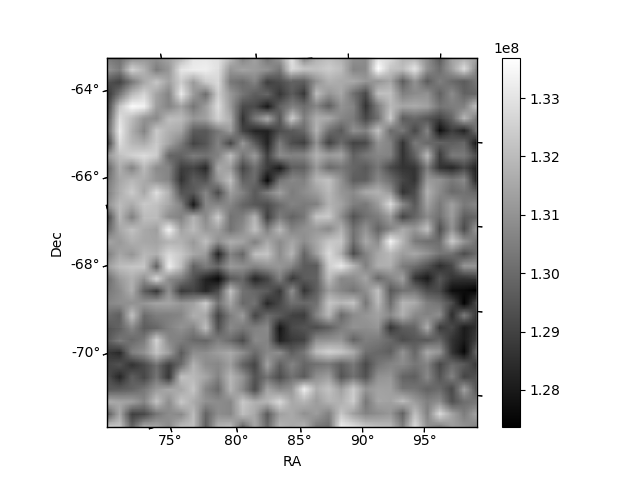
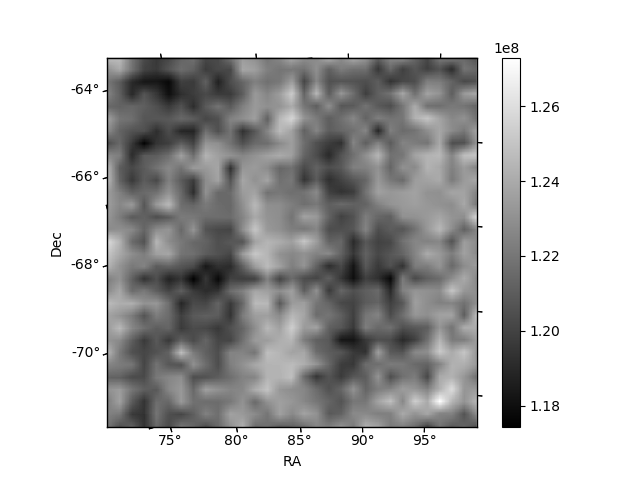
Histogram calculated using DETX and DETY for each event in the final _common_clean file
| Quadrant A | 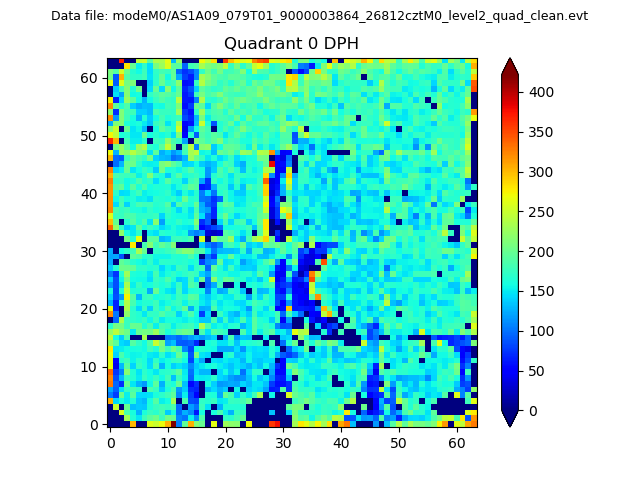 |
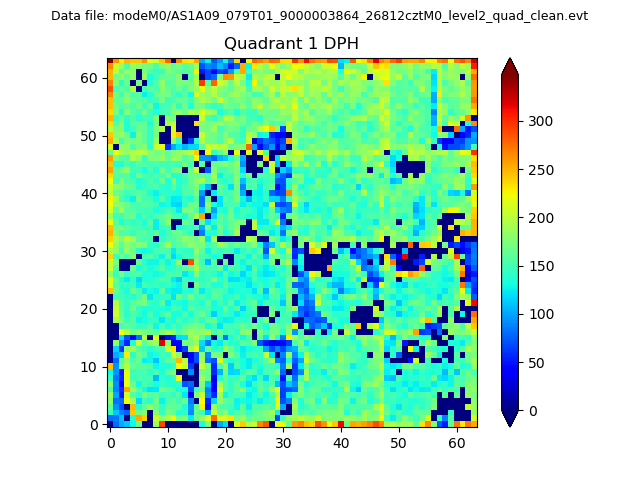 |
Quadrant B |
|---|---|---|---|
| Quadrant D | 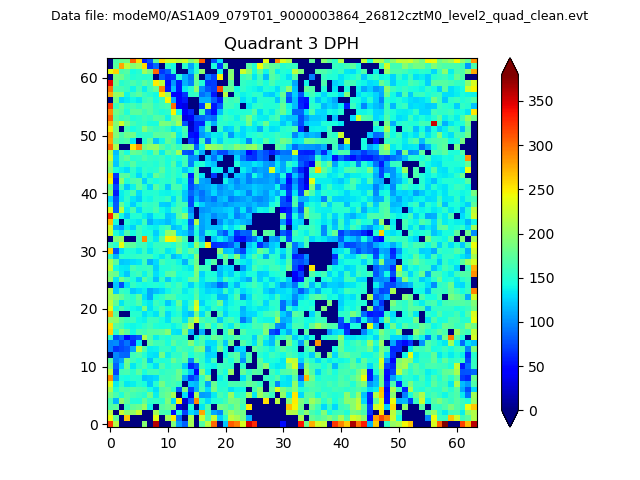 |
 |
Quadrant C |
| Plot type | Count rate plots | Images |
|---|---|---|
| Comparison with Poisson distribution Blue bars denote a histogram of data divided into 1 sec bins. Red curve is a Poisson curve with rate = median count rate of data. |
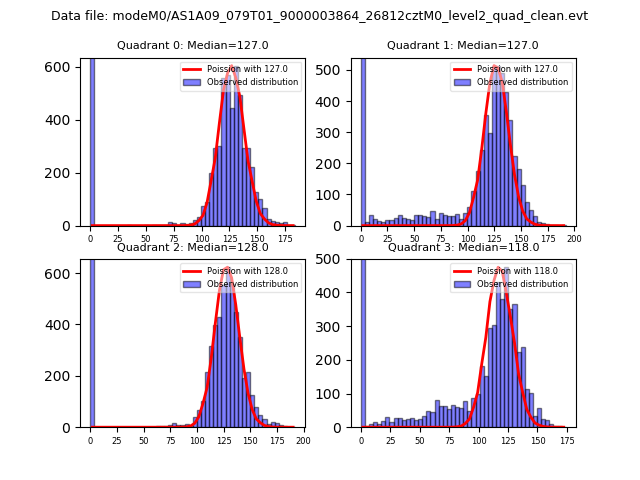 |
 |
| Quadrant-wise count rates Data is divided into 100 sec bins |
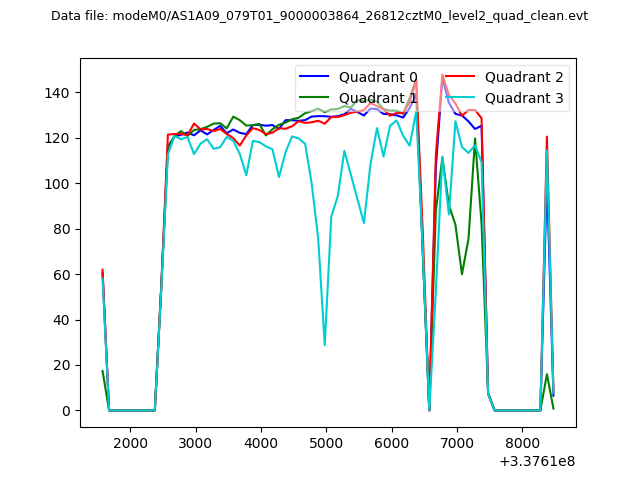 |
|
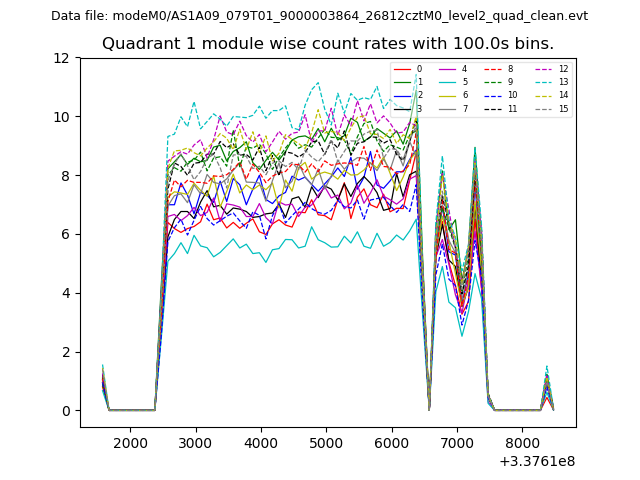
| Module-wise count rates for Quadrant A Data is divided into 100 sec bins |
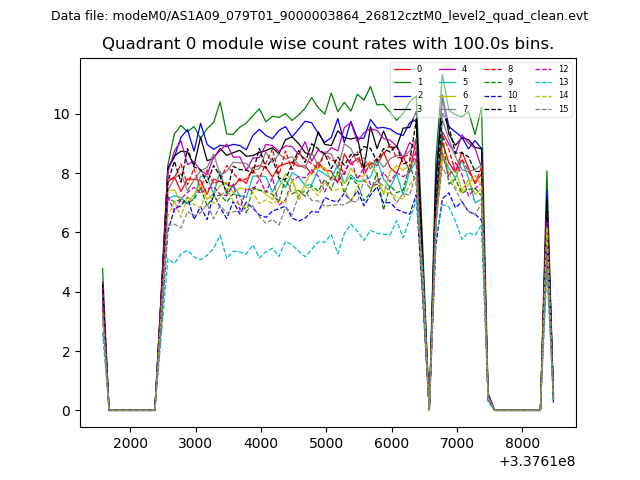 |
 |
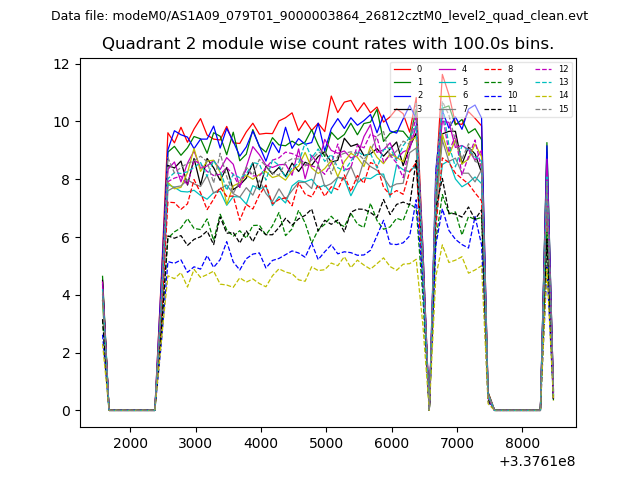
| Module-wise count rates for Quadrant B Data is divided into 100 sec bins |
 |
 |
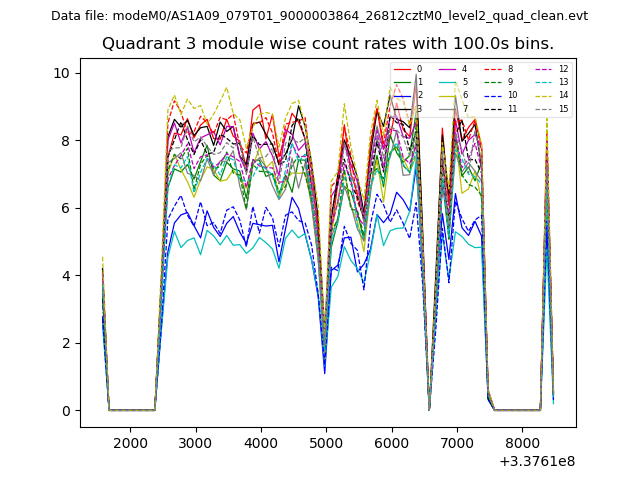
| Module-wise count rates for Quadrant C Data is divided into 100 sec bins |
 |
 |
| Module-wise count rates for Quadrant D Data is divided into 100 sec bins |
 |
 |
| Parameter | Plot |
|---|---|
| CZT HV Monitor | 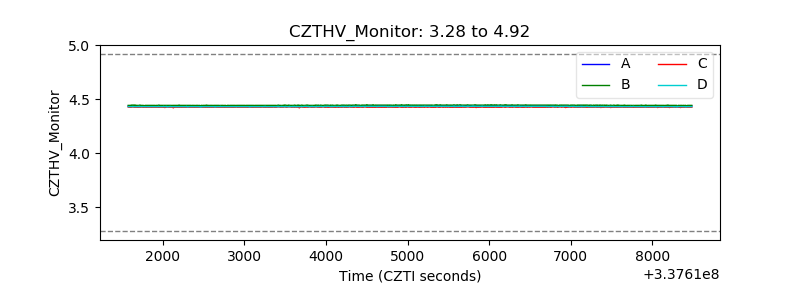 |
| D_VDD | 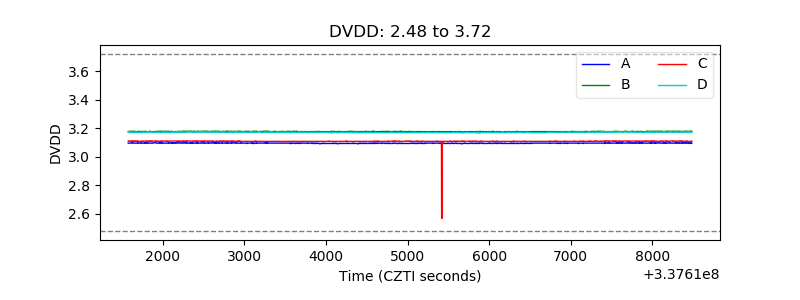 |
| Temperature 1 | 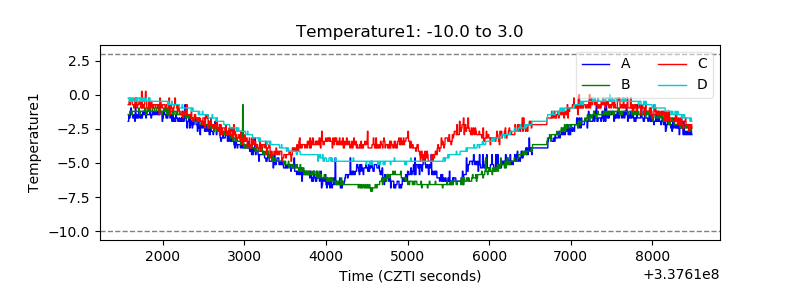 |
| Veto HV Monitor | 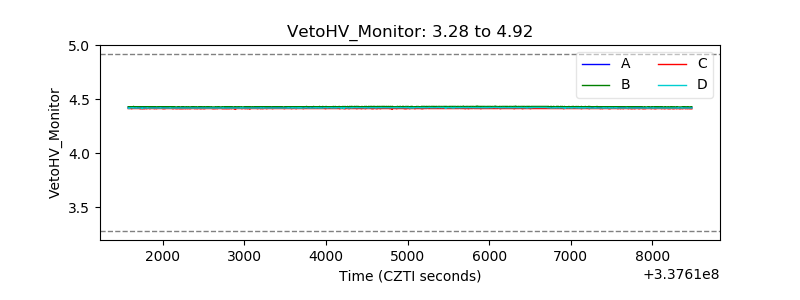 |
| Veto LLD | 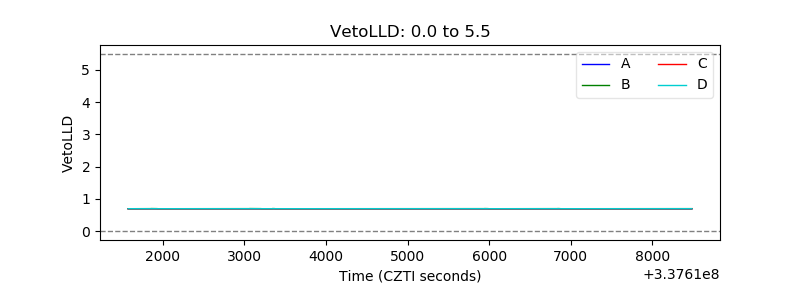 |
| Alpha Counter | 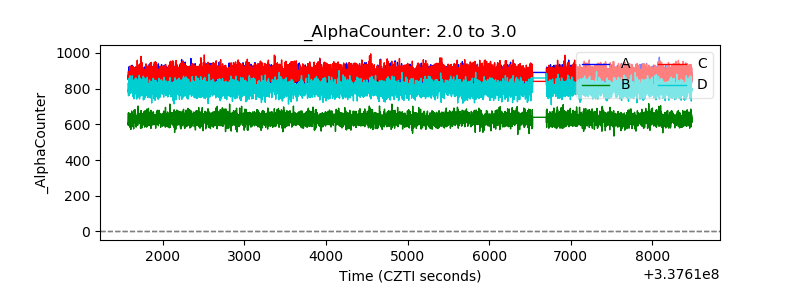 |
| _CPM_Rate | 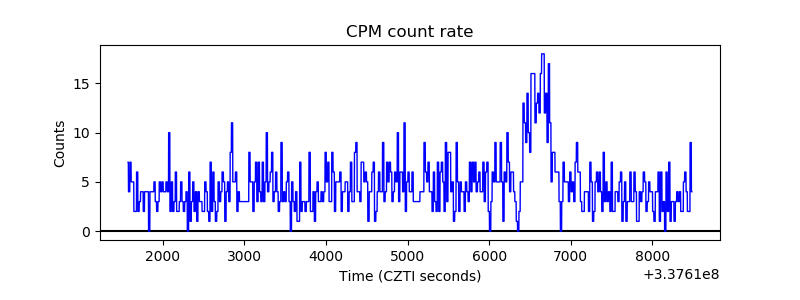 |
| CZT Counter | 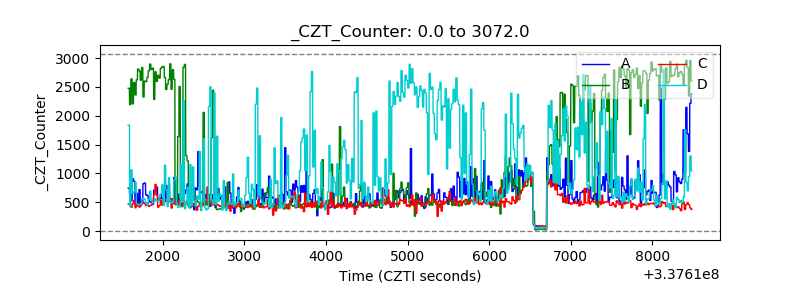 |
| +2.5 Volts monitor |  |
| +5 Volts monitor |  |
| _ROLL_ROT | 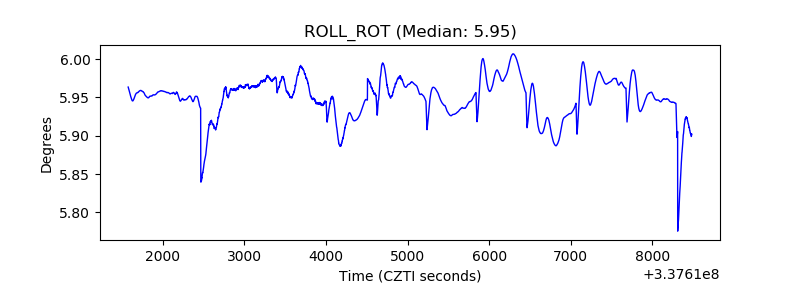 |
| _Roll_DEC | 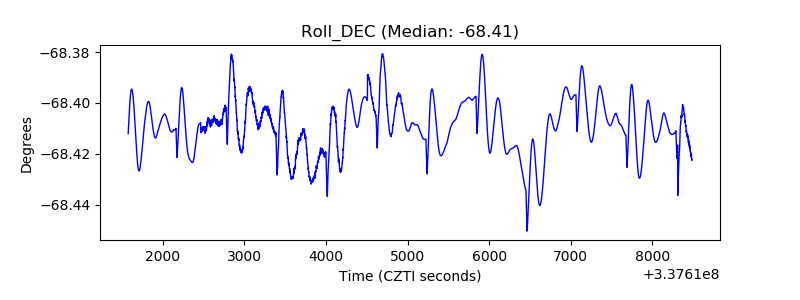 |
| _Roll_RA | 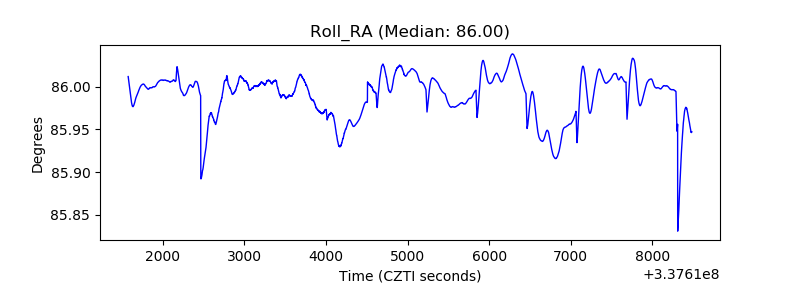 |
| Veto Counter | 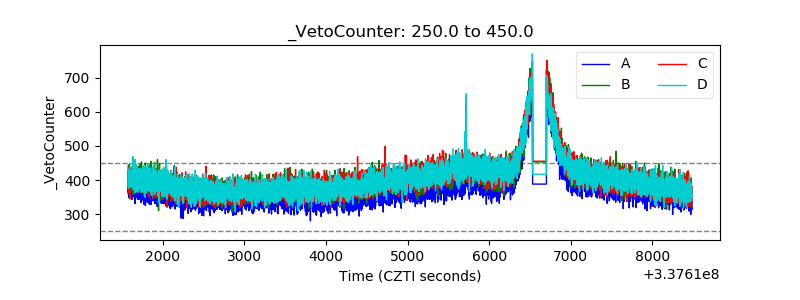 |