| Param | Original file | Final file |
|---|---|---|
| Filename | modeM0/AS1A09_079T01_9000003864_26813cztM0_level2.evt | modeM0/AS1A09_079T01_9000003864_26813cztM0_level2_quad_clean.evt |
| Size (bytes) | 938,427,840 | 89,196,480 |
| Size | 895.0 MB | 85.1 MB |
| Events in quadrant A | 4,607,555 | 629,278 |
| Events in quadrant B | 15,039,610 | 363,661 |
| Events in quadrant C | 3,249,268 | 632,531 |
| Events in quadrant D | 5,073,895 | 608,676 |
| Mode M9 | |||
|---|---|---|---|
| Quadrant | BADHDUFLAG | Total packets | Discarded packets |
| A | 0 | 4 | 0 |
| B | 0 | 4 | 0 |
| C | 0 | 4 | 0 |
| D | 0 | 4 | 0 |
| Mode M0 | |||
|---|---|---|---|
| Quadrant | BADHDUFLAG | Total packets | Discarded packets |
| A | 0 | 18152 | 0 |
| B | 0 | 49247 | 0 |
| C | 0 | 13993 | 0 |
| D | 0 | 19666 | 0 |
| Quadrant | Total seconds | Saturated seconds | Saturation percentage |
|---|---|---|---|
| A | 6676 | 189 | 2.831037% |
| B | 6676 | 5298 | 79.358898% |
| C | 6677 | 128 | 1.917029% |
| D | 6677 | 322 | 4.822525% |
Noise dominated data is calculated using 1-second bins in cleaned event files. If a bin has >2000 counts, and if more than 50% of those come from <1% of pixels, then it is considered to be noise-dominated and hence unusable.
| Quadrant | # 1 sec bins | Bins with >0 counts | Bins with >2000 counts | High rate bins dominated by noise | Noise dominated (total time) | Noise dominated (detector-on time) | Marked lightcurve |
|---|---|---|---|---|---|---|---|
| A | 7016 | 6677 | 56 | 56 | 0.80% | 0.84% | 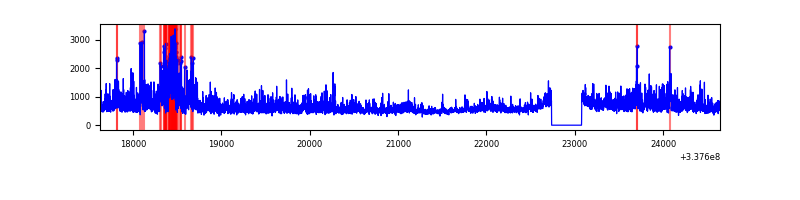 |
| B | 7015 | 6675 | 4857 | 4857 | 69.24% | 72.76% | 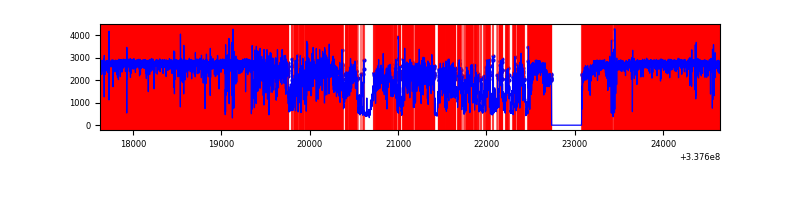 |
| C | 7017 | 6678 | 15 | 15 | 0.21% | 0.22% | 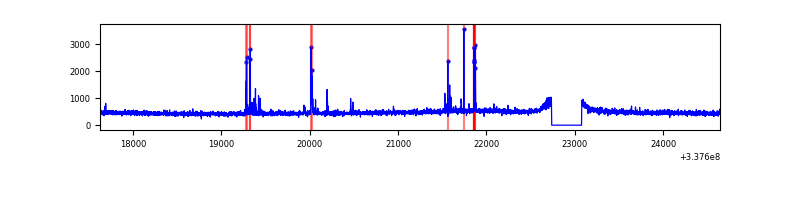 |
| D | 7017 | 6678 | 207 | 207 | 2.95% | 3.10% | 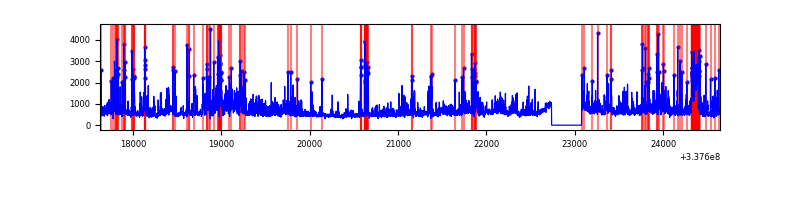 |
Top three noisy pixels from each quadrant. If the there are fewer than three noisy pixels in the level2.evt file, extra rows are filled as -1
| Pixel properties | Quadrant properties | ||||||
|---|---|---|---|---|---|---|---|
| Quadrant | DetID | PixID | Counts | Sigma | Mean | Median | Sigma |
| A | 0 | 13 | 1534060 | 9666.78 | 793 | 774 | 158.6 |
| A | 13 | 254 | 10575 | 61.79 | 793 | 774 | 158.6 |
| A | 6 | 16 | 8577 | 49.19 | 793 | 774 | 158.6 |
| B | 0 | 189 | 13220041 | 163130.9 | 423 | 412 | 81.0 |
| B | 3 | 64 | 104514 | 1284.62 | 423 | 412 | 81.0 |
| B | 10 | 246 | 19607 | 236.87 | 423 | 412 | 81.0 |
| C | 14 | 238 | 124165 | 685.37 | 768 | 771 | 180.0 |
| C | 15 | 208 | 120702 | 666.14 | 768 | 771 | 180.0 |
| C | 3 | 233 | 9087 | 46.19 | 768 | 771 | 180.0 |
| D | 1 | 52 | 1445297 | 7791.22 | 767 | 746 | 185.4 |
| D | 2 | 250 | 497107 | 2677.13 | 767 | 746 | 185.4 |
| D | 7 | 80 | 136147 | 730.29 | 767 | 746 | 185.4 |
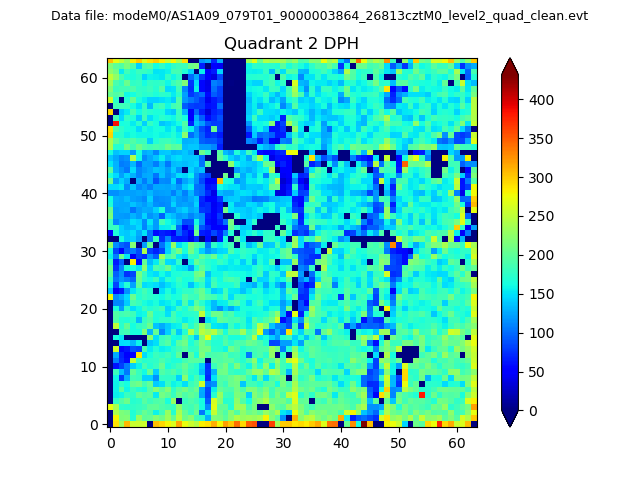
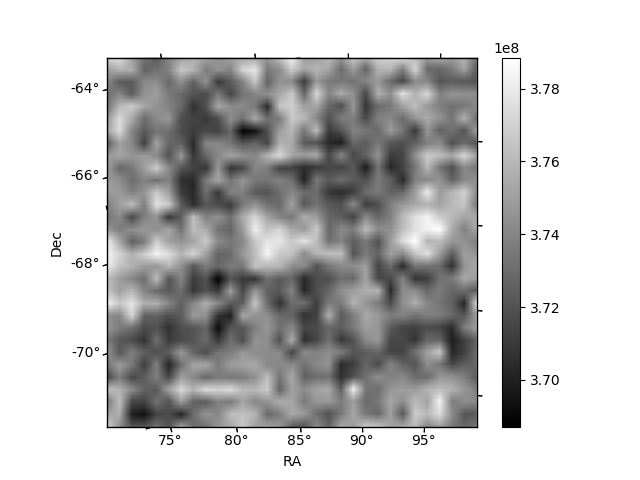
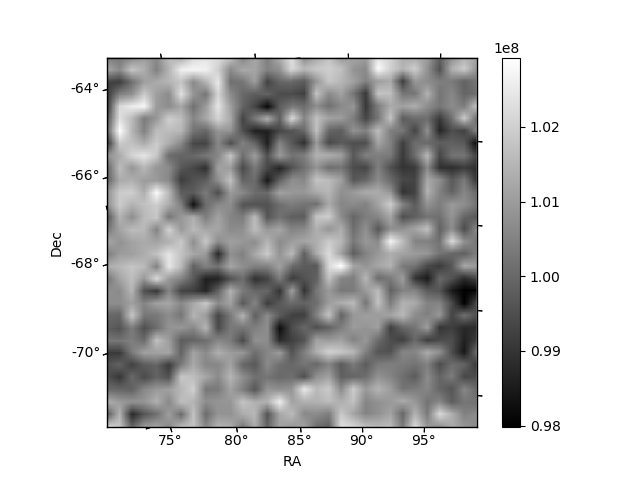
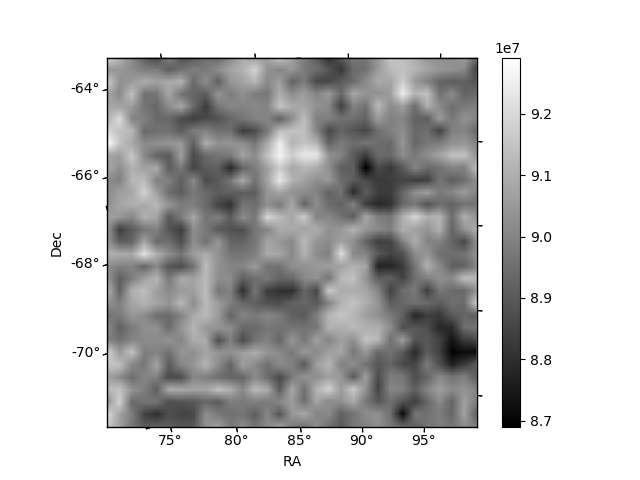
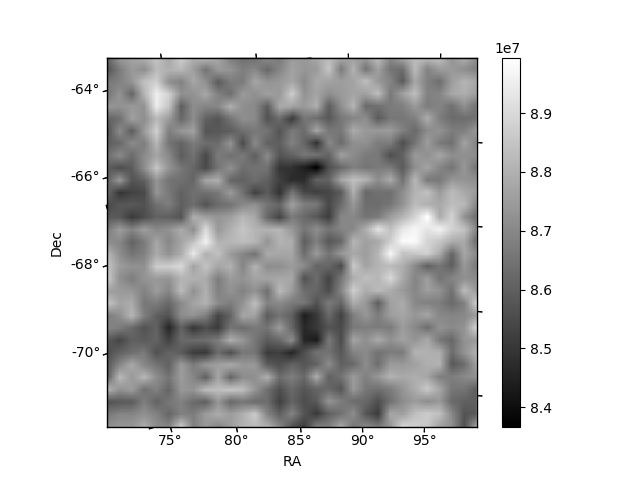
Histogram calculated using DETX and DETY for each event in the final _common_clean file
| Quadrant A | 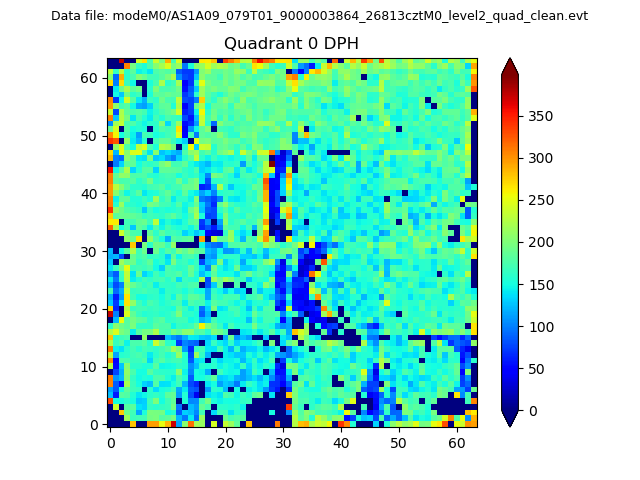 |
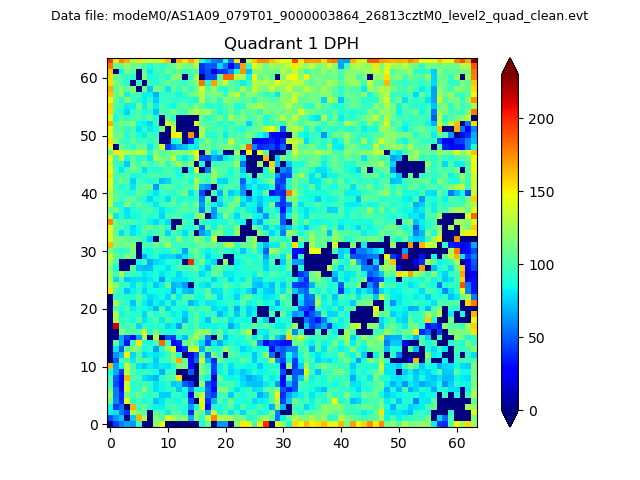 |
Quadrant B |
|---|---|---|---|
| Quadrant D | 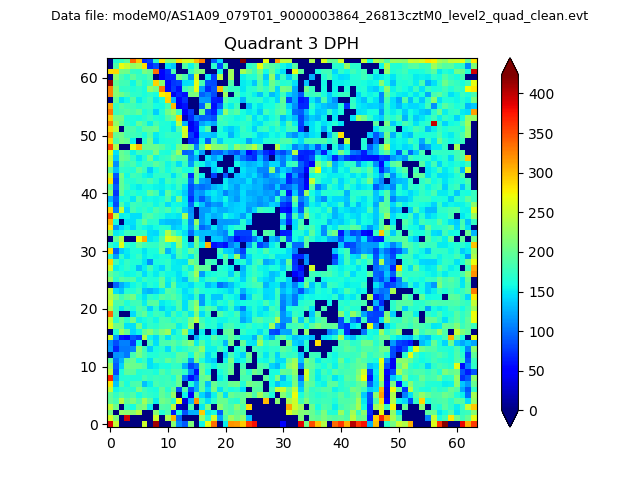 |
 |
Quadrant C |
| Plot type | Count rate plots | Images |
|---|---|---|
| Comparison with Poisson distribution Blue bars denote a histogram of data divided into 1 sec bins. Red curve is a Poisson curve with rate = median count rate of data. |
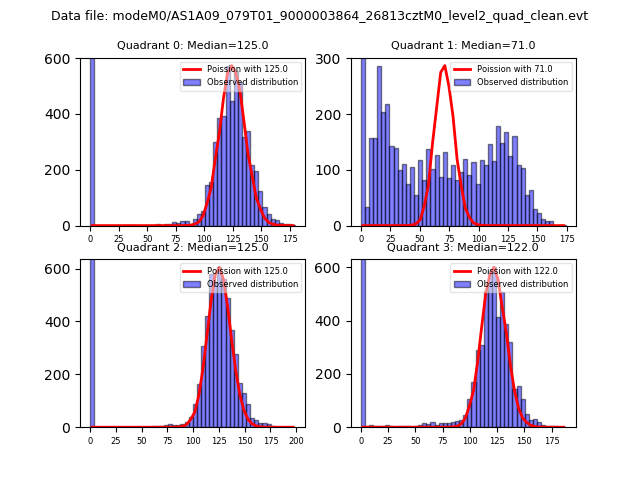 |
 |
| Quadrant-wise count rates Data is divided into 100 sec bins |
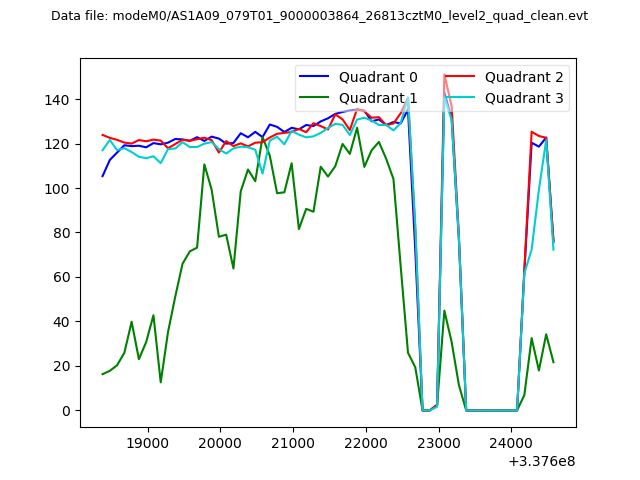 |
|
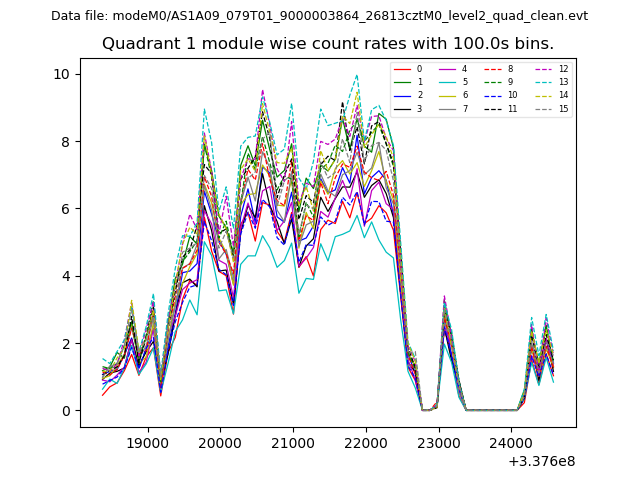
| Module-wise count rates for Quadrant A Data is divided into 100 sec bins |
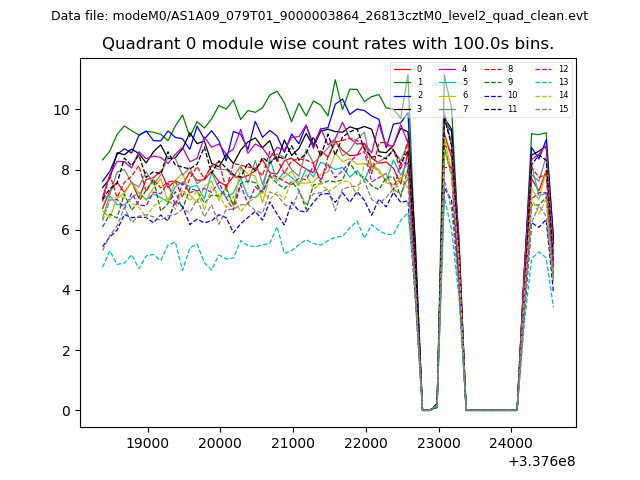 |
 |
| Module-wise count rates for Quadrant B Data is divided into 100 sec bins |
 |
 |
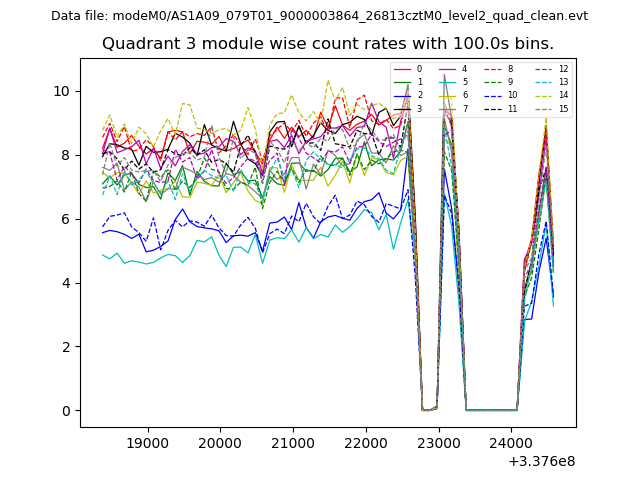
| Module-wise count rates for Quadrant C Data is divided into 100 sec bins |
 |
 |
| Module-wise count rates for Quadrant D Data is divided into 100 sec bins |
 |
 |
| Parameter | Plot |
|---|---|
| CZT HV Monitor | 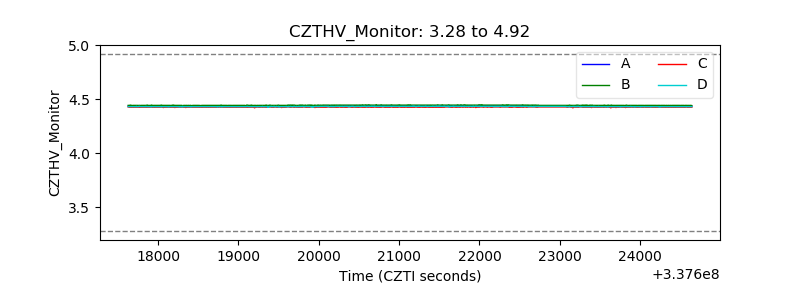 |
| D_VDD | 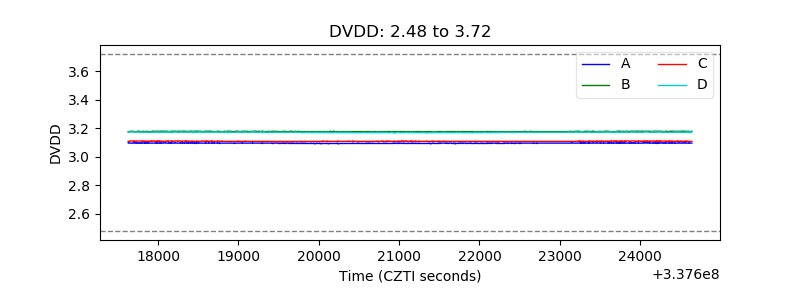 |
| Temperature 1 | 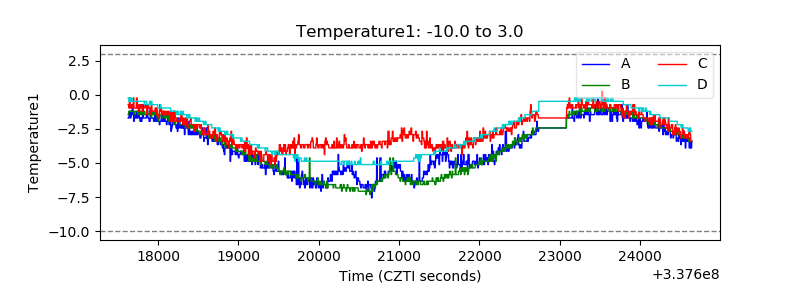 |
| Veto HV Monitor | 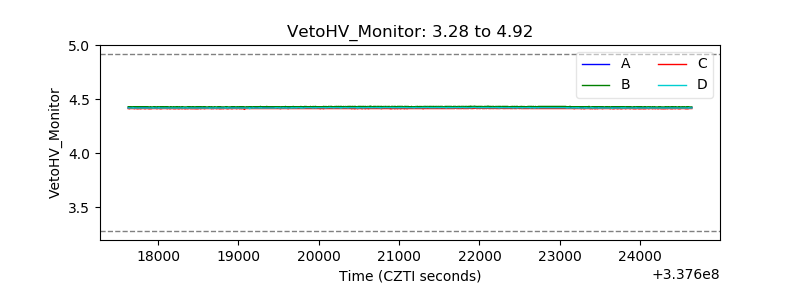 |
| Veto LLD | 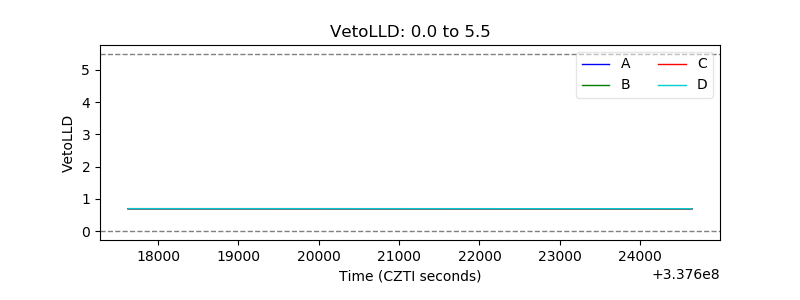 |
| Alpha Counter | 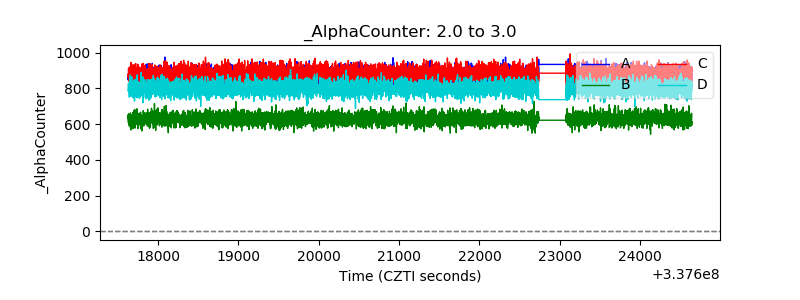 |
| _CPM_Rate | 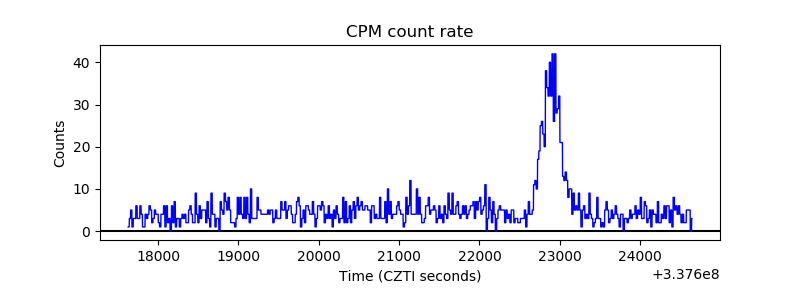 |
| CZT Counter | 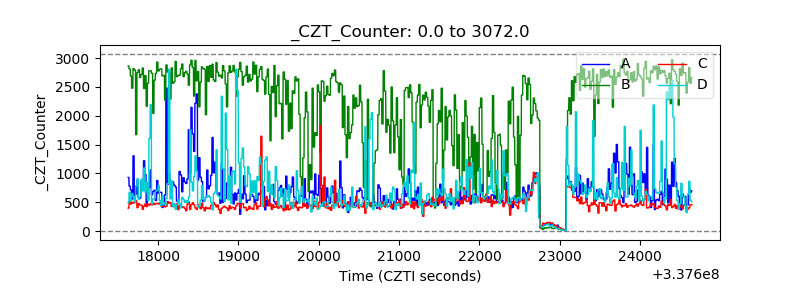 |
| +2.5 Volts monitor |  |
| +5 Volts monitor |  |
| _ROLL_ROT | 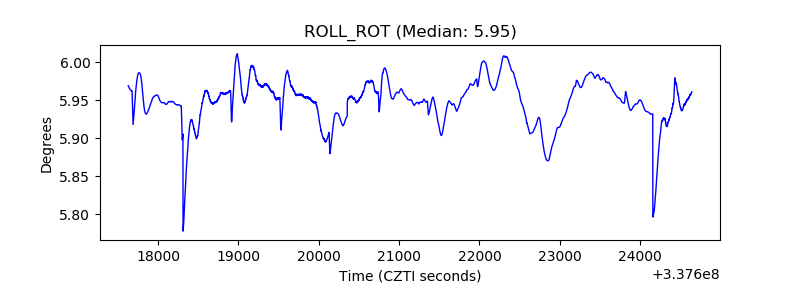 |
| _Roll_DEC | 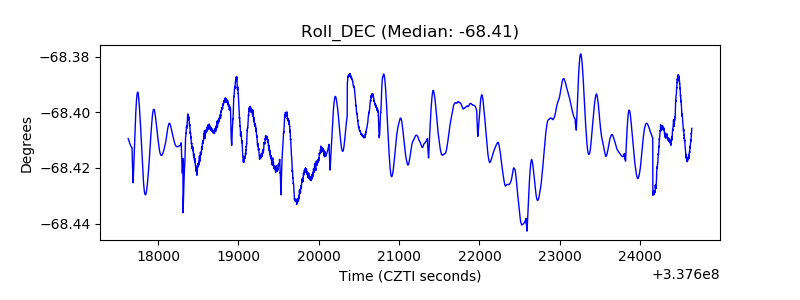 |
| _Roll_RA | 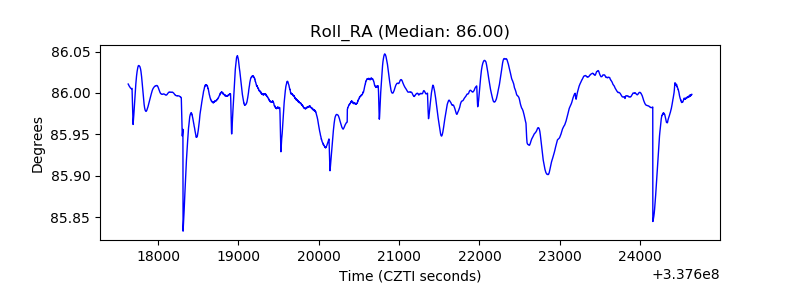 |
| Veto Counter | 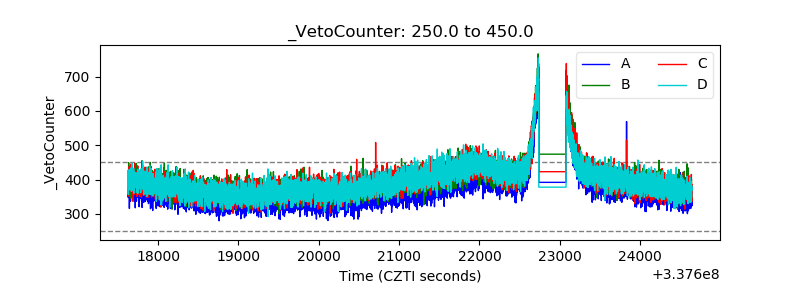 |