| Param | Original file | Final file |
|---|---|---|
| Filename | modeM0/AS1A09_079T01_9000003864_26815cztM0_level2.evt | modeM0/AS1A09_079T01_9000003864_26815cztM0_level2_quad_clean.evt |
| Size (bytes) | 1,860,024,960 | 185,221,440 |
| Size | 1.7 GB | 176.6 MB |
| Events in quadrant A | 7,612,775 | 1,351,544 |
| Events in quadrant B | 26,264,444 | 857,183 |
| Events in quadrant C | 6,039,624 | 1,350,569 |
| Events in quadrant D | 15,570,611 | 1,176,735 |
| Mode M9 | |||
|---|---|---|---|
| Quadrant | BADHDUFLAG | Total packets | Discarded packets |
| A | 0 | 12 | 0 |
| B | 0 | 12 | 0 |
| C | 0 | 12 | 0 |
| D | 0 | 12 | 0 |
| Mode M0 | |||
|---|---|---|---|
| Quadrant | BADHDUFLAG | Total packets | Discarded packets |
| A | 0 | 31022 | 0 |
| B | 0 | 86653 | 0 |
| C | 0 | 26077 | 0 |
| D | 0 | 55091 | 0 |
| Quadrant | Total seconds | Saturated seconds | Saturation percentage |
|---|---|---|---|
| A | 12579 | 146 | 1.160665% |
| B | 12580 | 8418 | 66.915739% |
| C | 12580 | 150 | 1.192369% |
| D | 12580 | 2666 | 21.192369% |
Noise dominated data is calculated using 1-second bins in cleaned event files. If a bin has >2000 counts, and if more than 50% of those come from <1% of pixels, then it is considered to be noise-dominated and hence unusable.
| Quadrant | # 1 sec bins | Bins with >0 counts | Bins with >2000 counts | High rate bins dominated by noise | Noise dominated (total time) | Noise dominated (detector-on time) | Marked lightcurve |
|---|---|---|---|---|---|---|---|
| A | 13809 | 12581 | 8 | 8 | 0.06% | 0.06% | 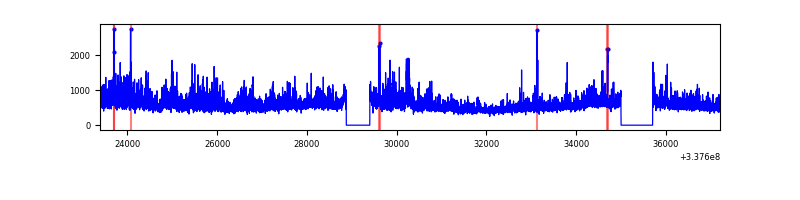 |
| B | 13810 | 12580 | 7770 | 7770 | 56.26% | 61.76% | 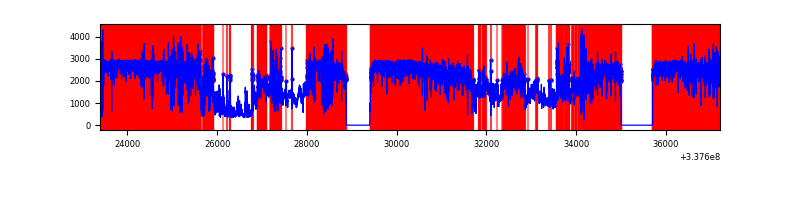 |
| C | 13810 | 12582 | 8 | 8 | 0.06% | 0.06% | 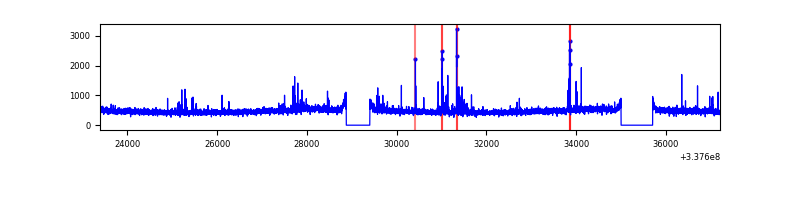 |
| D | 13810 | 12582 | 2127 | 2127 | 15.40% | 16.91% | 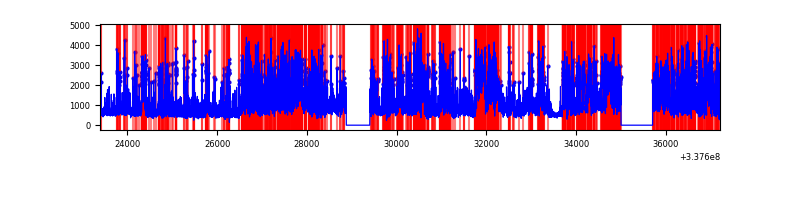 |
Top three noisy pixels from each quadrant. If the there are fewer than three noisy pixels in the level2.evt file, extra rows are filled as -1
| Pixel properties | Quadrant properties | ||||||
|---|---|---|---|---|---|---|---|
| Quadrant | DetID | PixID | Counts | Sigma | Mean | Median | Sigma |
| A | 0 | 13 | 1836714 | 6166.48 | 1488 | 1455 | 297.6 |
| A | 4 | 2 | 33084 | 106.27 | 1488 | 1455 | 297.6 |
| A | 13 | 254 | 20786 | 64.95 | 1488 | 1455 | 297.6 |
| B | 0 | 189 | 22321810 | 127528.81 | 928 | 905 | 175.0 |
| B | 3 | 64 | 213638 | 1215.43 | 928 | 905 | 175.0 |
| B | 7 | 205 | 41124 | 229.79 | 928 | 905 | 175.0 |
| C | 14 | 238 | 230970 | 683.88 | 1440 | 1447 | 335.6 |
| C | 15 | 208 | 118363 | 348.36 | 1440 | 1447 | 335.6 |
| C | 2 | 16 | 73935 | 215.98 | 1440 | 1447 | 335.6 |
| D | 7 | 80 | 5540894 | 17473.38 | 1336 | 1303 | 317.0 |
| D | 1 | 52 | 3975957 | 12537.14 | 1336 | 1303 | 317.0 |
| D | 2 | 250 | 900055 | 2834.91 | 1336 | 1303 | 317.0 |
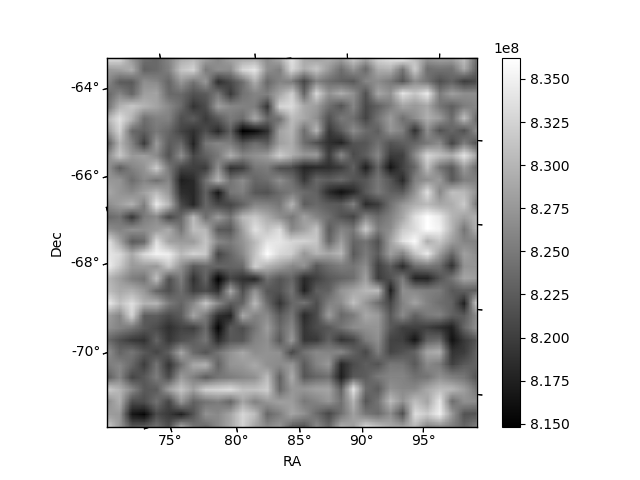
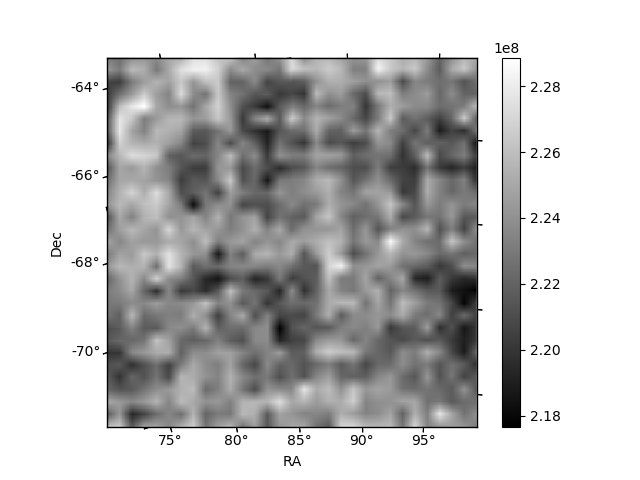
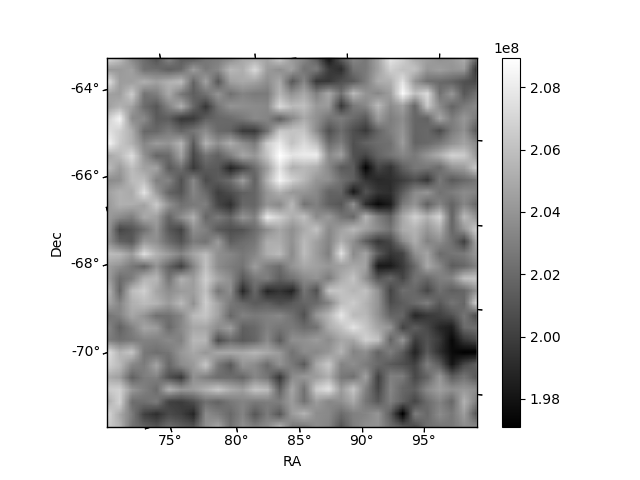
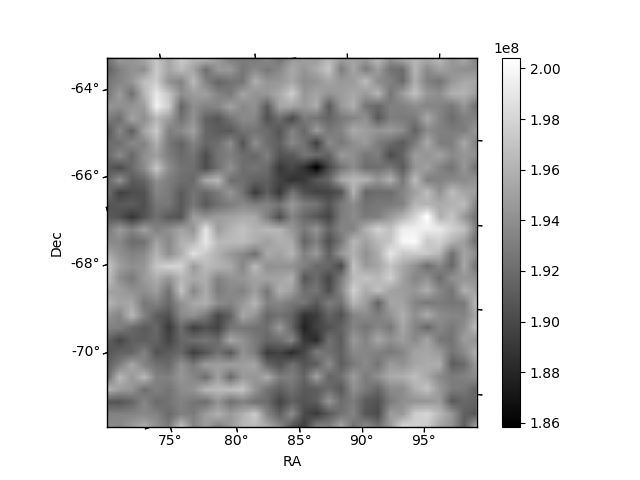
Histogram calculated using DETX and DETY for each event in the final _common_clean file
| Quadrant A | 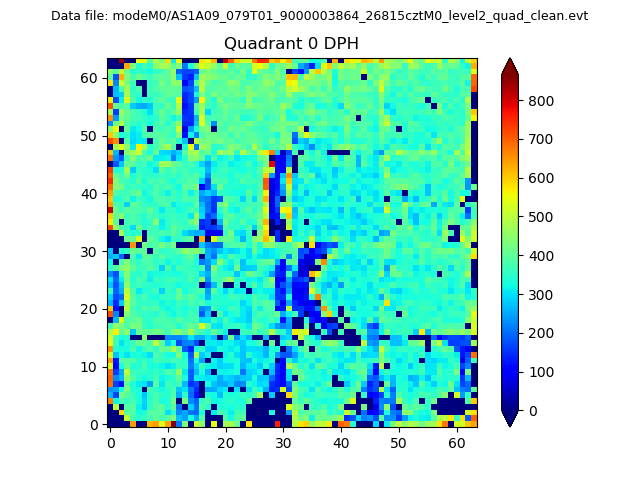 |
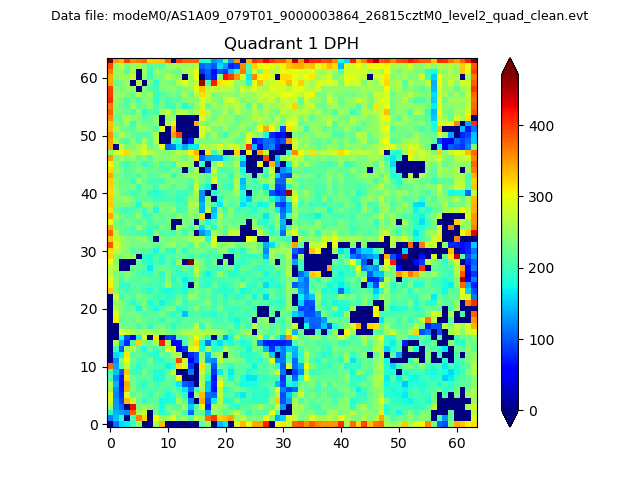 |
Quadrant B |
|---|---|---|---|
| Quadrant D | 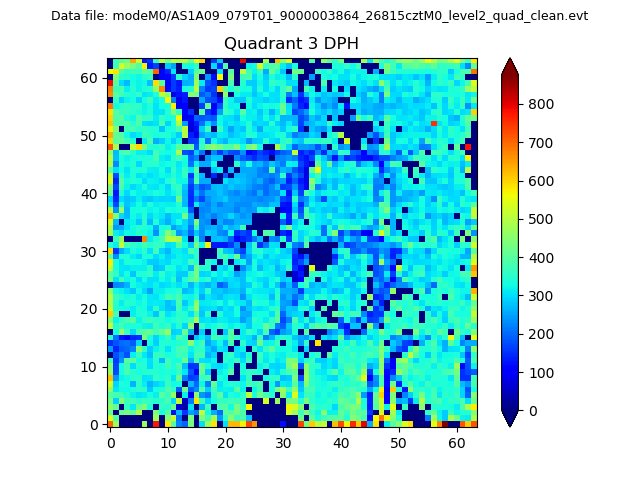 |
 |
Quadrant C |
| Plot type | Count rate plots | Images |
|---|---|---|
| Comparison with Poisson distribution Blue bars denote a histogram of data divided into 1 sec bins. Red curve is a Poisson curve with rate = median count rate of data. |
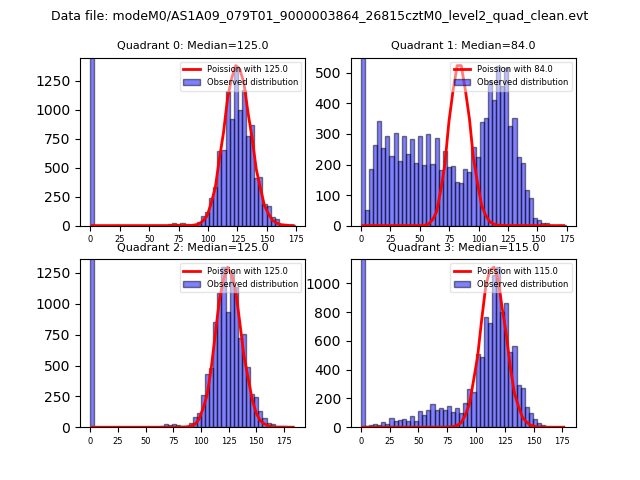 |
 |
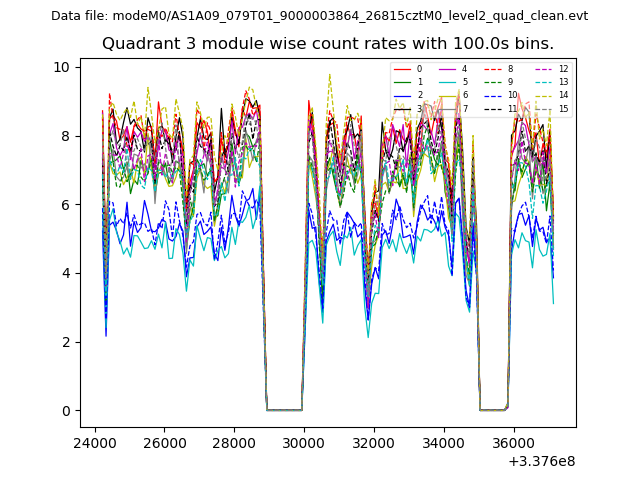
| Quadrant-wise count rates Data is divided into 100 sec bins |
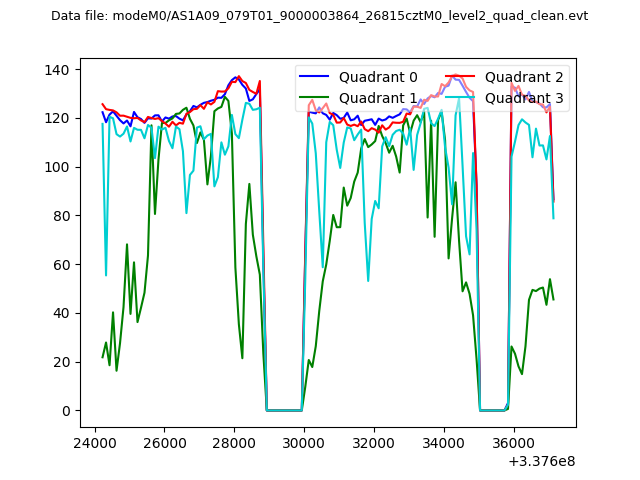 |
|
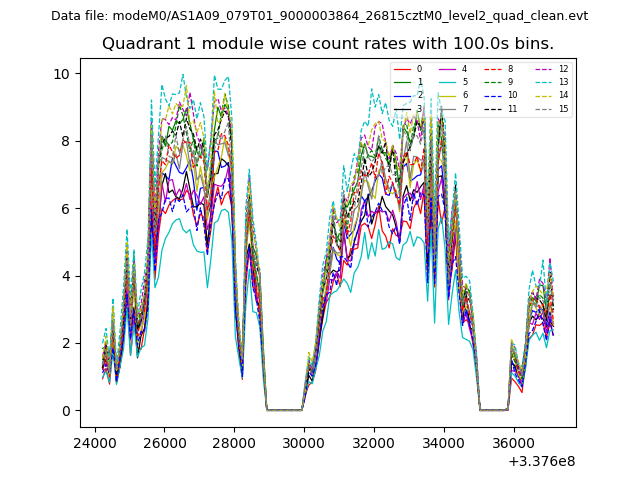
| Module-wise count rates for Quadrant A Data is divided into 100 sec bins |
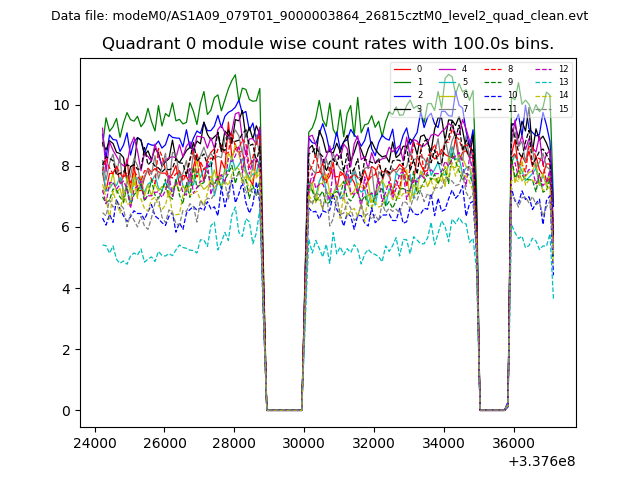 |
 |
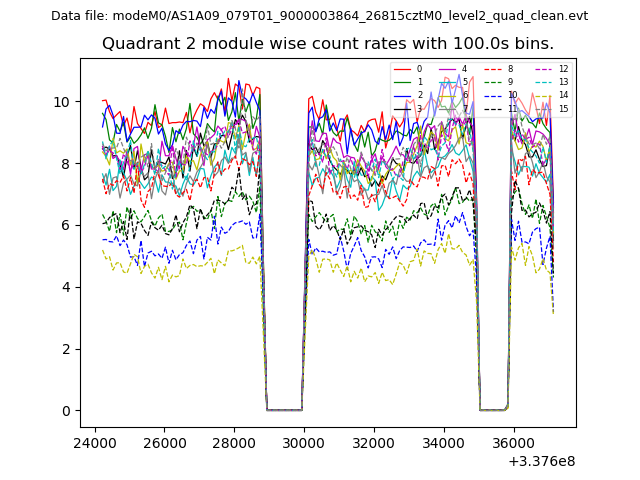
| Module-wise count rates for Quadrant B Data is divided into 100 sec bins |
 |
 |
| Module-wise count rates for Quadrant C Data is divided into 100 sec bins |
 |
 |
| Module-wise count rates for Quadrant D Data is divided into 100 sec bins |
 |
 |
| Parameter | Plot |
|---|---|
| CZT HV Monitor | 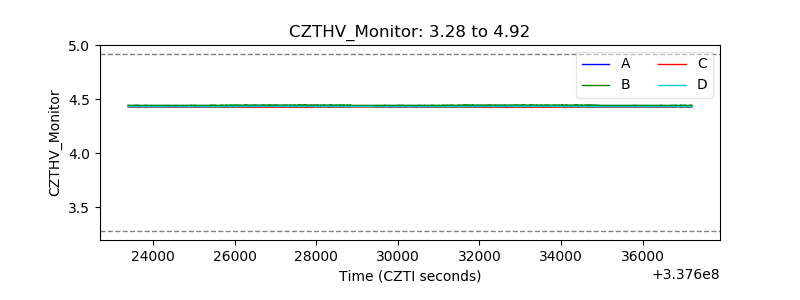 |
| D_VDD |  |
| Temperature 1 | 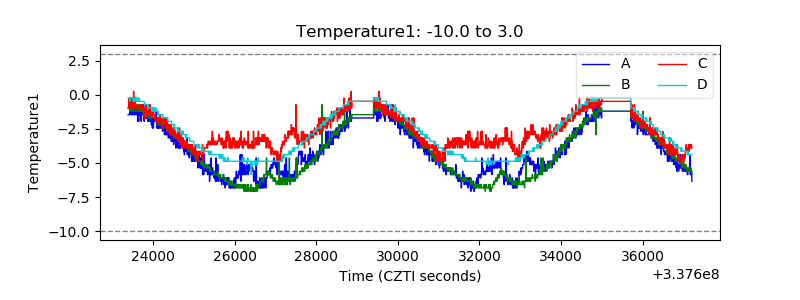 |
| Veto HV Monitor | 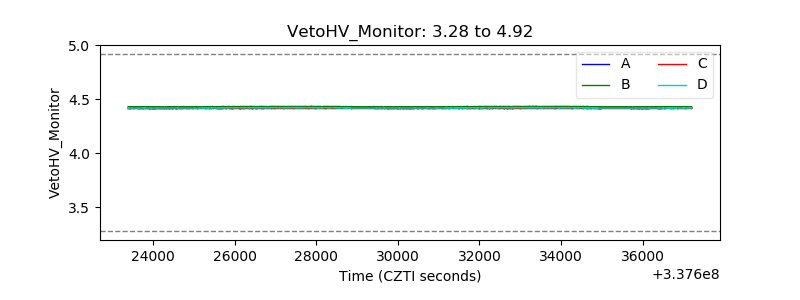 |
| Veto LLD | 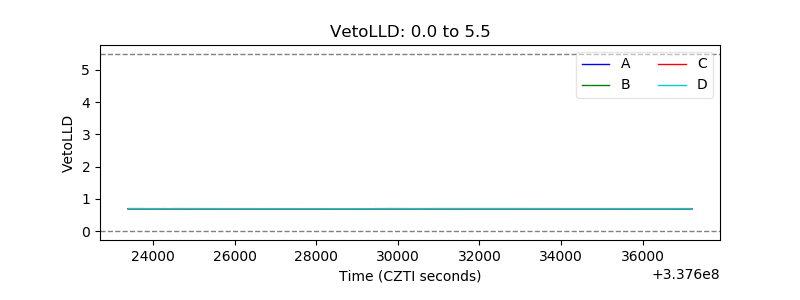 |
| Alpha Counter | 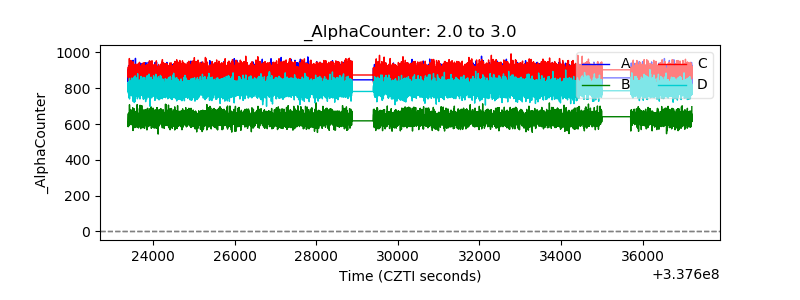 |
| _CPM_Rate | 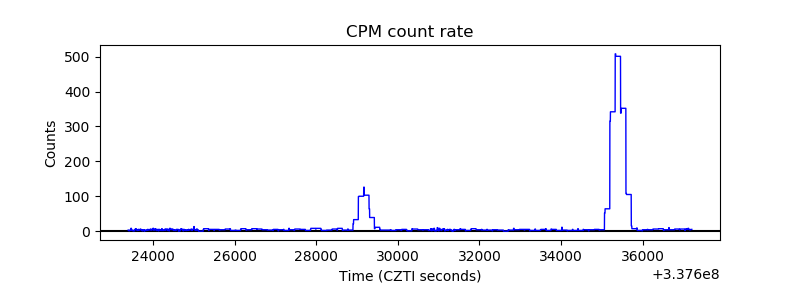 |
| CZT Counter | 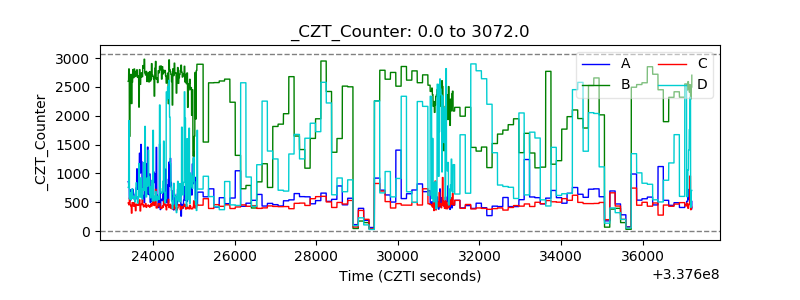 |
| +2.5 Volts monitor |  |
| +5 Volts monitor |  |
| _ROLL_ROT | 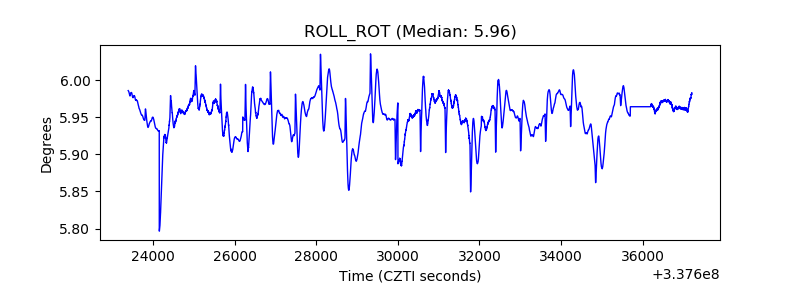 |
| _Roll_DEC | 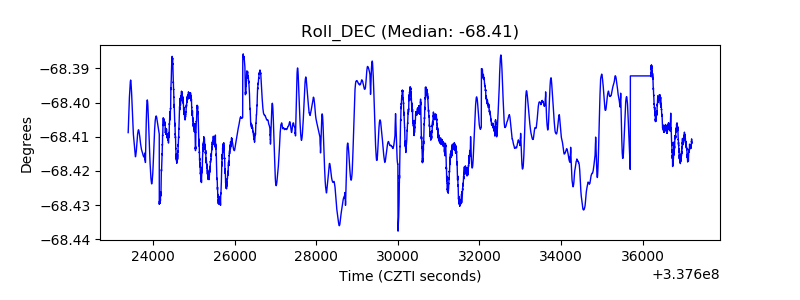 |
| _Roll_RA |  |
| Veto Counter | 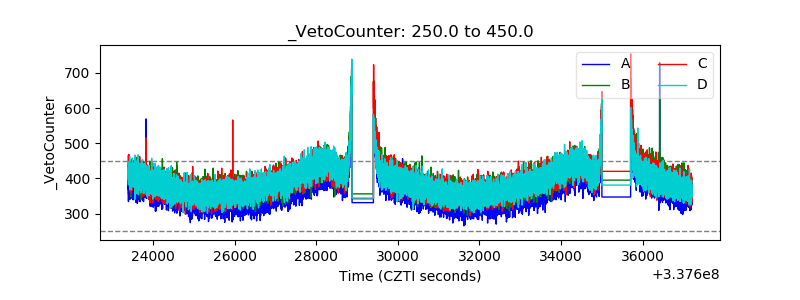 |