| Param | Original file | Final file |
|---|---|---|
| Filename | modeM0/AS1A09_079T01_9000003864_26816cztM0_level2.evt | modeM0/AS1A09_079T01_9000003864_26816cztM0_level2_quad_clean.evt |
| Size (bytes) | 881,389,440 | 109,074,240 |
| Size | 840.6 MB | 104.0 MB |
| Events in quadrant A | 3,826,925 | 797,688 |
| Events in quadrant B | 13,187,769 | 524,426 |
| Events in quadrant C | 3,252,795 | 790,489 |
| Events in quadrant D | 5,986,654 | 734,947 |
| Mode M9 | |||
|---|---|---|---|
| Quadrant | BADHDUFLAG | Total packets | Discarded packets |
| A | 0 | 9 | 0 |
| B | 0 | 9 | 0 |
| C | 0 | 9 | 0 |
| D | 0 | 9 | 0 |
| Mode M0 | |||
|---|---|---|---|
| Quadrant | BADHDUFLAG | Total packets | Discarded packets |
| A | 0 | 15701 | 0 |
| B | 0 | 43676 | 0 |
| C | 0 | 13857 | 0 |
| D | 0 | 22209 | 0 |
| Quadrant | Total seconds | Saturated seconds | Saturation percentage |
|---|---|---|---|
| A | 6504 | 39 | 0.599631% |
| B | 6504 | 4351 | 66.897294% |
| C | 6504 | 84 | 1.291513% |
| D | 6504 | 710 | 10.916359% |
Noise dominated data is calculated using 1-second bins in cleaned event files. If a bin has >2000 counts, and if more than 50% of those come from <1% of pixels, then it is considered to be noise-dominated and hence unusable.
| Quadrant | # 1 sec bins | Bins with >0 counts | Bins with >2000 counts | High rate bins dominated by noise | Noise dominated (total time) | Noise dominated (detector-on time) | Marked lightcurve |
|---|---|---|---|---|---|---|---|
| A | 7389 | 6505 | 0 | 0 | 0.00% | 0.00% | 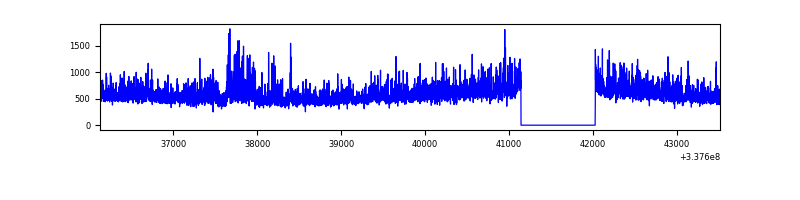 |
| B | 7389 | 6505 | 3863 | 3863 | 52.28% | 59.39% | 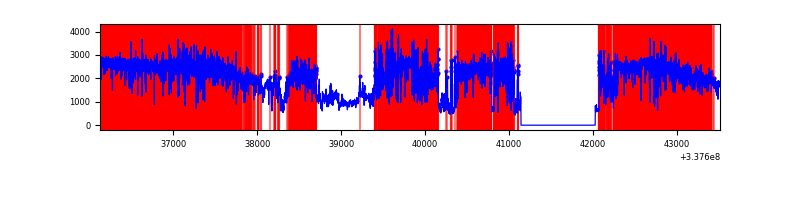 |
| C | 7389 | 6505 | 7 | 7 | 0.09% | 0.11% | 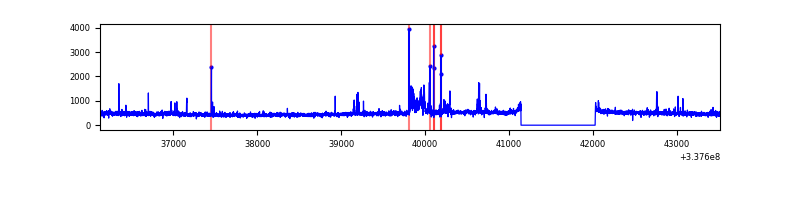 |
| D | 7389 | 6504 | 604 | 604 | 8.17% | 9.29% | 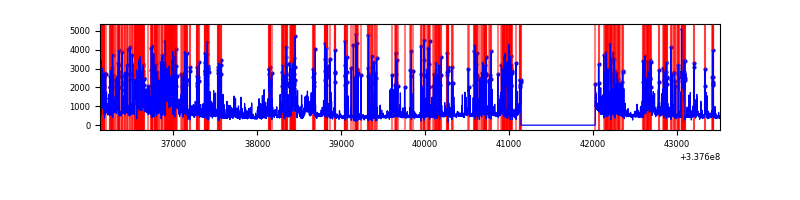 |
Top three noisy pixels from each quadrant. If the there are fewer than three noisy pixels in the level2.evt file, extra rows are filled as -1
| Pixel properties | Quadrant properties | ||||||
|---|---|---|---|---|---|---|---|
| Quadrant | DetID | PixID | Counts | Sigma | Mean | Median | Sigma |
| A | 0 | 13 | 849135 | 5472.09 | 771 | 753 | 155.0 |
| A | 13 | 254 | 10782 | 64.69 | 771 | 753 | 155.0 |
| A | 3 | 137 | 7258 | 41.96 | 771 | 753 | 155.0 |
| B | 0 | 189 | 10955675 | 103538.55 | 551 | 536 | 105.8 |
| B | 3 | 64 | 25867 | 239.41 | 551 | 536 | 105.8 |
| B | 10 | 246 | 16648 | 152.28 | 551 | 536 | 105.8 |
| C | 15 | 208 | 135388 | 771.48 | 746 | 749 | 174.5 |
| C | 14 | 238 | 121984 | 694.68 | 746 | 749 | 174.5 |
| C | 2 | 16 | 87436 | 496.72 | 746 | 749 | 174.5 |
| D | 1 | 52 | 1828681 | 10682.08 | 717 | 701 | 171.1 |
| D | 7 | 80 | 858607 | 5013.31 | 717 | 701 | 171.1 |
| D | 2 | 250 | 357511 | 2085.07 | 717 | 701 | 171.1 |
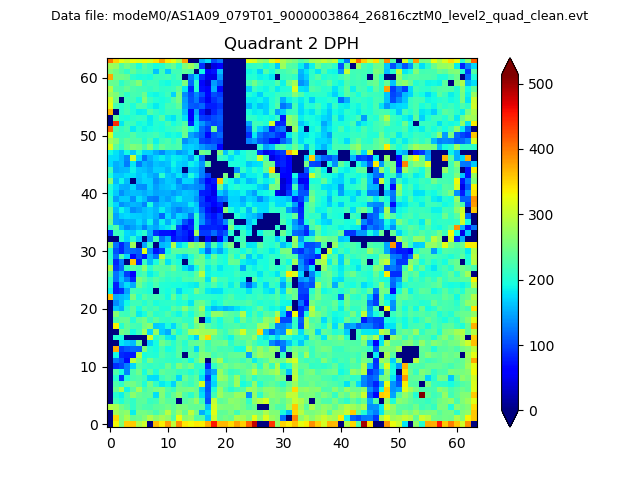
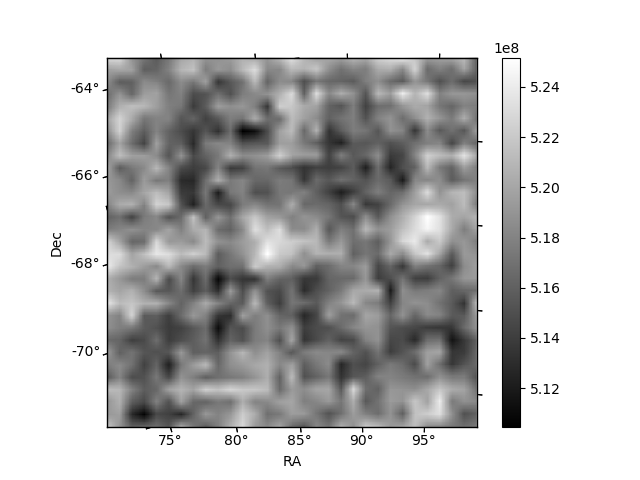
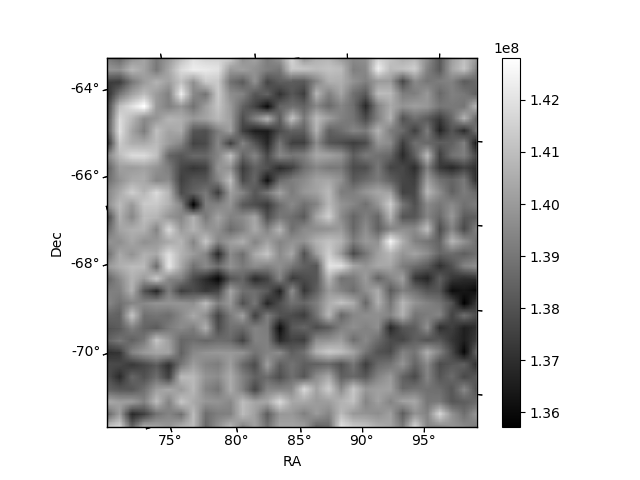
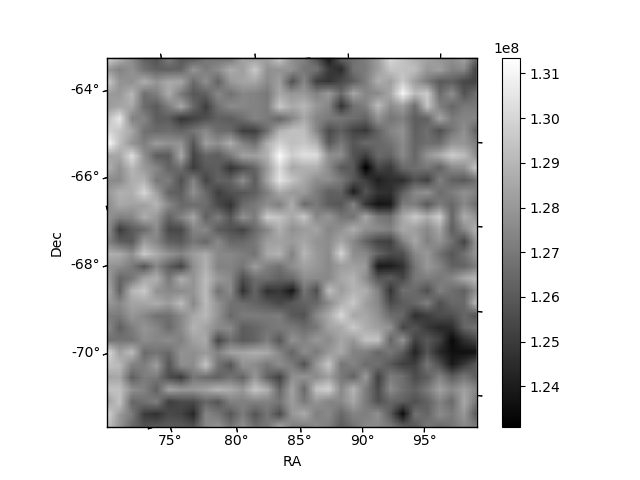
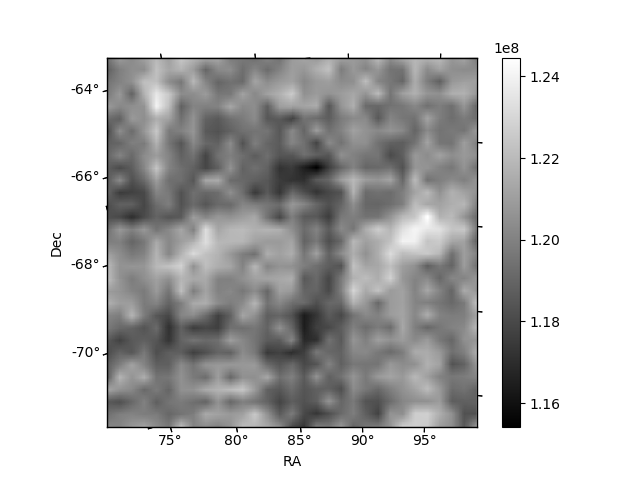
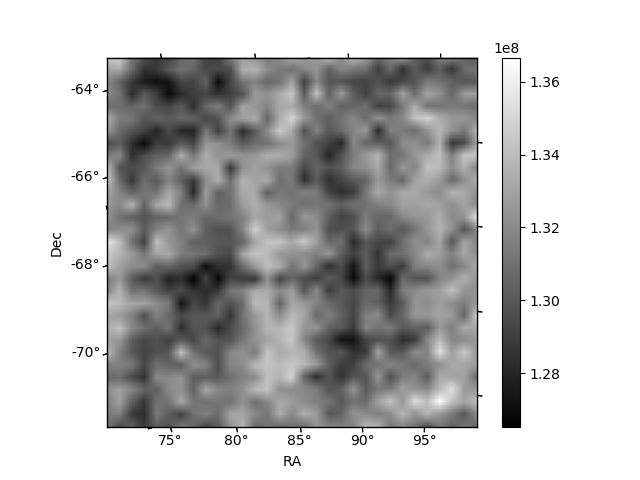
Histogram calculated using DETX and DETY for each event in the final _common_clean file
| Quadrant A | 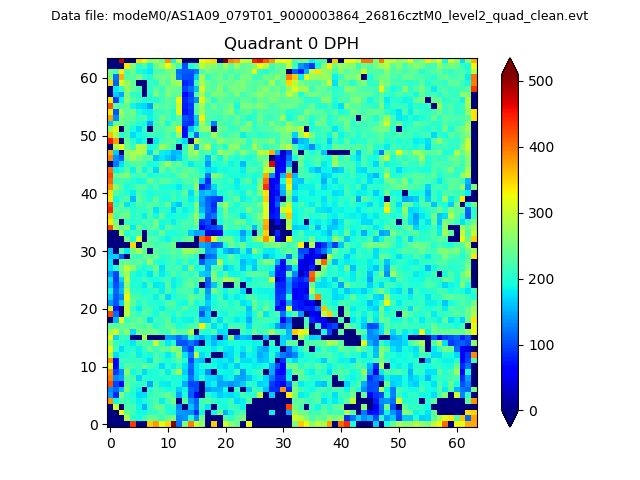 |
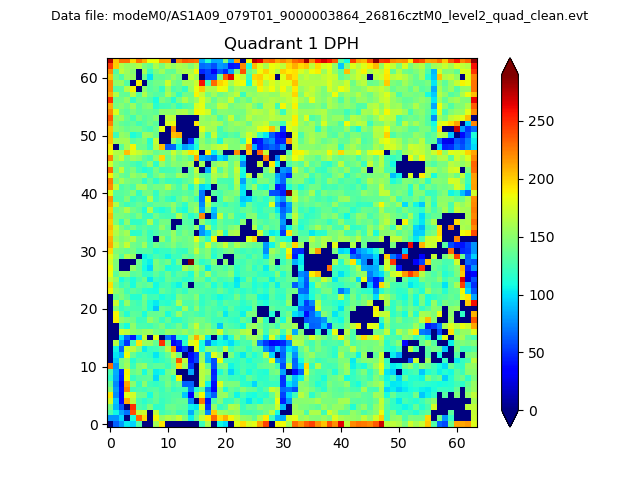 |
Quadrant B |
|---|---|---|---|
| Quadrant D | 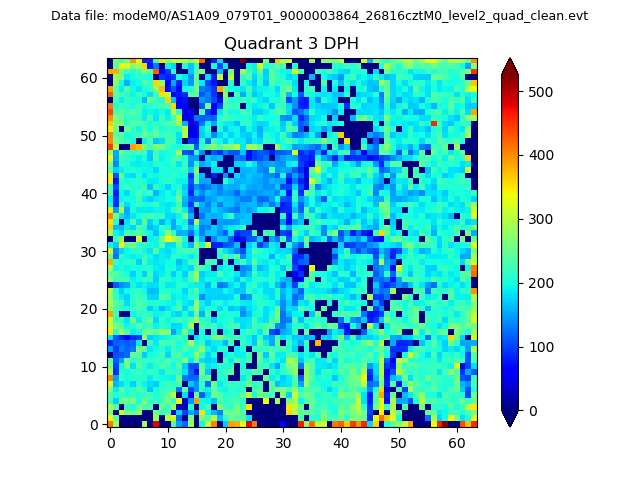 |
 |
Quadrant C |
| Plot type | Count rate plots | Images |
|---|---|---|
| Comparison with Poisson distribution Blue bars denote a histogram of data divided into 1 sec bins. Red curve is a Poisson curve with rate = median count rate of data. |
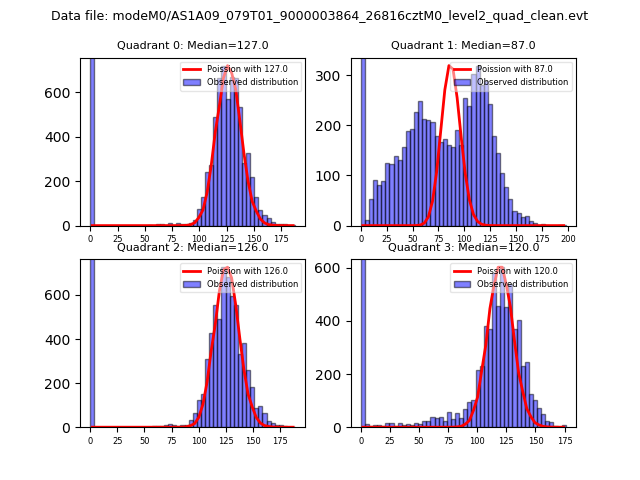 |
 |
| Quadrant-wise count rates Data is divided into 100 sec bins |
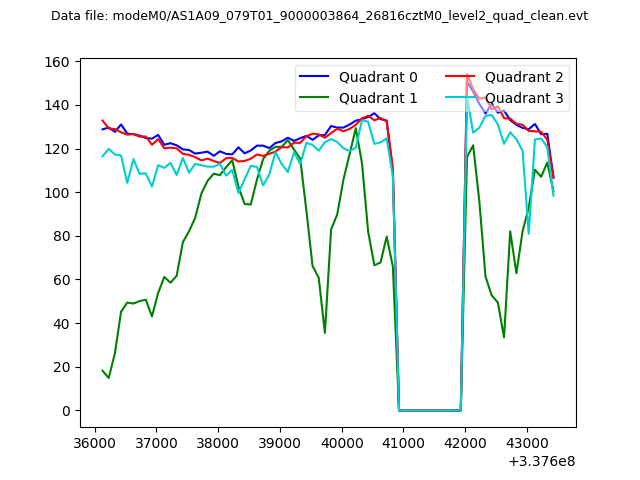 |
|
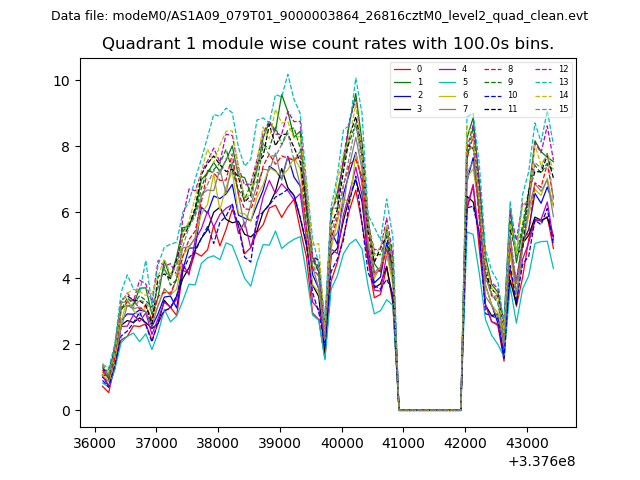
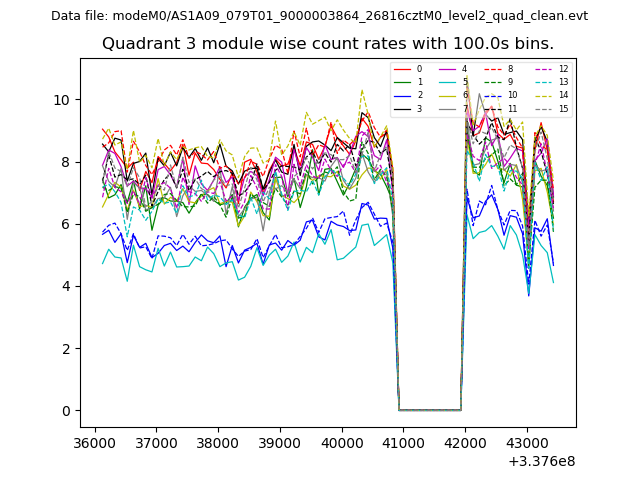
| Module-wise count rates for Quadrant A Data is divided into 100 sec bins |
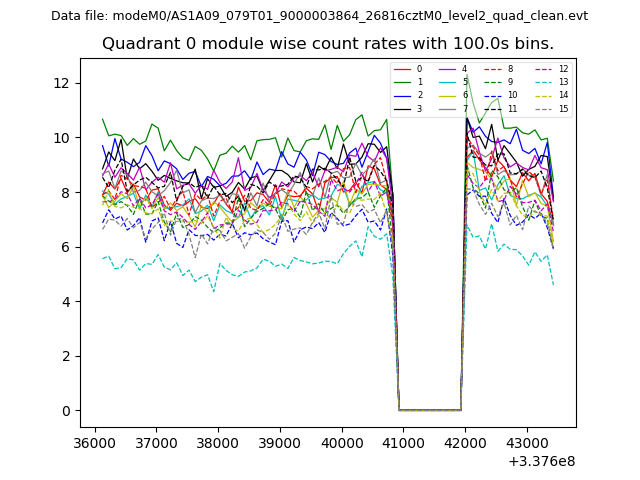 |
 |
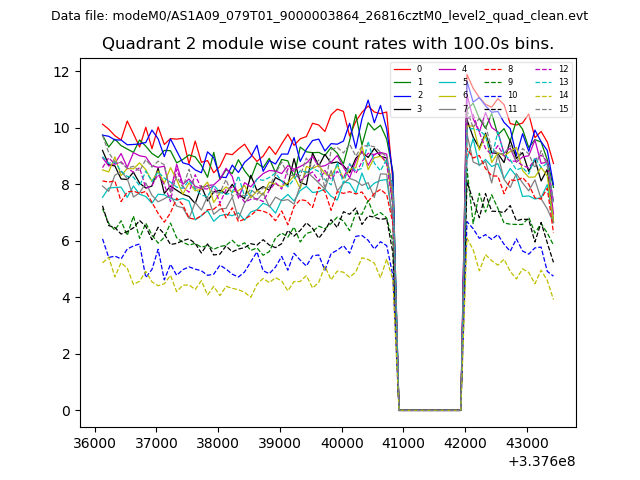
| Module-wise count rates for Quadrant B Data is divided into 100 sec bins |
 |
 |
| Module-wise count rates for Quadrant C Data is divided into 100 sec bins |
 |
 |
| Module-wise count rates for Quadrant D Data is divided into 100 sec bins |
 |
 |
| Parameter | Plot |
|---|---|
| CZT HV Monitor | 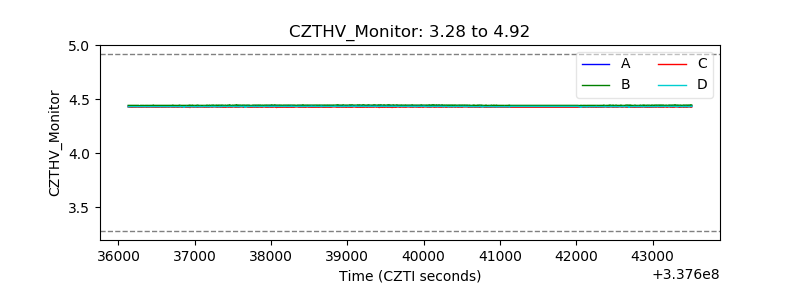 |
| D_VDD |  |
| Temperature 1 | 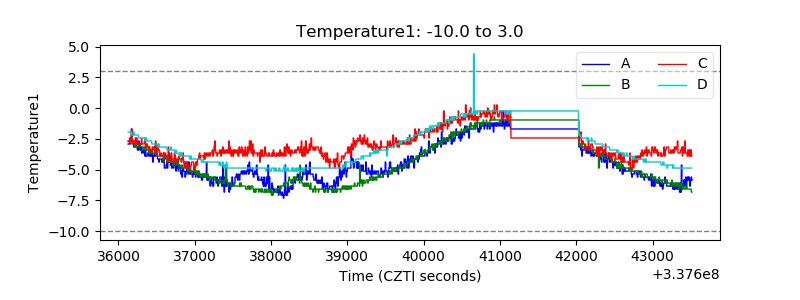 |
| Veto HV Monitor | 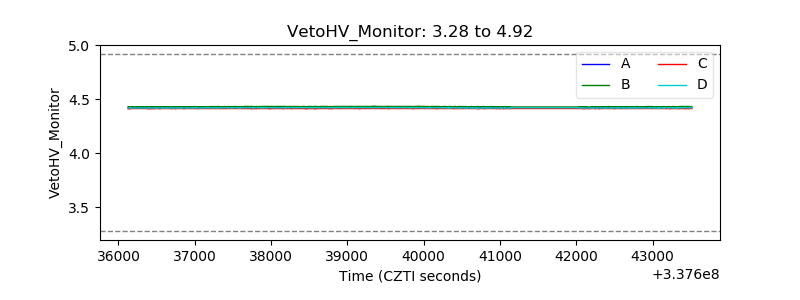 |
| Veto LLD | 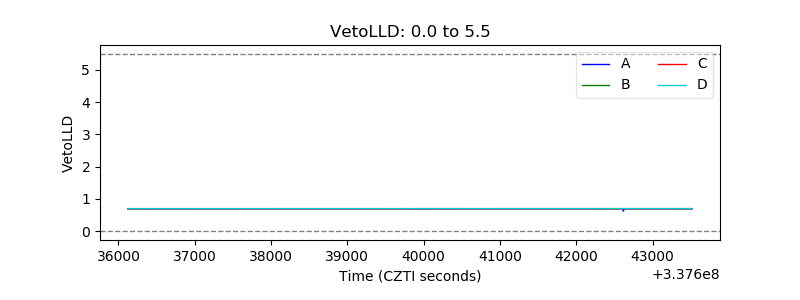 |
| Alpha Counter | 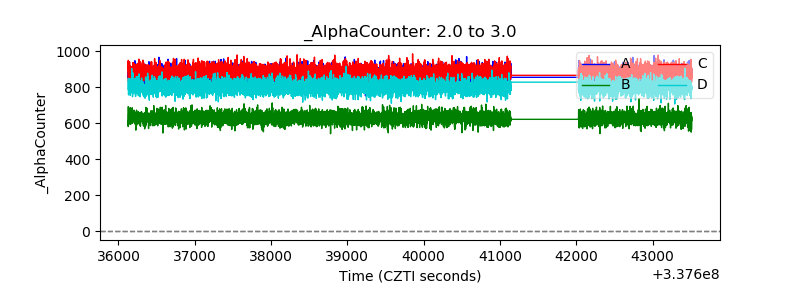 |
| _CPM_Rate | 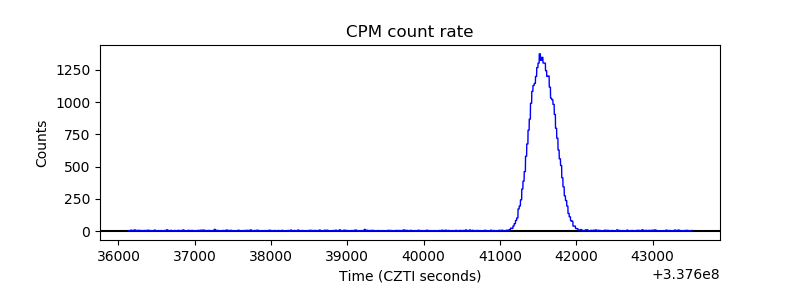 |
| CZT Counter | 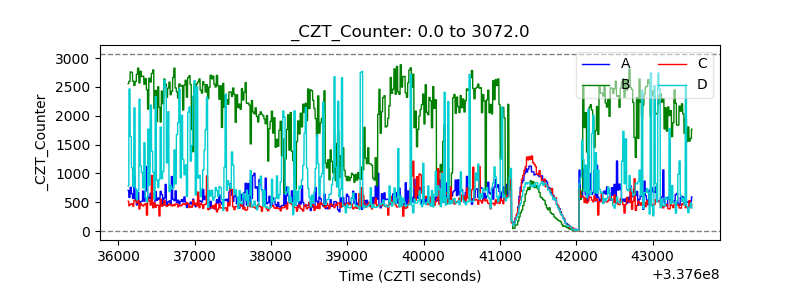 |
| +2.5 Volts monitor | 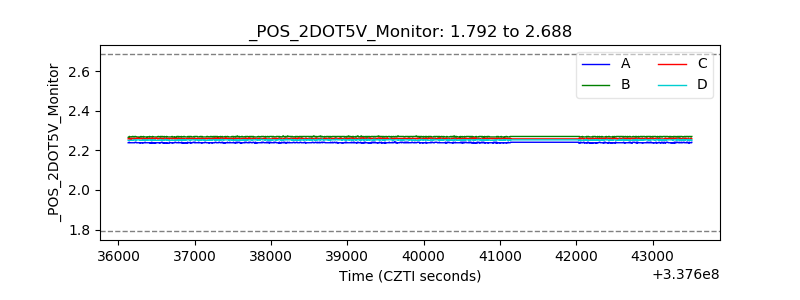 |
| +5 Volts monitor |  |
| _ROLL_ROT | 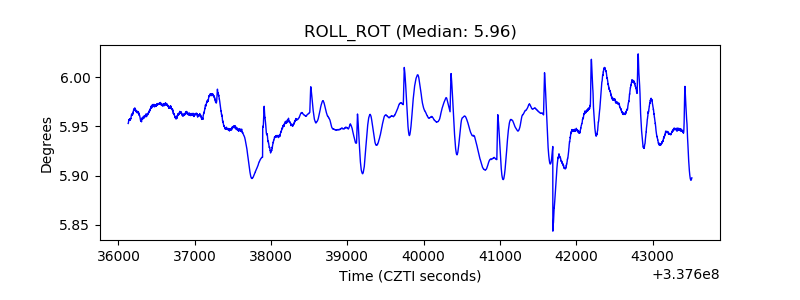 |
| _Roll_DEC | 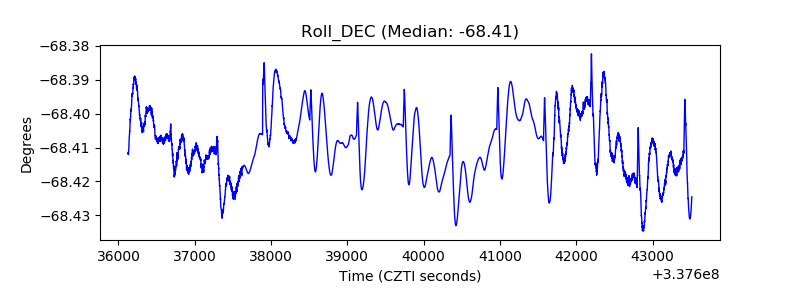 |
| _Roll_RA | 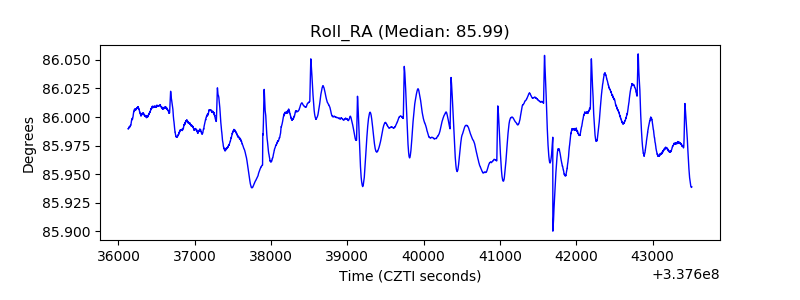 |
| Veto Counter | 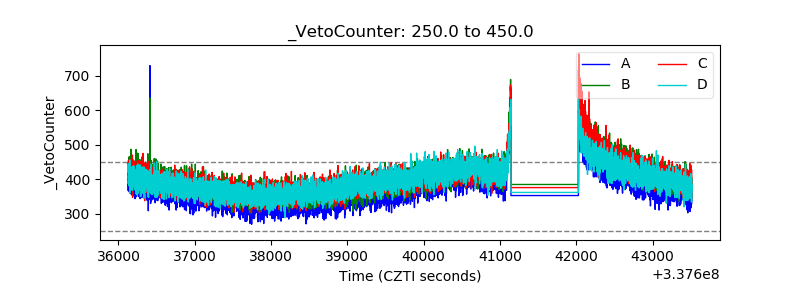 |