| Param | Original file | Final file |
|---|---|---|
| Filename | modeM0/AS1A09_079T01_9000003864_26817cztM0_level2.evt | modeM0/AS1A09_079T01_9000003864_26817cztM0_level2_quad_clean.evt |
| Size (bytes) | 840,496,320 | 111,839,040 |
| Size | 801.6 MB | 106.7 MB |
| Events in quadrant A | 4,003,167 | 797,910 |
| Events in quadrant B | 12,964,102 | 568,291 |
| Events in quadrant C | 3,331,055 | 798,251 |
| Events in quadrant D | 4,713,333 | 763,614 |
| Mode M9 | |||
|---|---|---|---|
| Quadrant | BADHDUFLAG | Total packets | Discarded packets |
| A | 0 | 12 | 0 |
| B | 0 | 13 | 0 |
| C | 0 | 13 | 0 |
| D | 0 | 13 | 0 |
| Mode M0 | |||
|---|---|---|---|
| Quadrant | BADHDUFLAG | Total packets | Discarded packets |
| A | 0 | 16317 | 0 |
| B | 0 | 43022 | 0 |
| C | 0 | 13959 | 0 |
| D | 0 | 18390 | 0 |
| Quadrant | Total seconds | Saturated seconds | Saturation percentage |
|---|---|---|---|
| A | 6559 | 58 | 0.884281% |
| B | 6559 | 3837 | 58.499771% |
| C | 6559 | 89 | 1.356914% |
| D | 6559 | 356 | 5.427657% |
Noise dominated data is calculated using 1-second bins in cleaned event files. If a bin has >2000 counts, and if more than 50% of those come from <1% of pixels, then it is considered to be noise-dominated and hence unusable.
| Quadrant | # 1 sec bins | Bins with >0 counts | Bins with >2000 counts | High rate bins dominated by noise | Noise dominated (total time) | Noise dominated (detector-on time) | Marked lightcurve |
|---|---|---|---|---|---|---|---|
| A | 7594 | 6560 | 0 | 0 | 0.00% | 0.00% | 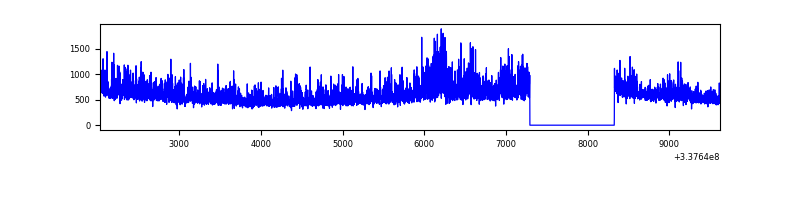 |
| B | 7594 | 6559 | 3200 | 3200 | 42.14% | 48.79% | 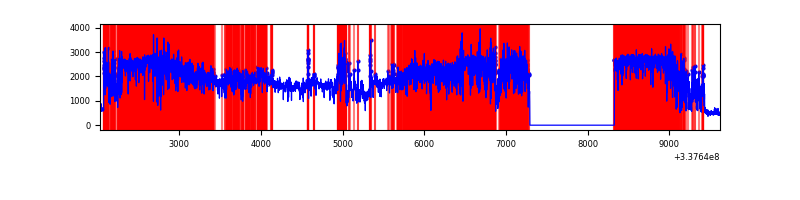 |
| C | 7594 | 6560 | 14 | 14 | 0.18% | 0.21% | 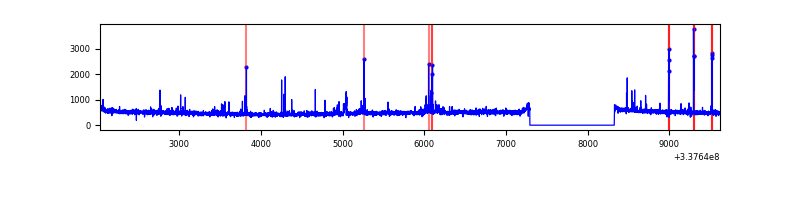 |
| D | 7594 | 6559 | 246 | 246 | 3.24% | 3.75% | 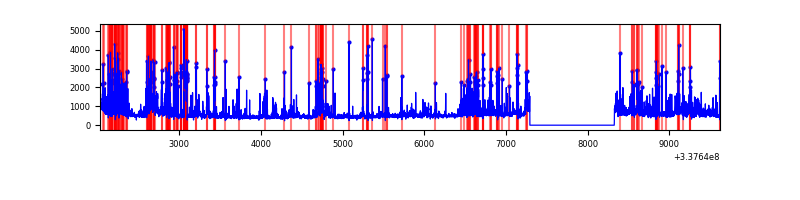 |
Top three noisy pixels from each quadrant. If the there are fewer than three noisy pixels in the level2.evt file, extra rows are filled as -1
| Pixel properties | Quadrant properties | ||||||
|---|---|---|---|---|---|---|---|
| Quadrant | DetID | PixID | Counts | Sigma | Mean | Median | Sigma |
| A | 0 | 13 | 928163 | 5798.25 | 797 | 780 | 159.9 |
| A | 13 | 254 | 10929 | 63.45 | 797 | 780 | 159.9 |
| A | 3 | 137 | 7430 | 41.58 | 797 | 780 | 159.9 |
| B | 0 | 189 | 10443174 | 93055.22 | 593 | 577 | 112.2 |
| B | 10 | 246 | 145229 | 1289.01 | 593 | 577 | 112.2 |
| B | 10 | 251 | 18708 | 161.57 | 593 | 577 | 112.2 |
| C | 14 | 238 | 126228 | 689.06 | 778 | 782 | 182.1 |
| C | 15 | 208 | 86100 | 468.64 | 778 | 782 | 182.1 |
| C | 2 | 16 | 81741 | 444.7 | 778 | 782 | 182.1 |
| D | 1 | 52 | 1084577 | 5947.08 | 764 | 747 | 182.2 |
| D | 2 | 250 | 345583 | 1892.15 | 764 | 747 | 182.2 |
| D | 11 | 176 | 187952 | 1027.21 | 764 | 747 | 182.2 |
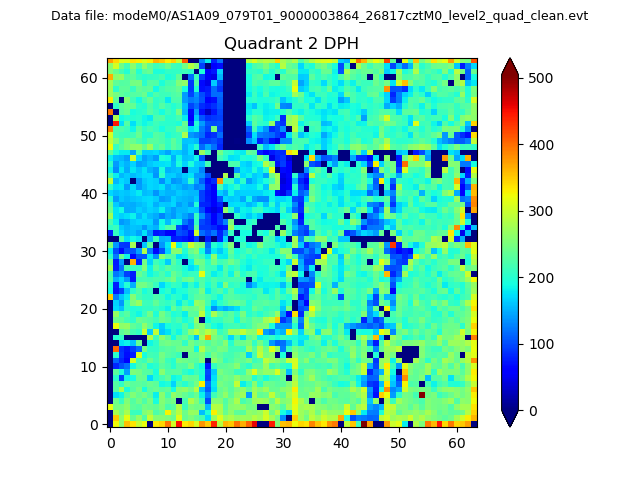
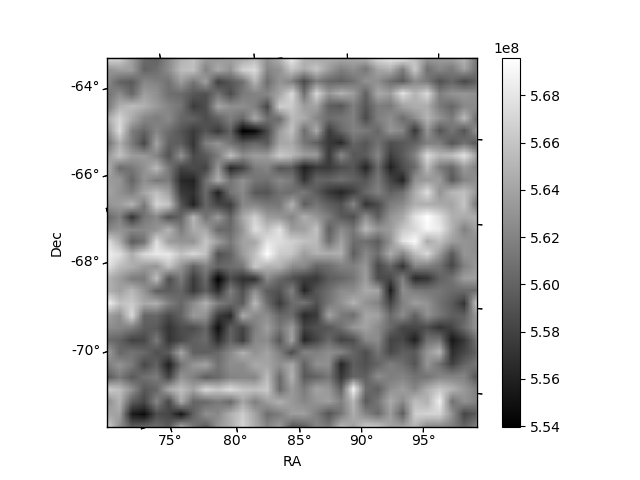
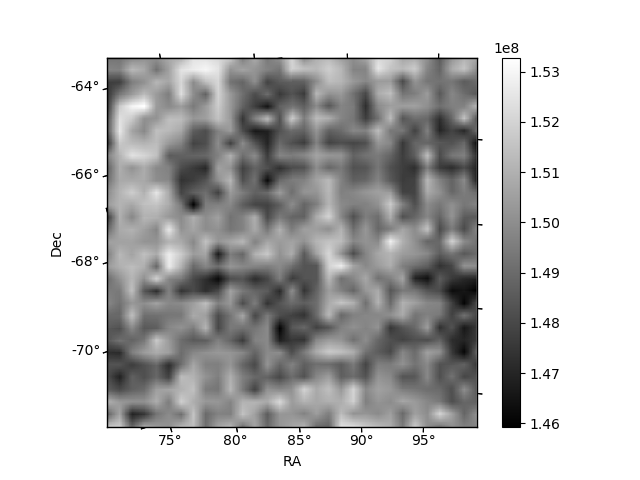
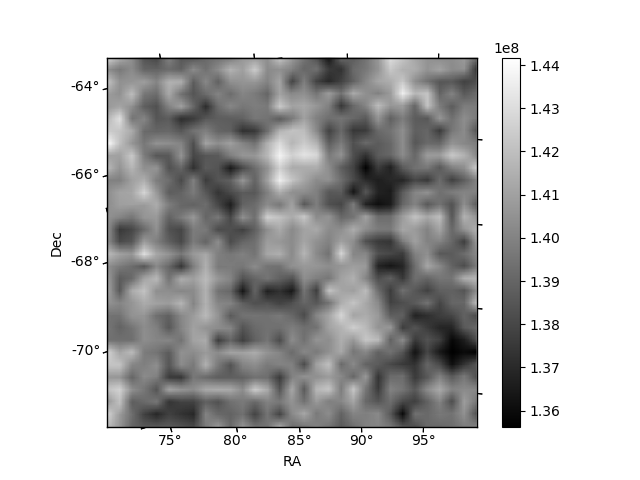
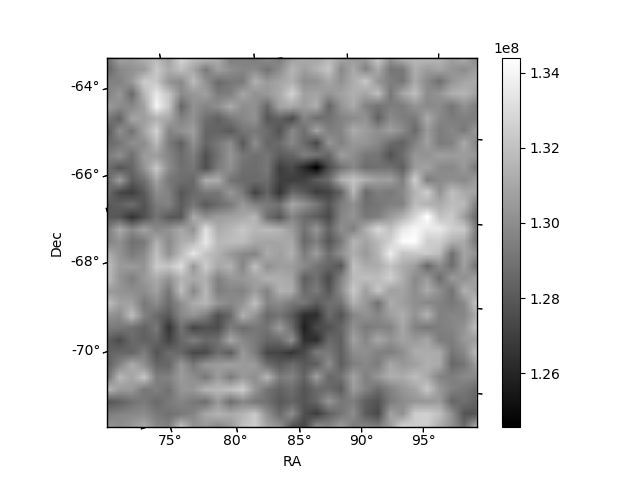
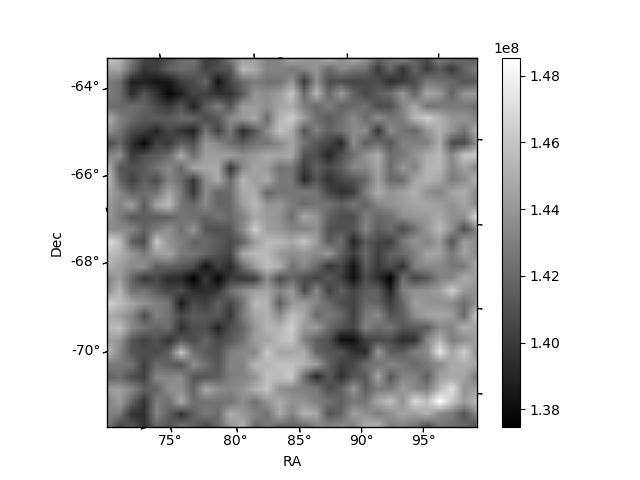
Histogram calculated using DETX and DETY for each event in the final _common_clean file
| Quadrant A | 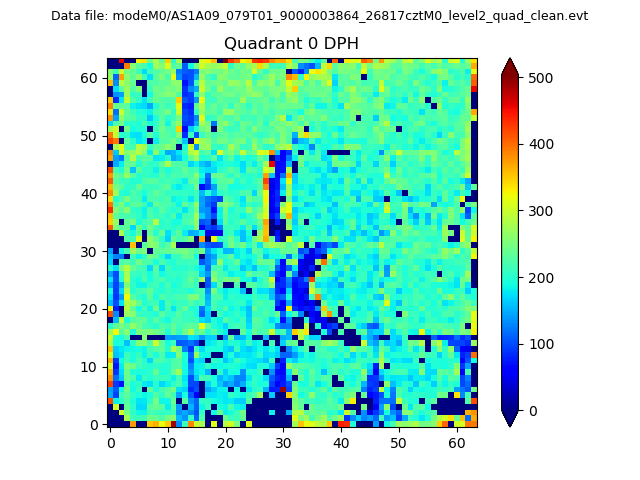 |
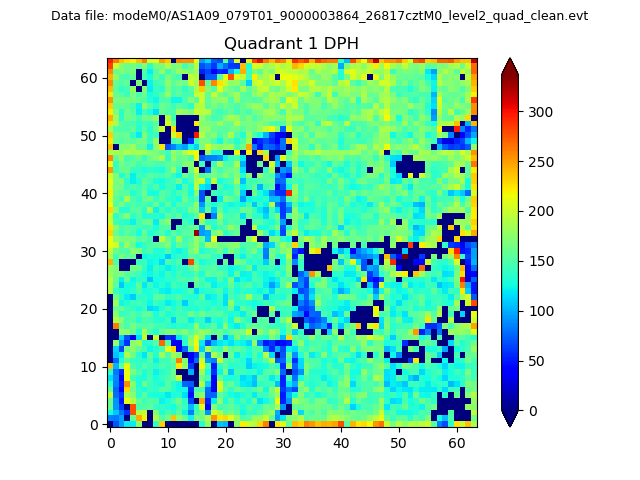 |
Quadrant B |
|---|---|---|---|
| Quadrant D | 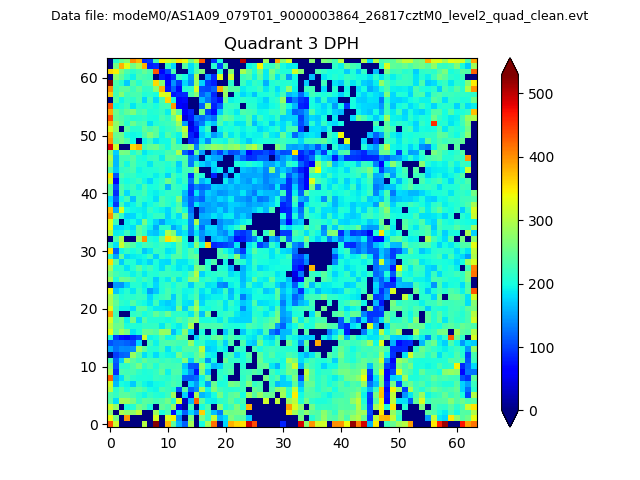 |
 |
Quadrant C |
| Plot type | Count rate plots | Images |
|---|---|---|
| Comparison with Poisson distribution Blue bars denote a histogram of data divided into 1 sec bins. Red curve is a Poisson curve with rate = median count rate of data. |
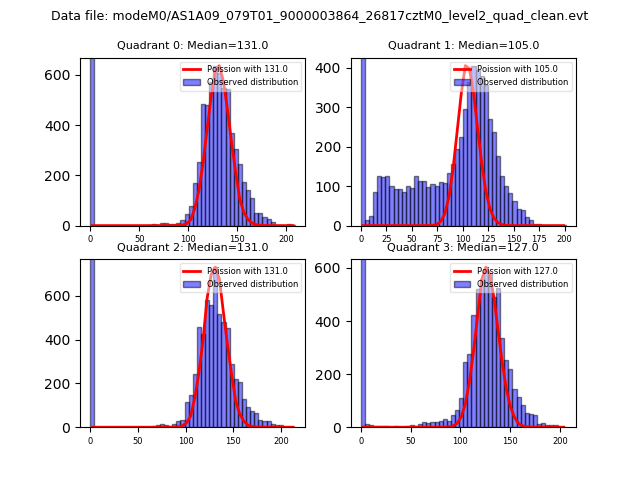 |
 |
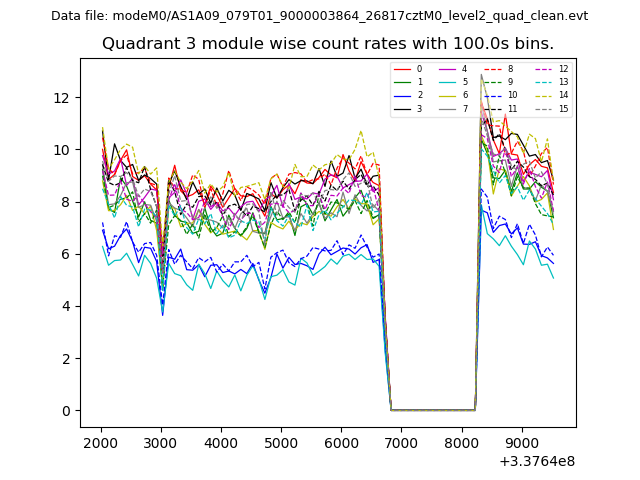
| Quadrant-wise count rates Data is divided into 100 sec bins |
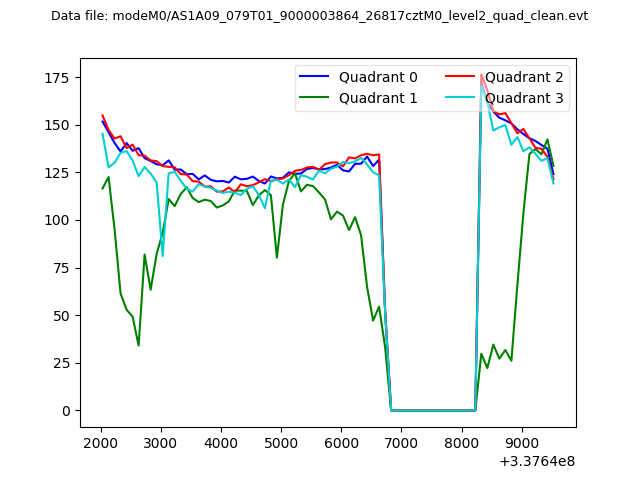 |
|
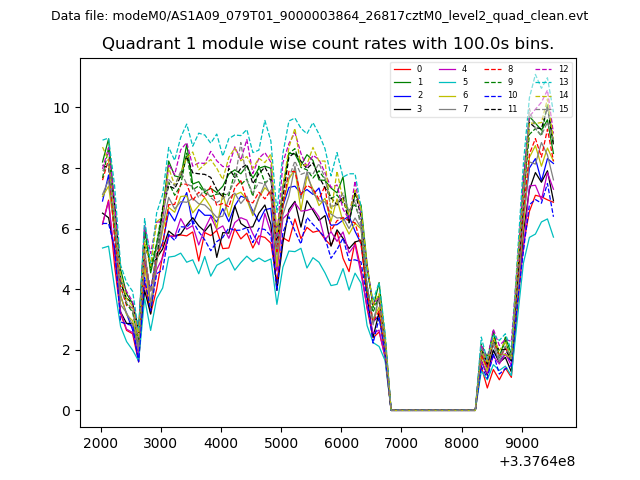
| Module-wise count rates for Quadrant A Data is divided into 100 sec bins |
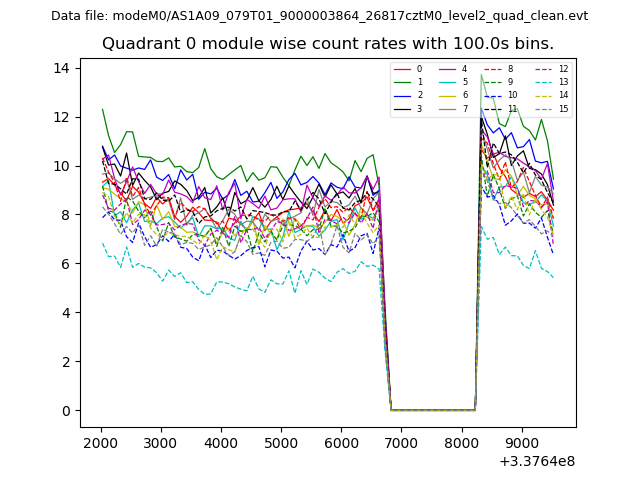 |
 |
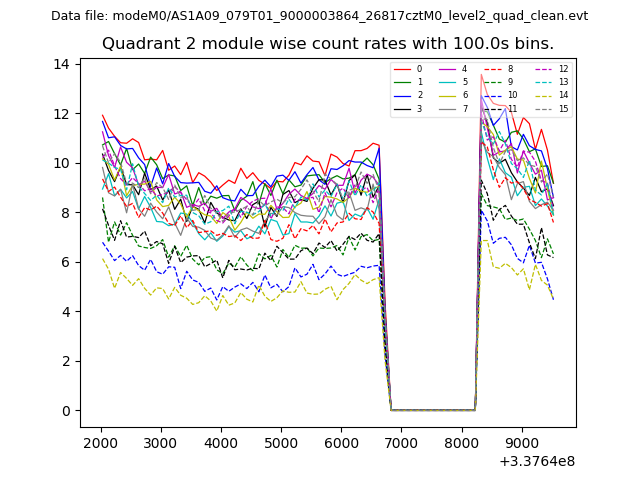
| Module-wise count rates for Quadrant B Data is divided into 100 sec bins |
 |
 |
| Module-wise count rates for Quadrant C Data is divided into 100 sec bins |
 |
 |
| Module-wise count rates for Quadrant D Data is divided into 100 sec bins |
 |
 |
| Parameter | Plot |
|---|---|
| CZT HV Monitor | 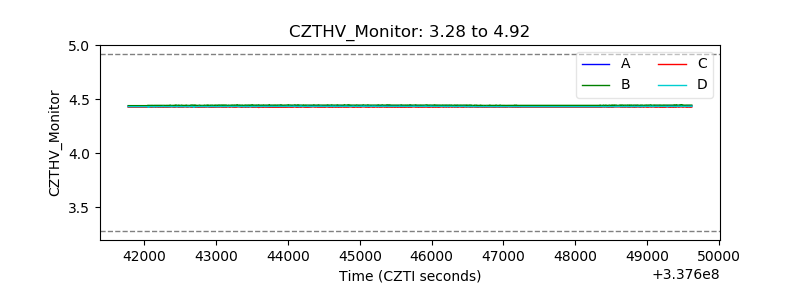 |
| D_VDD | 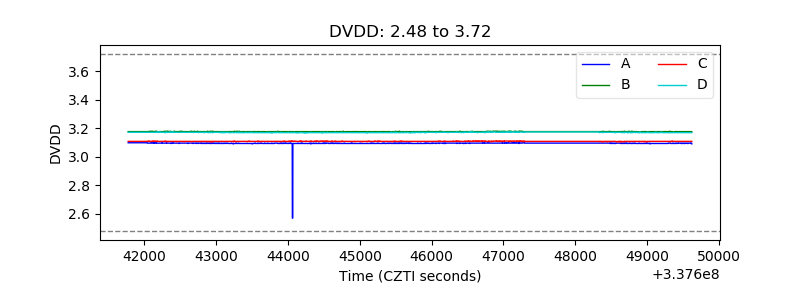 |
| Temperature 1 | 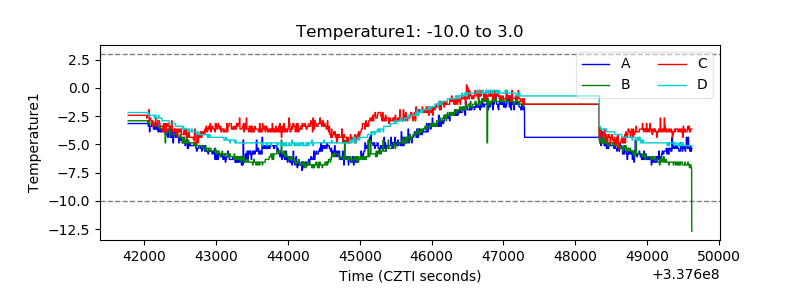 |
| Veto HV Monitor |  |
| Veto LLD | 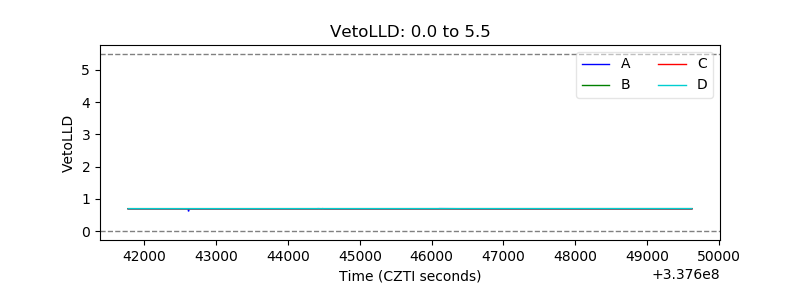 |
| Alpha Counter | 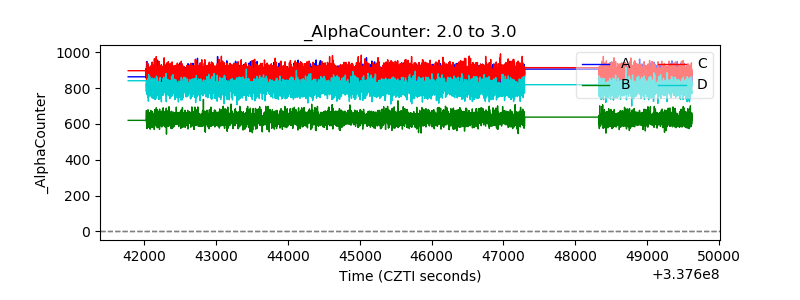 |
| _CPM_Rate | 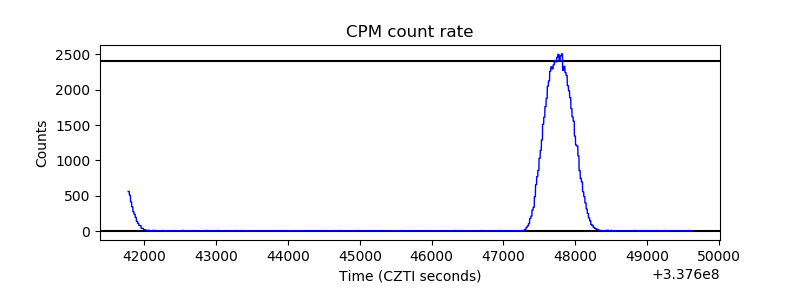 |
| CZT Counter | 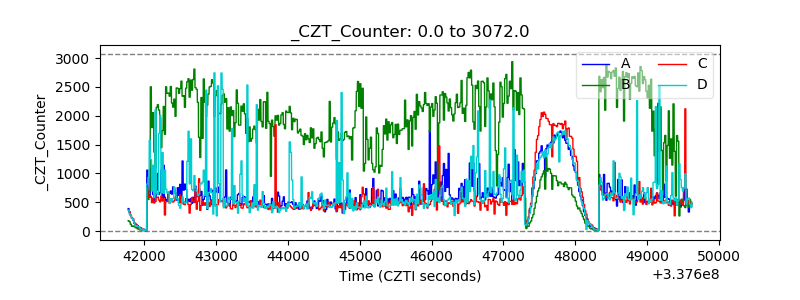 |
| +2.5 Volts monitor |  |
| +5 Volts monitor | 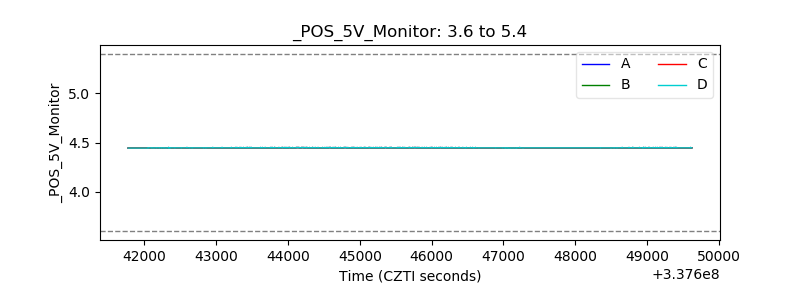 |
| _ROLL_ROT | 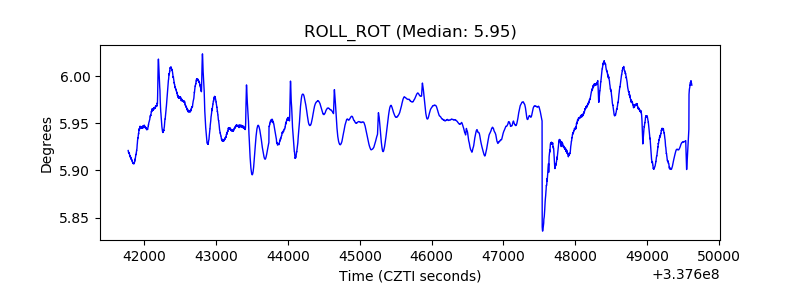 |
| _Roll_DEC | 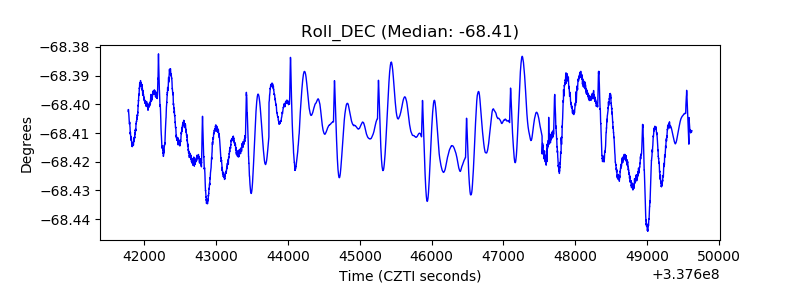 |
| _Roll_RA | 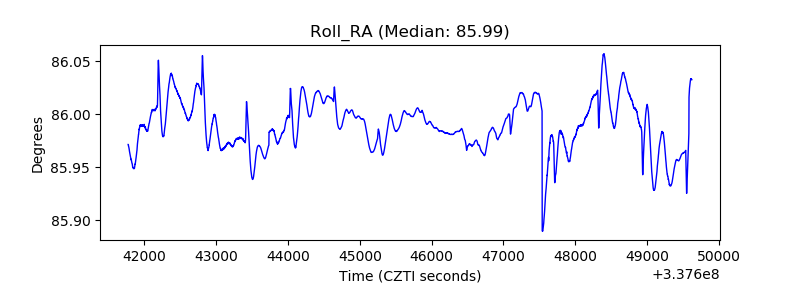 |
| Veto Counter | 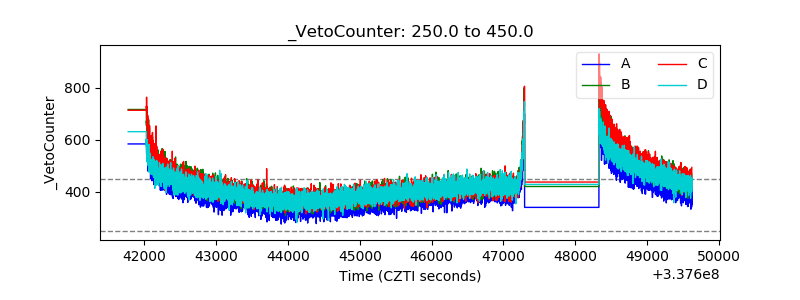 |