| Param | Original file | Final file |
|---|---|---|
| Filename | modeM0/AS1A09_079T01_9000003864_26819cztM0_level2.evt | modeM0/AS1A09_079T01_9000003864_26819cztM0_level2_quad_clean.evt |
| Size (bytes) | 731,612,160 | 112,147,200 |
| Size | 697.7 MB | 107.0 MB |
| Events in quadrant A | 3,913,398 | 788,520 |
| Events in quadrant B | 8,744,662 | 640,782 |
| Events in quadrant C | 3,300,174 | 798,166 |
| Events in quadrant D | 5,768,112 | 723,331 |
| Mode M9 | |||
|---|---|---|---|
| Quadrant | BADHDUFLAG | Total packets | Discarded packets |
| A | 0 | 19 | 0 |
| B | 0 | 20 | 0 |
| C | 0 | 20 | 0 |
| D | 0 | 20 | 0 |
| Mode M0 | |||
|---|---|---|---|
| Quadrant | BADHDUFLAG | Total packets | Discarded packets |
| A | 0 | 15935 | 0 |
| B | 0 | 30261 | 0 |
| C | 0 | 13771 | 0 |
| D | 0 | 21517 | 0 |
| Quadrant | Total seconds | Saturated seconds | Saturation percentage |
|---|---|---|---|
| A | 6370 | 39 | 0.612245% |
| B | 6369 | 2177 | 34.181190% |
| C | 6369 | 95 | 1.491600% |
| D | 6369 | 883 | 13.864029% |
Noise dominated data is calculated using 1-second bins in cleaned event files. If a bin has >2000 counts, and if more than 50% of those come from <1% of pixels, then it is considered to be noise-dominated and hence unusable.
| Quadrant | # 1 sec bins | Bins with >0 counts | Bins with >2000 counts | High rate bins dominated by noise | Noise dominated (total time) | Noise dominated (detector-on time) | Marked lightcurve |
|---|---|---|---|---|---|---|---|
| A | 7550 | 6371 | 3 | 3 | 0.04% | 0.05% | 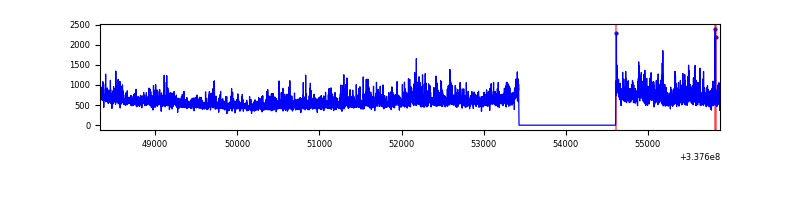 |
| B | 7549 | 6370 | 1986 | 1986 | 26.31% | 31.18% |  |
| C | 7549 | 6370 | 13 | 13 | 0.17% | 0.20% | 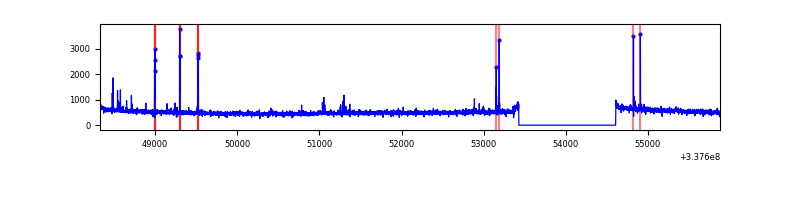 |
| D | 7549 | 6369 | 515 | 515 | 6.82% | 8.09% | 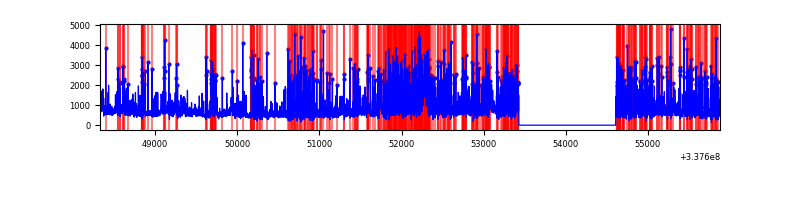 |
Top three noisy pixels from each quadrant. If the there are fewer than three noisy pixels in the level2.evt file, extra rows are filled as -1
| Pixel properties | Quadrant properties | ||||||
|---|---|---|---|---|---|---|---|
| Quadrant | DetID | PixID | Counts | Sigma | Mean | Median | Sigma |
| A | 0 | 13 | 833925 | 5236.94 | 798 | 781 | 159.1 |
| A | 13 | 254 | 9825 | 56.85 | 798 | 781 | 159.1 |
| A | 3 | 137 | 7242 | 40.61 | 798 | 781 | 159.1 |
| B | 0 | 189 | 6128926 | 50522.19 | 644 | 626 | 121.3 |
| B | 10 | 246 | 29428 | 237.45 | 644 | 626 | 121.3 |
| B | 10 | 251 | 21073 | 168.57 | 644 | 626 | 121.3 |
| C | 14 | 238 | 127859 | 693.59 | 789 | 794 | 183.2 |
| C | 15 | 208 | 48099 | 258.21 | 789 | 794 | 183.2 |
| C | 2 | 16 | 47552 | 255.23 | 789 | 794 | 183.2 |
| D | 1 | 52 | 2530045 | 14666.42 | 730 | 716 | 172.5 |
| D | 7 | 80 | 220069 | 1271.93 | 730 | 716 | 172.5 |
| D | 2 | 250 | 204902 | 1183.98 | 730 | 716 | 172.5 |
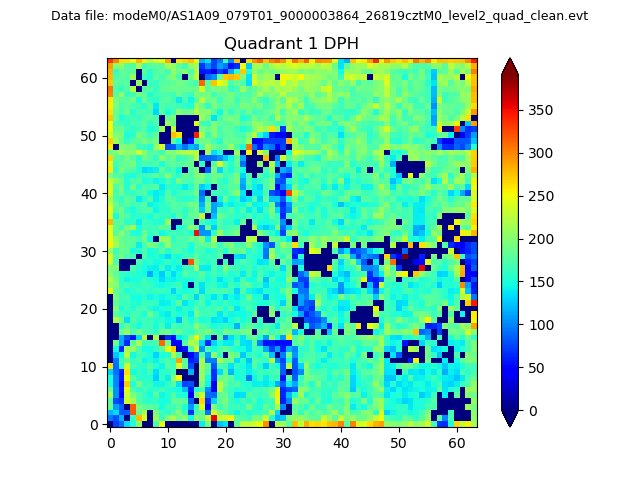
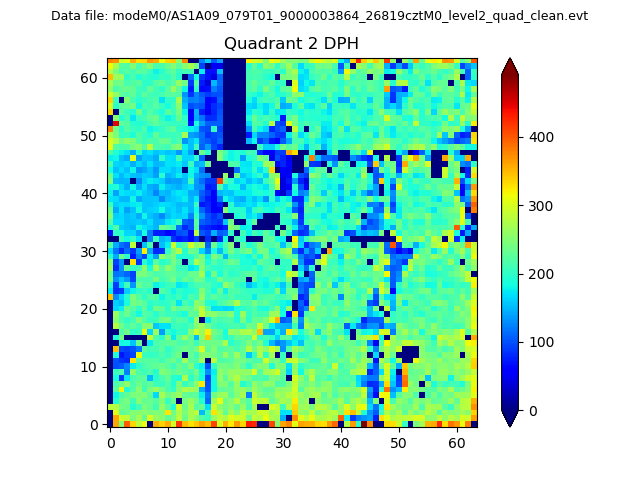
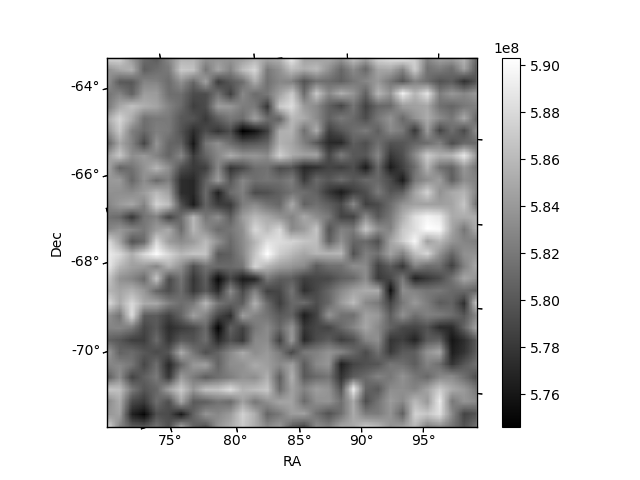
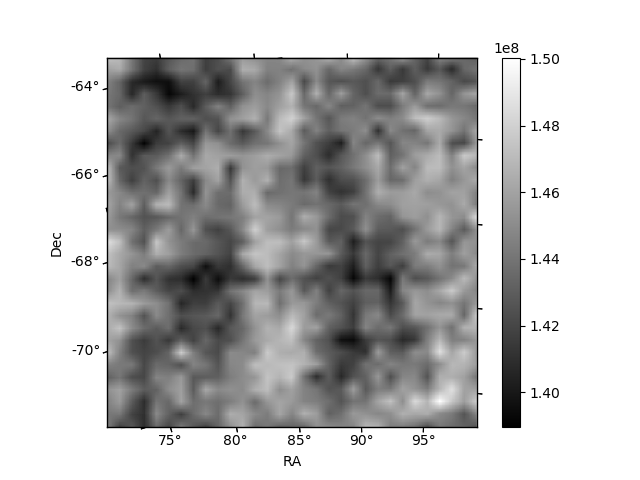
Histogram calculated using DETX and DETY for each event in the final _common_clean file
| Quadrant A | 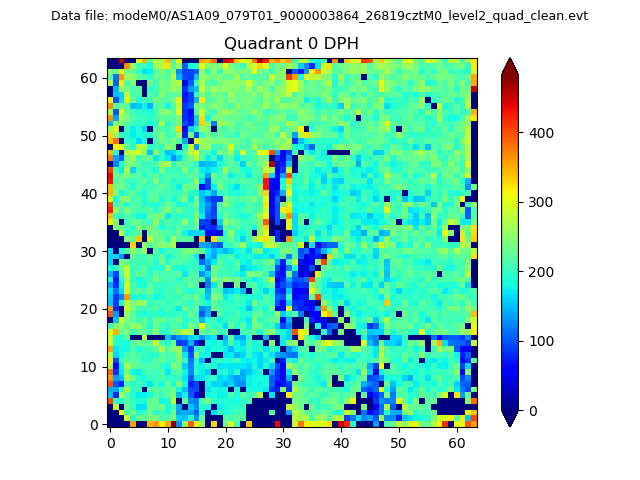 |
 |
Quadrant B |
|---|---|---|---|
| Quadrant D | 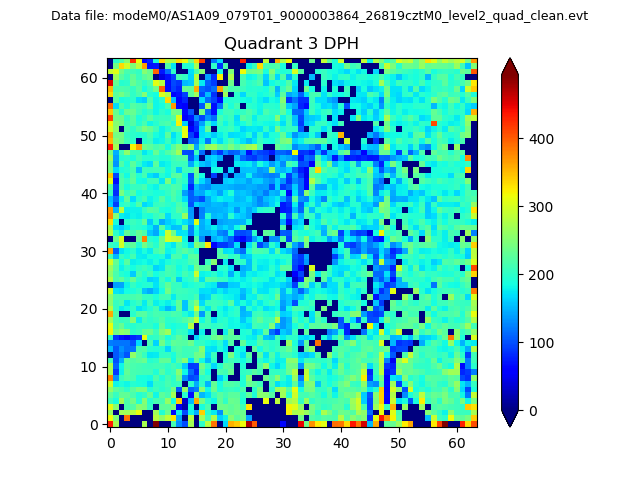 |
 |
Quadrant C |
| Plot type | Count rate plots | Images |
|---|---|---|
| Comparison with Poisson distribution Blue bars denote a histogram of data divided into 1 sec bins. Red curve is a Poisson curve with rate = median count rate of data. |
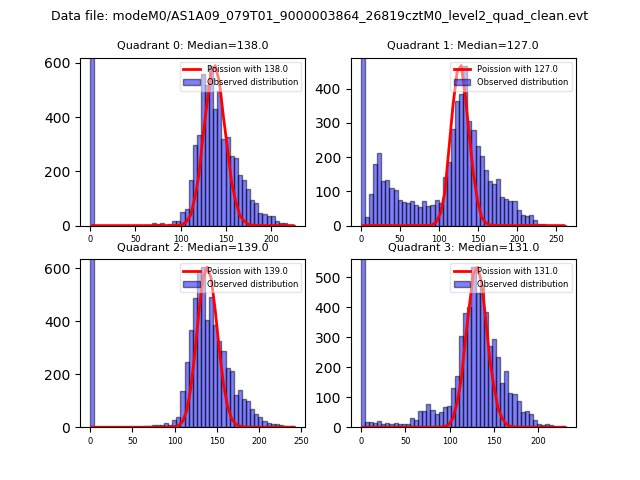 |
 |
| Quadrant-wise count rates Data is divided into 100 sec bins |
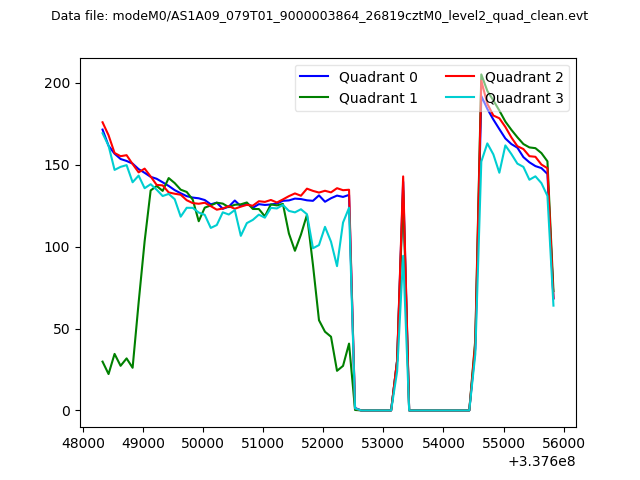 |
|
| Module-wise count rates for Quadrant A Data is divided into 100 sec bins |
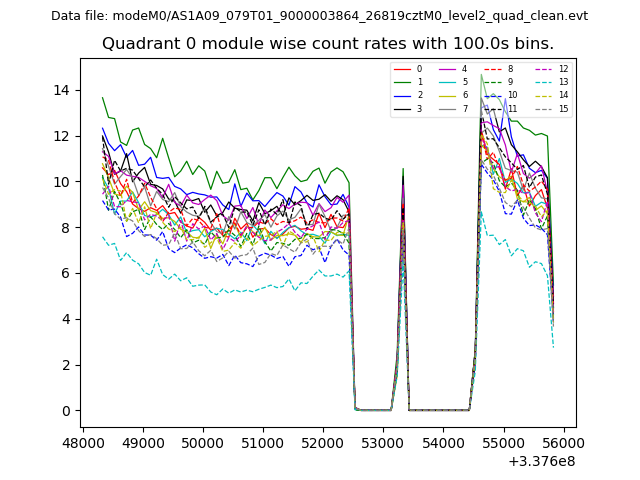 |
 |
| Module-wise count rates for Quadrant B Data is divided into 100 sec bins |
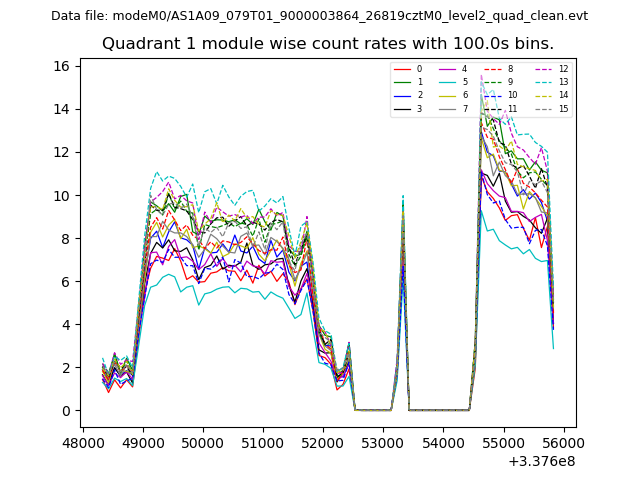 |
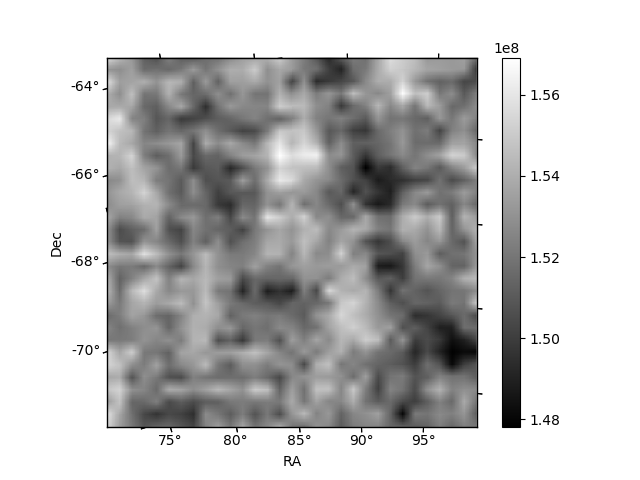 |
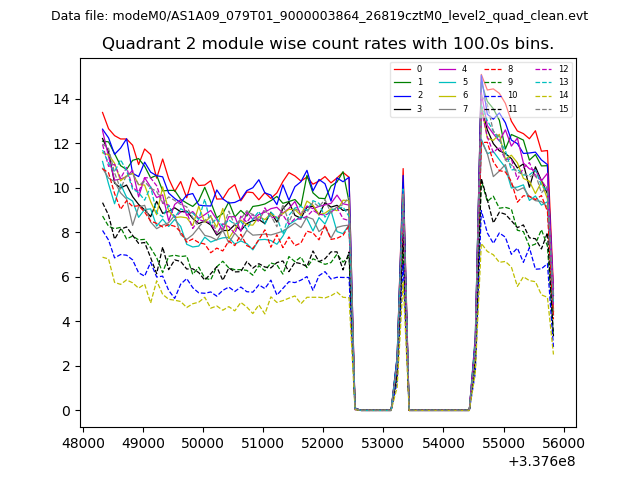
| Module-wise count rates for Quadrant C Data is divided into 100 sec bins |
 |
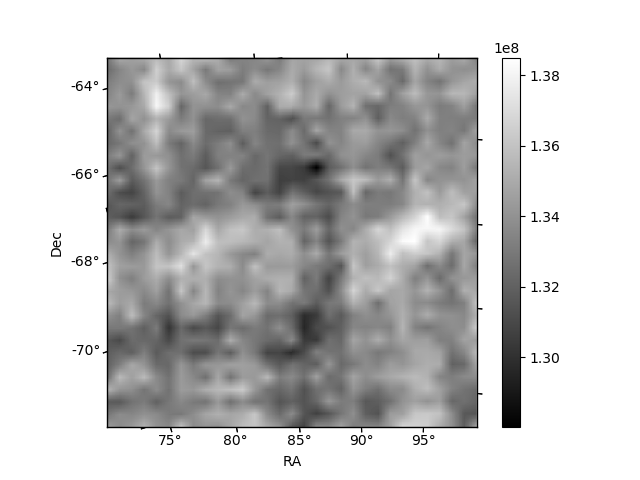 |
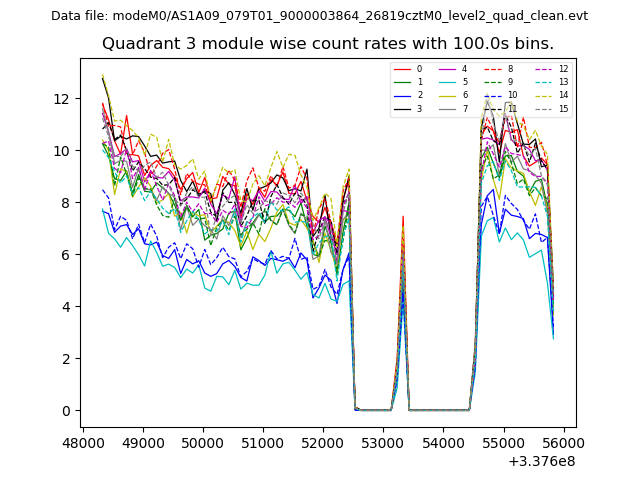
| Module-wise count rates for Quadrant D Data is divided into 100 sec bins |
 |
 |
| Parameter | Plot |
|---|---|
| CZT HV Monitor | 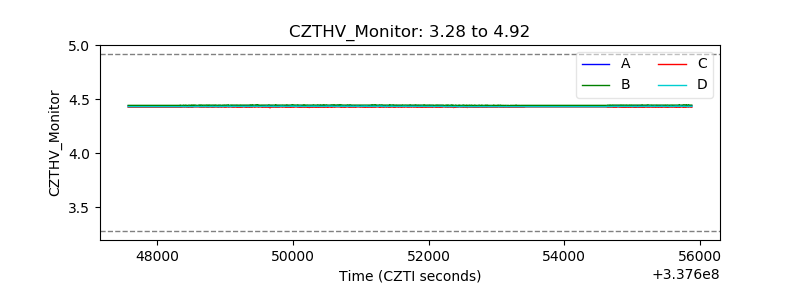 |
| D_VDD |  |
| Temperature 1 | 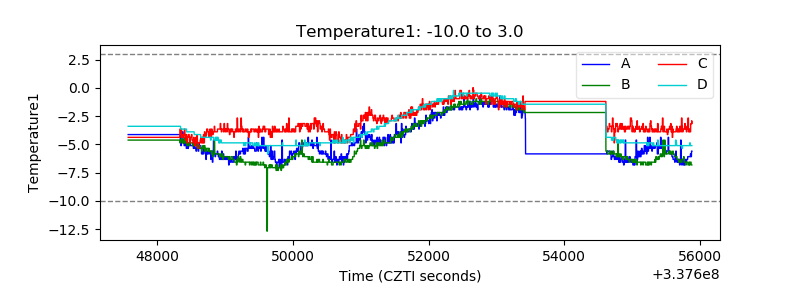 |
| Veto HV Monitor | 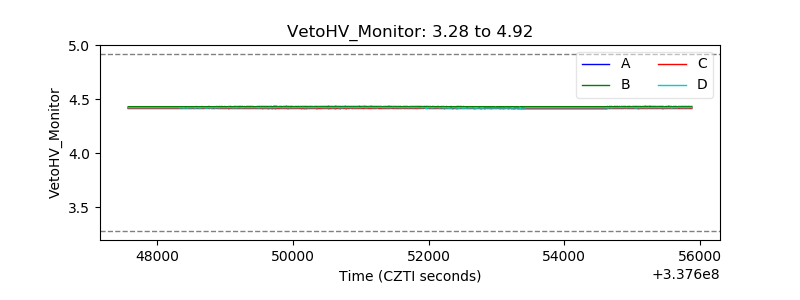 |
| Veto LLD | 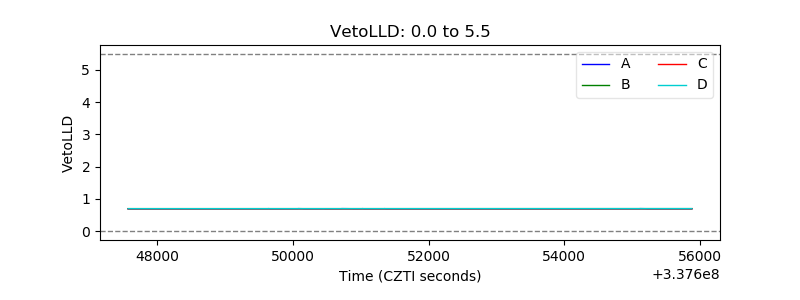 |
| Alpha Counter | 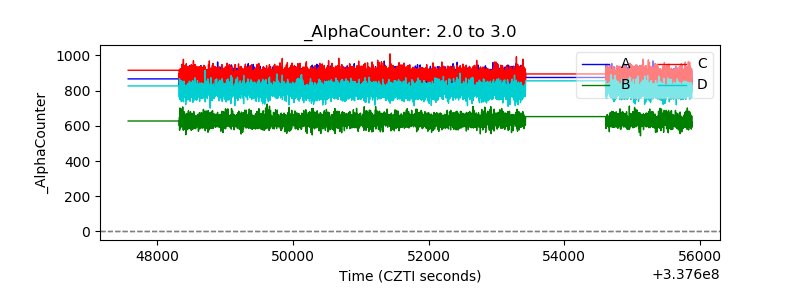 |
| _CPM_Rate | 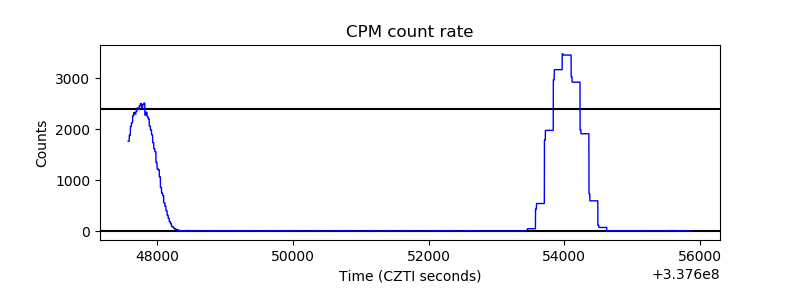 |
| CZT Counter | 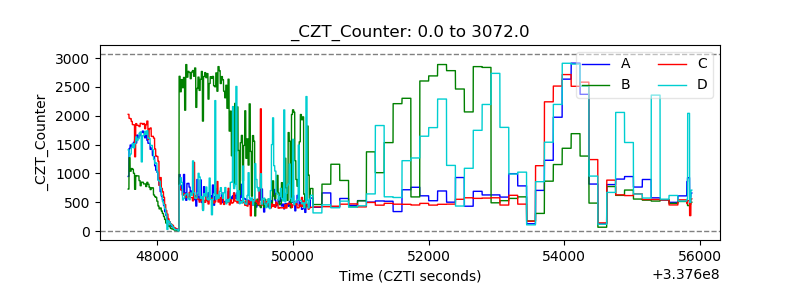 |
| +2.5 Volts monitor | 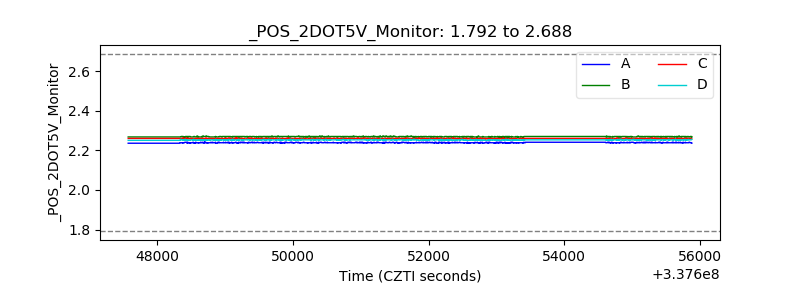 |
| +5 Volts monitor |  |
| _ROLL_ROT | 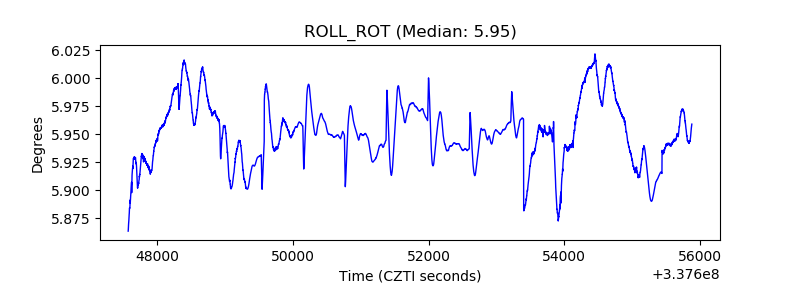 |
| _Roll_DEC | 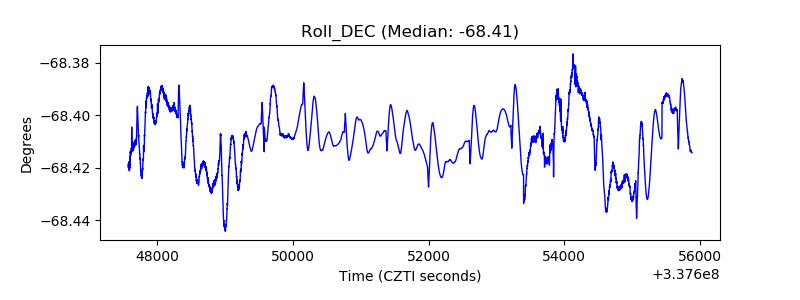 |
| _Roll_RA | 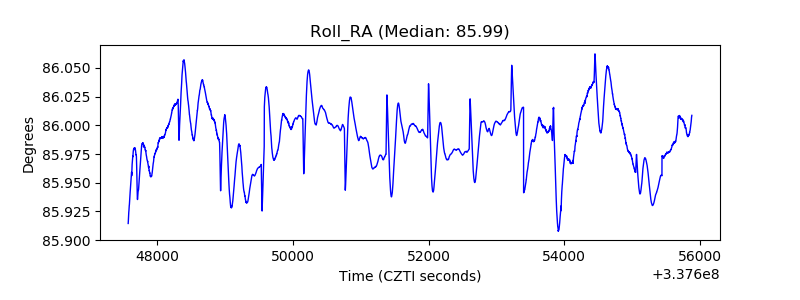 |
| Veto Counter | 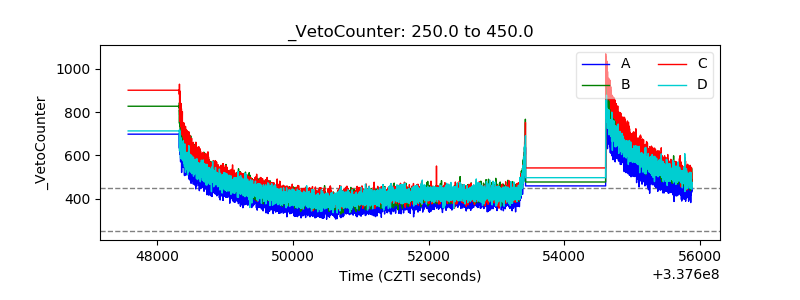 |