| Param | Original file | Final file |
|---|---|---|
| Filename | modeM0/AS1A09_145T01_9000003866cztM0_level2.fits | modeM0/AS1A09_145T01_9000003866cztM0_level2_quad_clean.evt |
| Size (bytes) | 1,196,236,800 | 978,246,720 |
| Size | 1.1 GB | 932.9 MB |
| Events in quadrant A | 7,566,248 | 5,775,235 |
| Events in quadrant B | 7,047,480 | 5,612,546 |
| Events in quadrant C | 7,386,694 | 5,531,753 |
| Events in quadrant D | 5,989,088 | 4,478,480 |
| Mode M9 | |||
|---|---|---|---|
| Quadrant | BADHDUFLAG | Total packets | Discarded packets |
| A | 0 | 187 | 0 |
| B | 0 | 187 | 0 |
| C | 0 | 187 | 0 |
| D | 0 | 187 | 0 |
| Mode M0 | |||
|---|---|---|---|
| Quadrant | BADHDUFLAG | Total packets | Discarded packets |
| A | 0 | 310835 | 0 |
| B | 0 | 318729 | 0 |
| C | 0 | 254292 | 0 |
| D | 0 | 456782 | 0 |
| Mode SS | |||
|---|---|---|---|
| Quadrant | BADHDUFLAG | Total packets | Discarded packets |
| A | 0 | 2448 | 0 |
| B | 0 | 2448 | 0 |
| C | 0 | 2448 | 0 |
| D | 0 | 2448 | 0 |
| Quadrant | Total seconds | Saturated seconds | Saturation percentage |
|---|---|---|---|
| A | 120035 | 2708 | 2.256009% |
| B | 120035 | 8633 | 7.192069% |
| C | 120036 | 2332 | 1.942751% |
| D | 120036 | 20347 | 16.950748% |
Noise dominated data is calculated using 1-second bins in cleaned event files. If a bin has >2000 counts, and if more than 50% of those come from <1% of pixels, then it is considered to be noise-dominated and hence unusable.
| Quadrant | # 1 sec bins | Bins with >0 counts | Bins with >2000 counts | High rate bins dominated by noise | Noise dominated (total time) | Noise dominated (detector-on time) | Marked lightcurve |
|---|---|---|---|---|---|---|---|
| A | 144310 | 120031 | 0 | 0 | 0.00% | 0.00% |  |
| B | 144310 | 119861 | 0 | 0 | 0.00% | 0.00% | 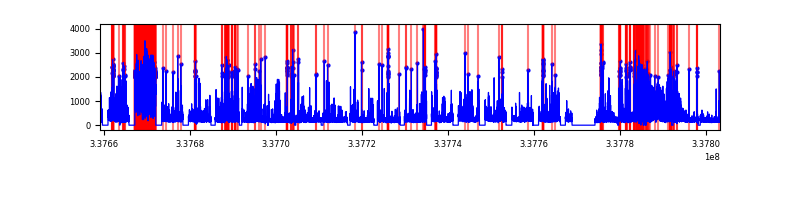 |
| C | 144310 | 120028 | 0 | 0 | 0.00% | 0.00% |  |
| D | 144310 | 119749 | 0 | 0 | 0.00% | 0.00% |  |
Top three noisy pixels from each quadrant. If the there are fewer than three noisy pixels in the level2.evt file, extra rows are filled as -1
| Pixel properties | Quadrant properties | ||||||
|---|---|---|---|---|---|---|---|
| Quadrant | DetID | PixID | Counts | Sigma | Mean | Median | Sigma |
| A | 0 | 29 | 6213 | 9.05 | 1971 | 1853 | 481.8 |
| A | 7 | 110 | 6175 | 8.97 | 1971 | 1853 | 481.8 |
| A | 9 | 19 | 5643 | 7.87 | 1971 | 1853 | 481.8 |
| B | 2 | 9 | 5579 | 10.54 | 1861 | 1775 | 360.9 |
| B | 2 | 8 | 4692 | 8.08 | 1861 | 1775 | 360.9 |
| B | 5 | 128 | 4572 | 7.75 | 1861 | 1775 | 360.9 |
| C | 12 | 241 | 5109 | 6.68 | 1952 | 1828 | 491.4 |
| C | 3 | 126 | 5057 | 6.57 | 1952 | 1828 | 491.4 |
| C | 2 | 191 | 4916 | 6.28 | 1952 | 1828 | 491.4 |
| D | 4 | 246 | 4741 | 6.99 | 1706 | 1553 | 456.0 |
| D | 3 | 14 | 4287 | 5.99 | 1706 | 1553 | 456.0 |
| D | 1 | 19 | 4149 | 5.69 | 1706 | 1553 | 456.0 |
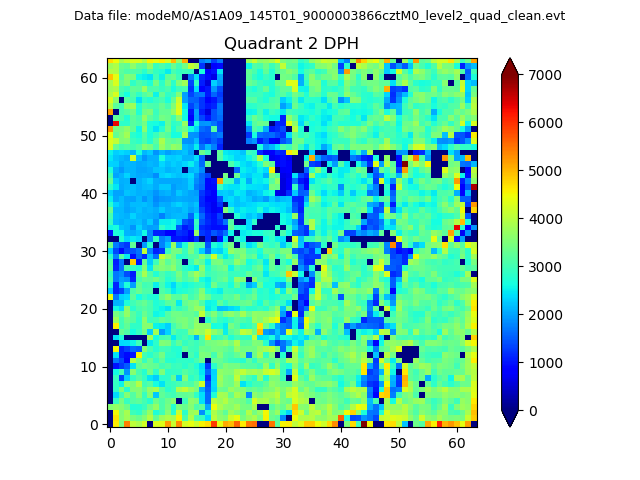
Histogram calculated using DETX and DETY for each event in the final _common_clean file
| Quadrant A |  |
 |
Quadrant B |
|---|---|---|---|
| Quadrant D | 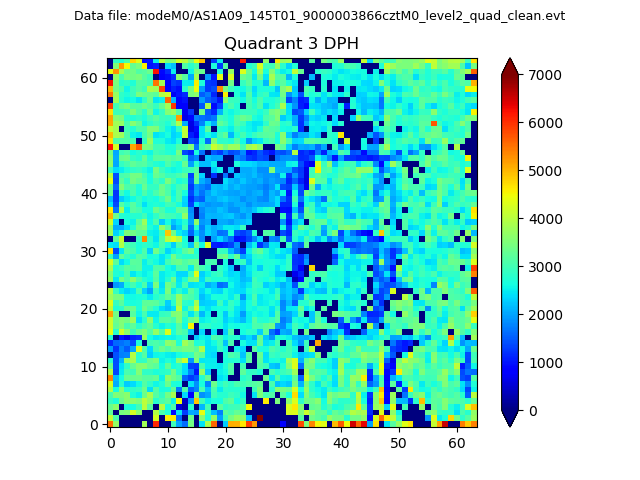 |
 |
Quadrant C |
| Plot type | Count rate plots | Images |
|---|---|---|
| Comparison with Poisson distribution Blue bars denote a histogram of data divided into 1 sec bins. Red curve is a Poisson curve with rate = median count rate of data. |
 |
 |
| Quadrant-wise count rates Data is divided into 100 sec bins |
 |
|
| Module-wise count rates for Quadrant A Data is divided into 100 sec bins |
 |
 |
| Module-wise count rates for Quadrant B Data is divided into 100 sec bins |
 |
 |
| Module-wise count rates for Quadrant C Data is divided into 100 sec bins |
 |
 |
| Module-wise count rates for Quadrant D Data is divided into 100 sec bins |
 |
 |
| Parameter | Plot |
|---|---|
| CZT HV Monitor |  |
| D_VDD | 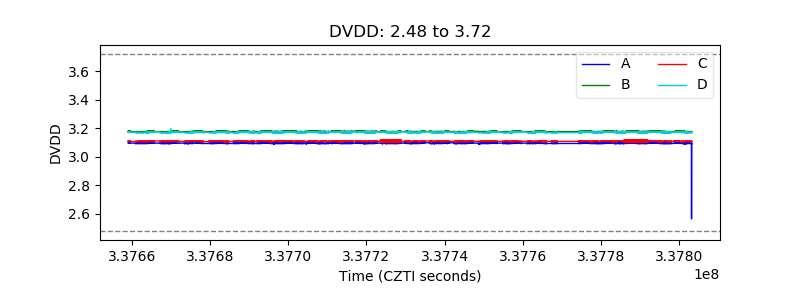 |
| Temperature 1 |  |
| Veto HV Monitor |  |
| Veto LLD |  |
| Alpha Counter |  |
| _CPM_Rate |  |
| CZT Counter |  |
| +2.5 Volts monitor |  |
| +5 Volts monitor |  |
| _ROLL_ROT |  |
| _Roll_DEC |  |
| _Roll_RA |  |
| Veto Counter |  |