| Param | Original file | Final file |
|---|---|---|
| Filename | modeM0/AS1A09_145T01_9000003866_26820cztM0_level2.evt | modeM0/AS1A09_145T01_9000003866_26820cztM0_level2_quad_clean.evt |
| Size (bytes) | 244,284,480 | 43,718,400 |
| Size | 233.0 MB | 41.7 MB |
| Events in quadrant A | 1,734,338 | 305,724 |
| Events in quadrant B | 1,705,338 | 306,790 |
| Events in quadrant C | 1,281,566 | 297,610 |
| Events in quadrant D | 2,524,702 | 252,888 |
| Mode M9 | |||
|---|---|---|---|
| Quadrant | BADHDUFLAG | Total packets | Discarded packets |
| A | 0 | 13 | 0 |
| B | 0 | 13 | 0 |
| C | 0 | 13 | 0 |
| D | 0 | 13 | 0 |
| Mode M0 | |||
|---|---|---|---|
| Quadrant | BADHDUFLAG | Total packets | Discarded packets |
| A | 0 | 6776 | 0 |
| B | 0 | 6576 | 0 |
| C | 0 | 5142 | 0 |
| D | 0 | 9062 | 0 |
| Quadrant | Total seconds | Saturated seconds | Saturation percentage |
|---|---|---|---|
| A | 2221 | 41 | 1.846015% |
| B | 2221 | 179 | 8.059433% |
| C | 2221 | 50 | 2.251238% |
| D | 2221 | 518 | 23.322828% |
Noise dominated data is calculated using 1-second bins in cleaned event files. If a bin has >2000 counts, and if more than 50% of those come from <1% of pixels, then it is considered to be noise-dominated and hence unusable.
| Quadrant | # 1 sec bins | Bins with >0 counts | Bins with >2000 counts | High rate bins dominated by noise | Noise dominated (total time) | Noise dominated (detector-on time) | Marked lightcurve |
|---|---|---|---|---|---|---|---|
| A | 3516 | 2222 | 6 | 6 | 0.17% | 0.27% | 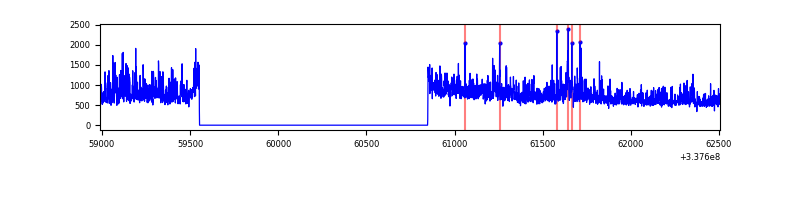 |
| B | 3516 | 2222 | 123 | 123 | 3.50% | 5.54% | 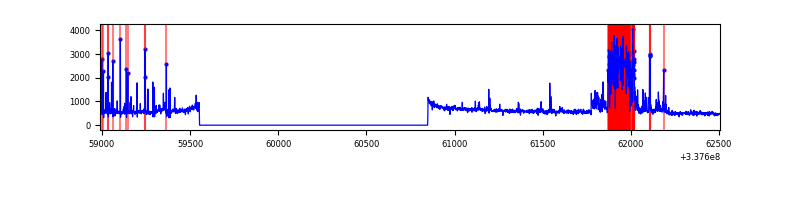 |
| C | 3516 | 2222 | 3 | 3 | 0.09% | 0.14% | 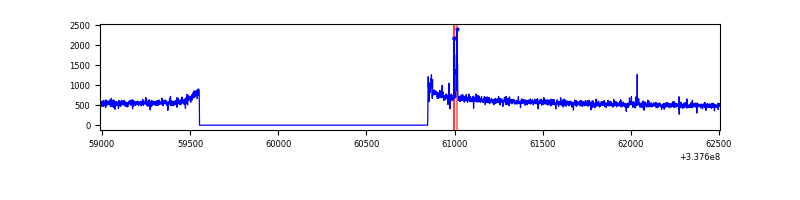 |
| D | 3516 | 2222 | 333 | 333 | 9.47% | 14.99% | 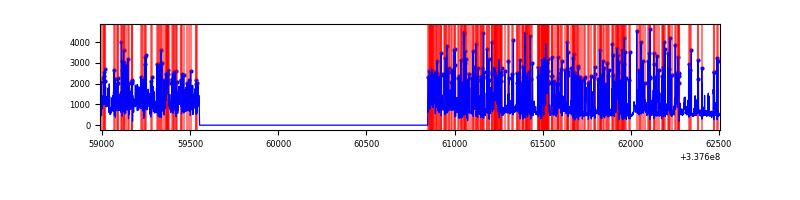 |
Top three noisy pixels from each quadrant. If the there are fewer than three noisy pixels in the level2.evt file, extra rows are filled as -1
| Pixel properties | Quadrant properties | ||||||
|---|---|---|---|---|---|---|---|
| Quadrant | DetID | PixID | Counts | Sigma | Mean | Median | Sigma |
| A | 0 | 13 | 501241 | 7689.04 | 319 | 314 | 65.1 |
| A | 13 | 254 | 3708 | 52.1 | 319 | 314 | 65.1 |
| A | 0 | 226 | 2735 | 37.16 | 319 | 314 | 65.1 |
| B | 10 | 246 | 401838 | 6682.41 | 314 | 308 | 60.1 |
| B | 0 | 189 | 50388 | 833.45 | 314 | 308 | 60.1 |
| B | 3 | 64 | 10838 | 175.24 | 314 | 308 | 60.1 |
| C | 14 | 238 | 52095 | 700.52 | 310 | 313 | 73.9 |
| C | 15 | 208 | 17697 | 235.17 | 310 | 313 | 73.9 |
| C | 2 | 16 | 2825 | 33.98 | 310 | 313 | 73.9 |
| D | 1 | 52 | 1021455 | 15459.09 | 273 | 268 | 66.1 |
| D | 7 | 80 | 420834 | 6366.68 | 273 | 268 | 66.1 |
| D | 2 | 250 | 39788 | 598.27 | 273 | 268 | 66.1 |
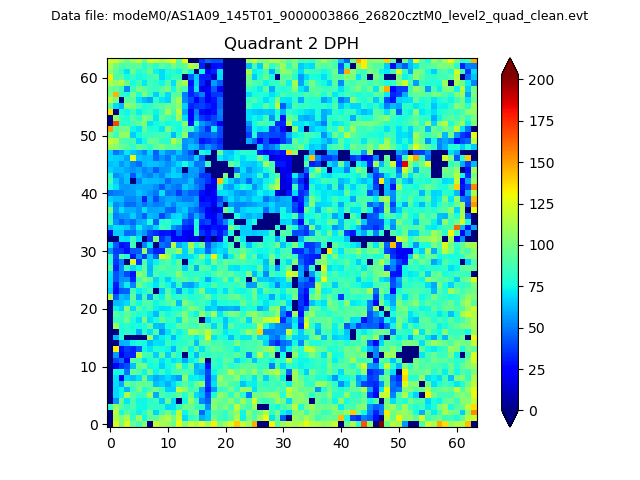
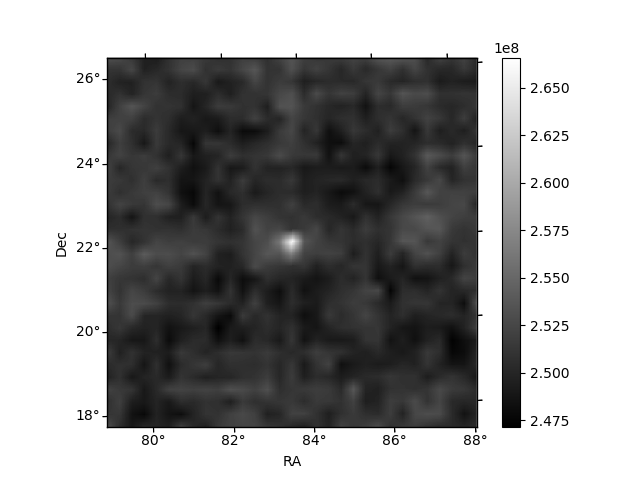
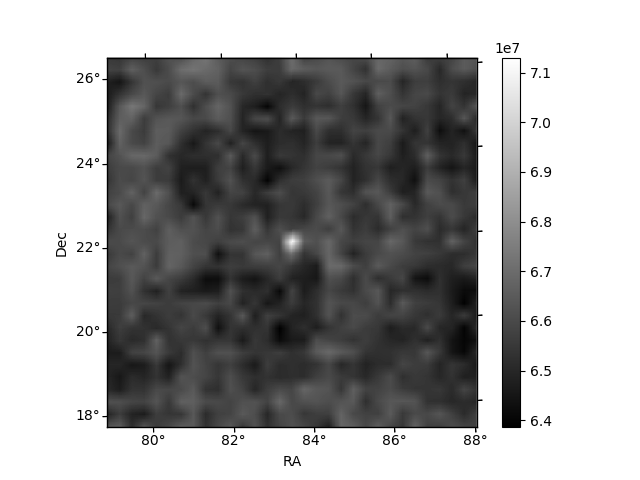
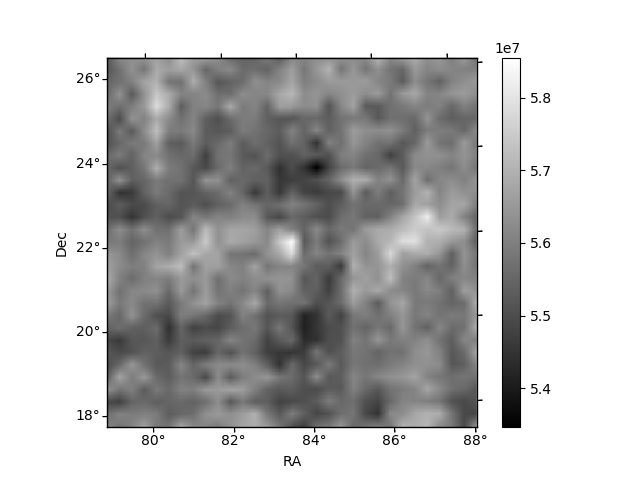
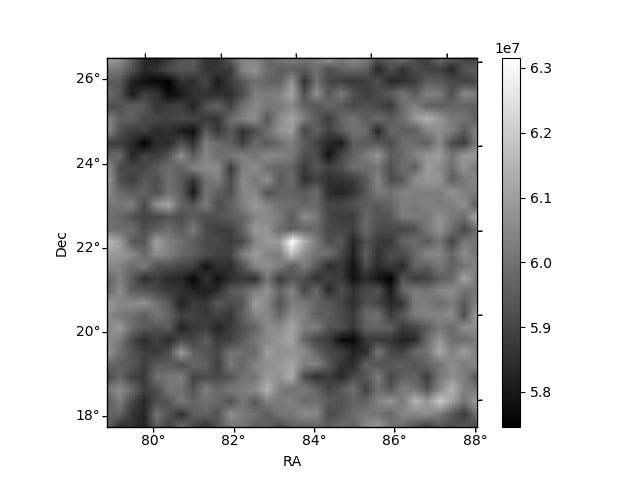
Histogram calculated using DETX and DETY for each event in the final _common_clean file
| Quadrant A | 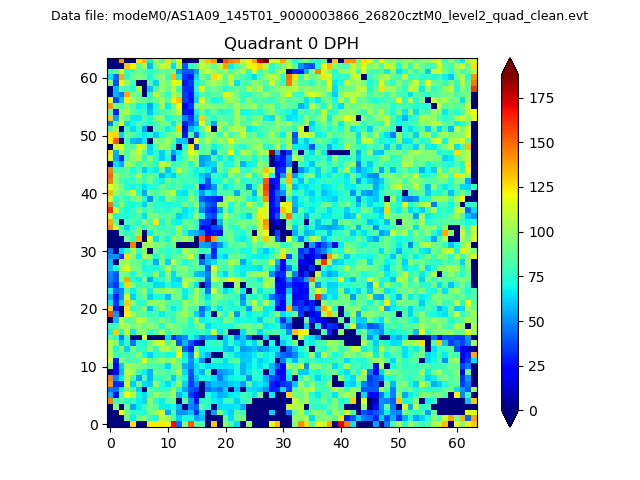 |
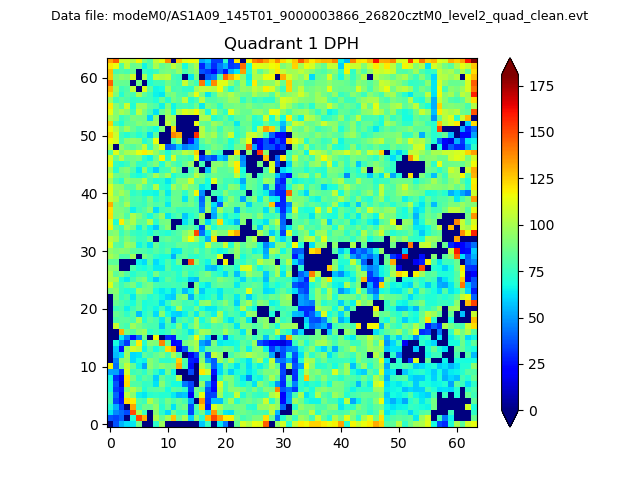 |
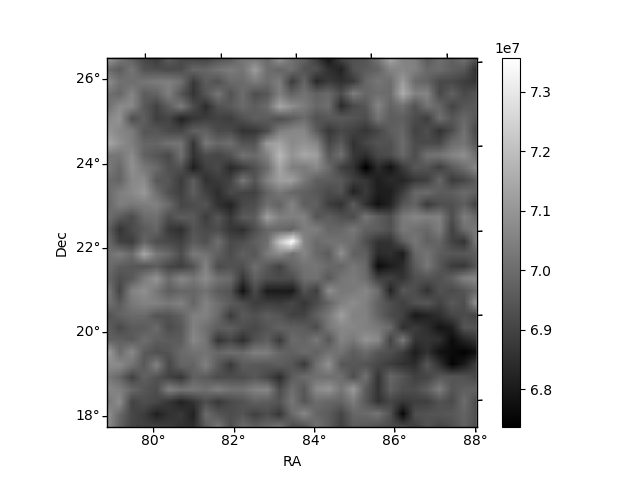
Quadrant B |
|---|---|---|---|
| Quadrant D | 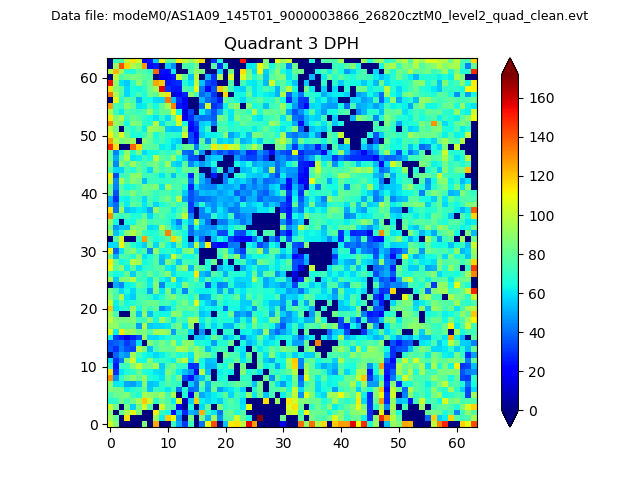 |
 |
Quadrant C |
| Plot type | Count rate plots | Images |
|---|---|---|
| Comparison with Poisson distribution Blue bars denote a histogram of data divided into 1 sec bins. Red curve is a Poisson curve with rate = median count rate of data. |
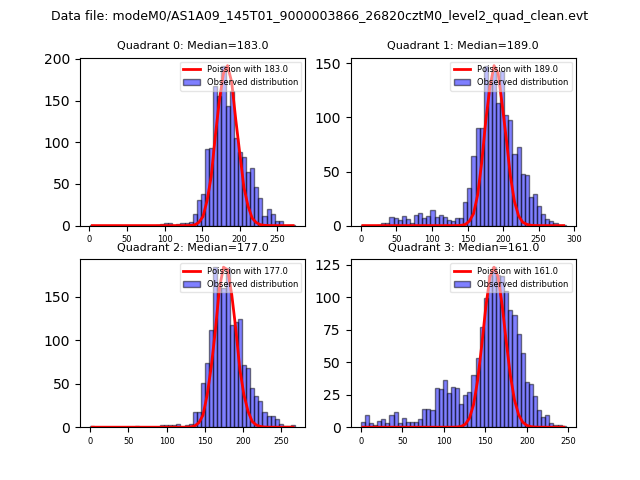 |
 |
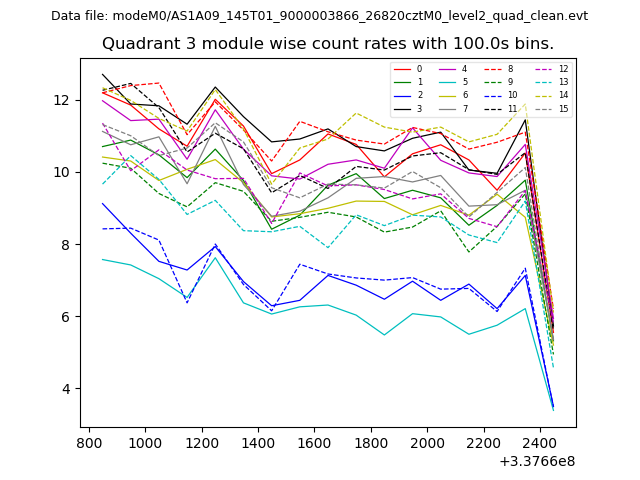
| Quadrant-wise count rates Data is divided into 100 sec bins |
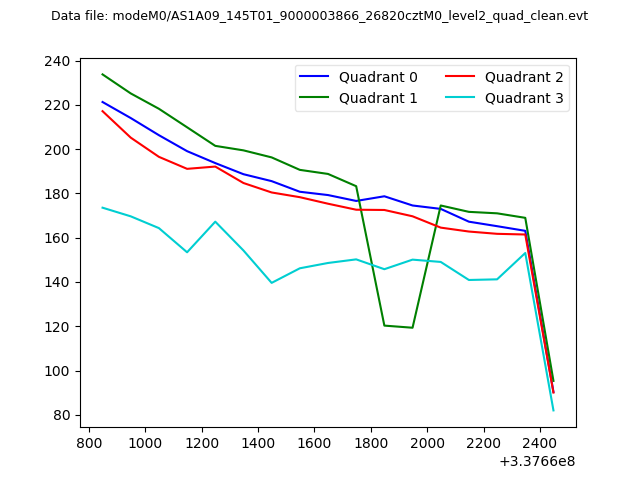 |
|
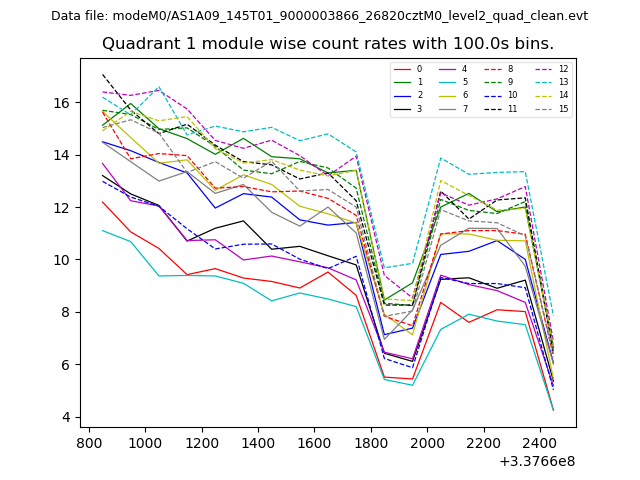
| Module-wise count rates for Quadrant A Data is divided into 100 sec bins |
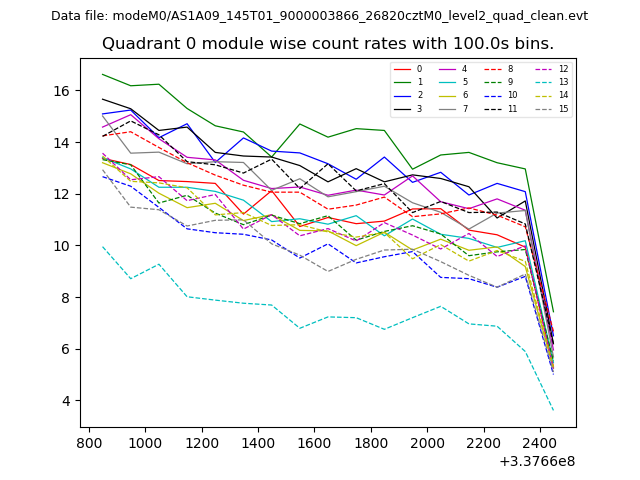 |
 |
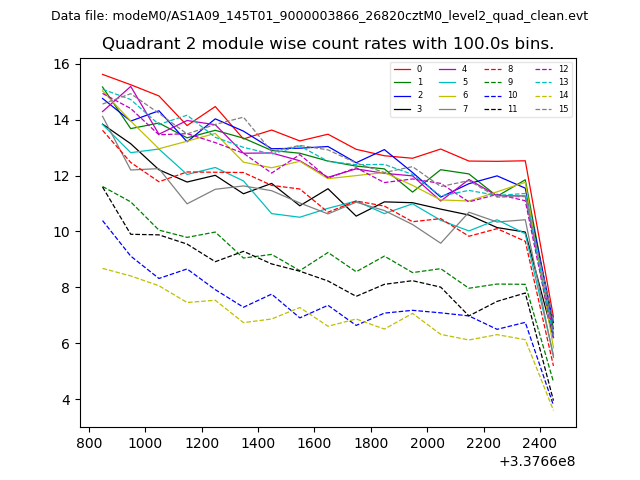
| Module-wise count rates for Quadrant B Data is divided into 100 sec bins |
 |
 |
| Module-wise count rates for Quadrant C Data is divided into 100 sec bins |
 |
 |
| Module-wise count rates for Quadrant D Data is divided into 100 sec bins |
 |
 |
| Parameter | Plot |
|---|---|
| CZT HV Monitor | 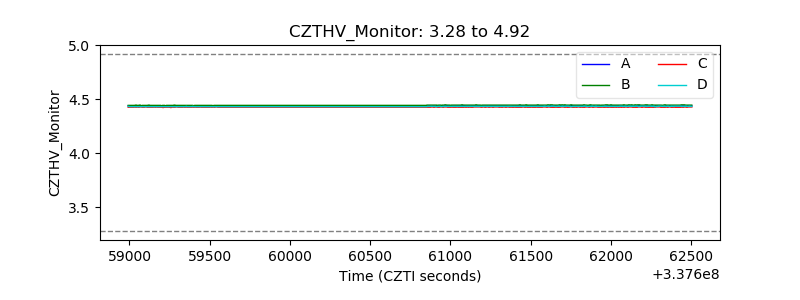 |
| D_VDD | 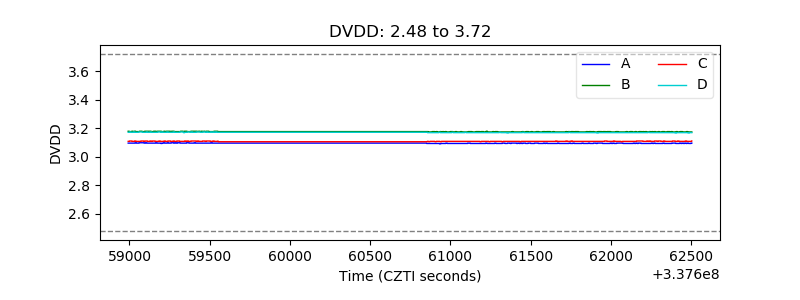 |
| Temperature 1 | 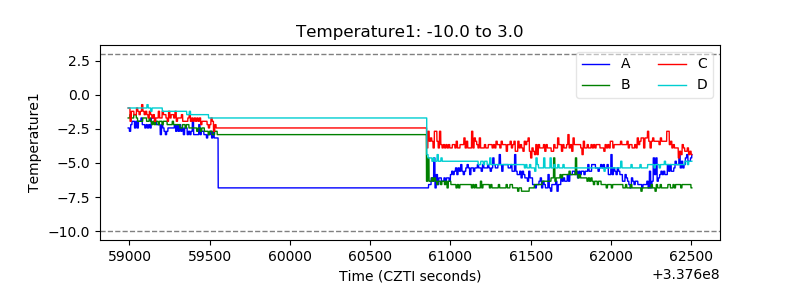 |
| Veto HV Monitor | 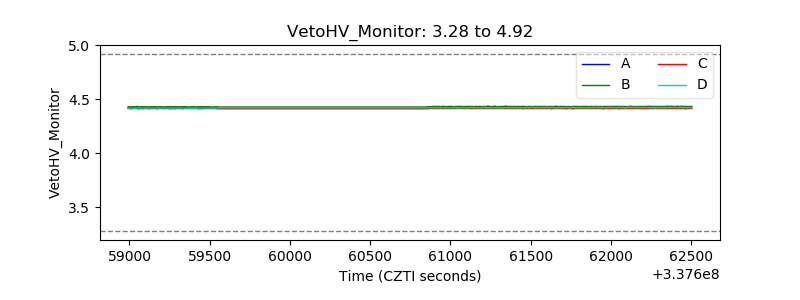 |
| Veto LLD | 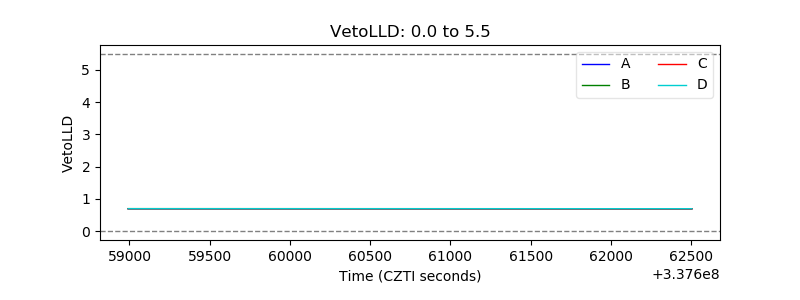 |
| Alpha Counter | 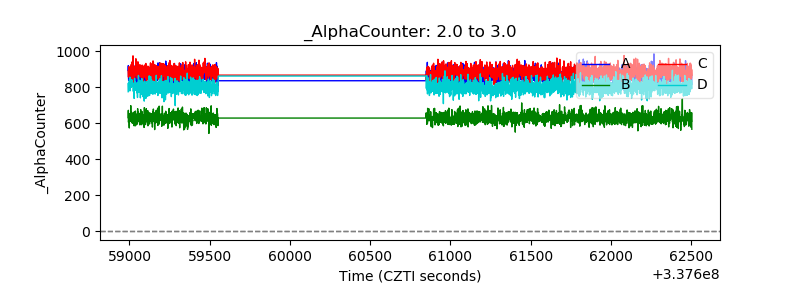 |
| _CPM_Rate | 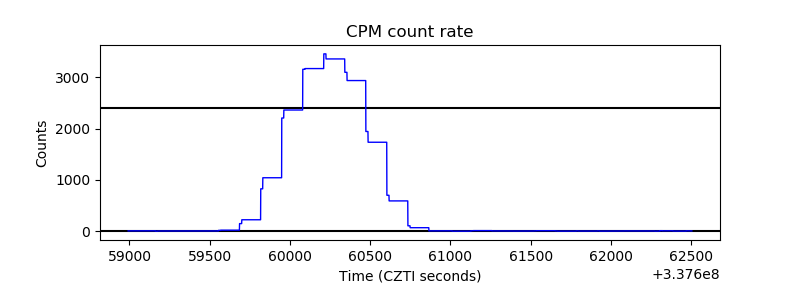 |
| CZT Counter | 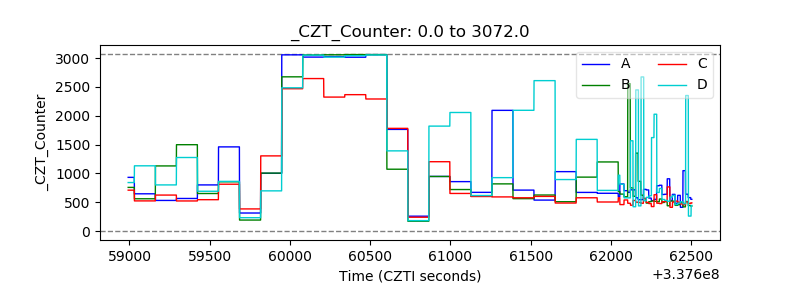 |
| +2.5 Volts monitor |  |
| +5 Volts monitor | 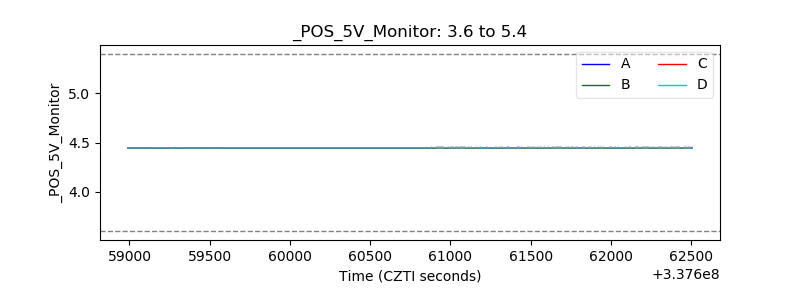 |
| _ROLL_ROT | 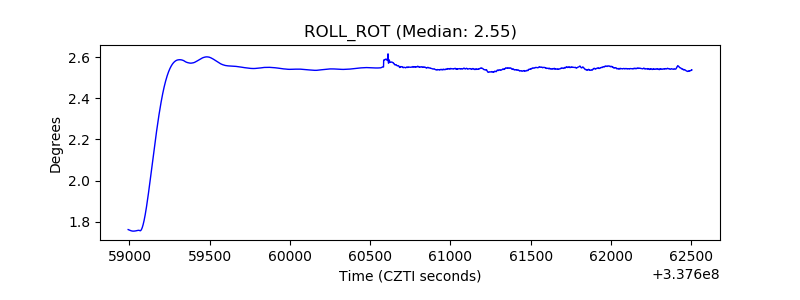 |
| _Roll_DEC | 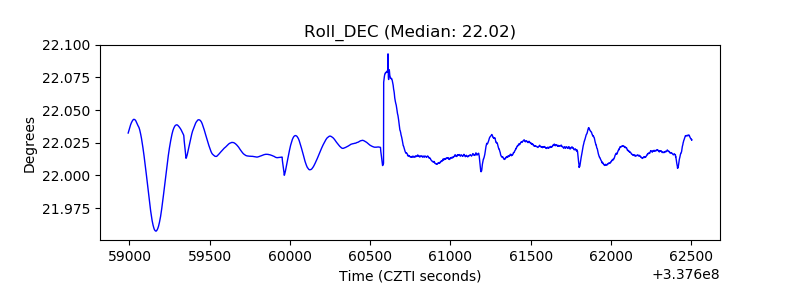 |
| _Roll_RA | 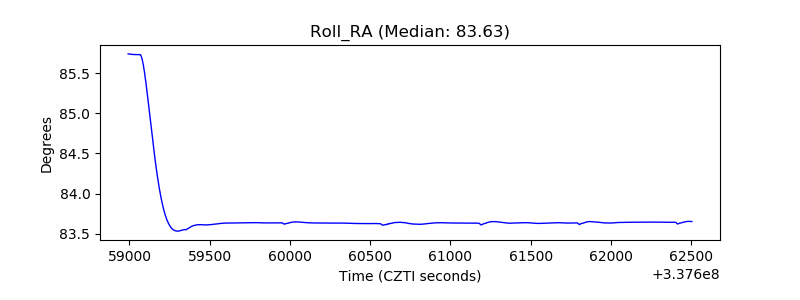 |
| Veto Counter | 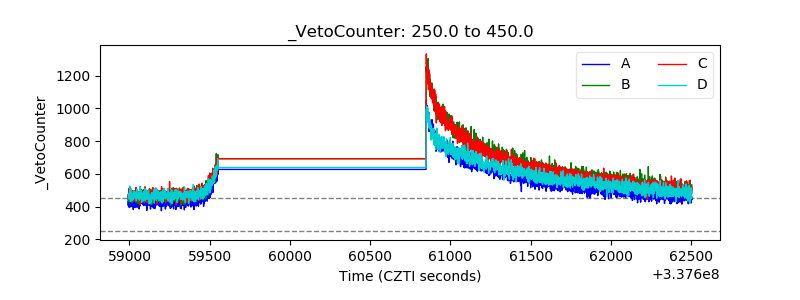 |