| Param | Original file | Final file |
|---|---|---|
| Filename | modeM0/AS1A09_145T01_9000003866_26821cztM0_level2.evt | modeM0/AS1A09_145T01_9000003866_26821cztM0_level2_quad_clean.evt |
| Size (bytes) | 788,296,320 | 113,149,440 |
| Size | 751.8 MB | 107.9 MB |
| Events in quadrant A | 5,456,258 | 789,329 |
| Events in quadrant B | 6,725,459 | 755,250 |
| Events in quadrant C | 3,519,429 | 775,028 |
| Events in quadrant D | 7,738,184 | 656,801 |
| Mode M9 | |||
|---|---|---|---|
| Quadrant | BADHDUFLAG | Total packets | Discarded packets |
| A | 0 | 14 | 0 |
| B | 0 | 14 | 0 |
| C | 0 | 14 | 0 |
| D | 0 | 14 | 0 |
| Mode M0 | |||
|---|---|---|---|
| Quadrant | BADHDUFLAG | Total packets | Discarded packets |
| A | 0 | 20850 | 0 |
| B | 0 | 24242 | 0 |
| C | 0 | 14229 | 0 |
| D | 0 | 27519 | 0 |
| Quadrant | Total seconds | Saturated seconds | Saturation percentage |
|---|---|---|---|
| A | 6442 | 184 | 2.856256% |
| B | 6443 | 1171 | 18.174763% |
| C | 6443 | 73 | 1.133013% |
| D | 6443 | 1461 | 22.675772% |
Noise dominated data is calculated using 1-second bins in cleaned event files. If a bin has >2000 counts, and if more than 50% of those come from <1% of pixels, then it is considered to be noise-dominated and hence unusable.
| Quadrant | # 1 sec bins | Bins with >0 counts | Bins with >2000 counts | High rate bins dominated by noise | Noise dominated (total time) | Noise dominated (detector-on time) | Marked lightcurve |
|---|---|---|---|---|---|---|---|
| A | 7822 | 6443 | 68 | 68 | 0.87% | 1.06% | 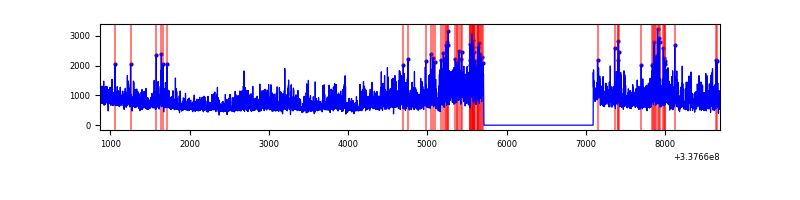 |
| B | 7823 | 6444 | 947 | 947 | 12.11% | 14.70% | 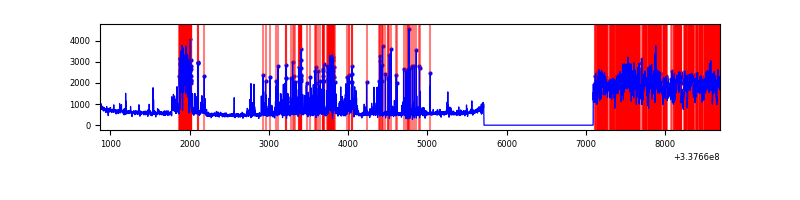 |
| C | 7823 | 6444 | 6 | 6 | 0.08% | 0.09% | 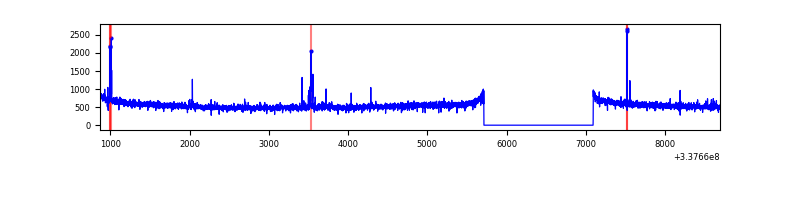 |
| D | 7823 | 6444 | 1047 | 1047 | 13.38% | 16.25% | 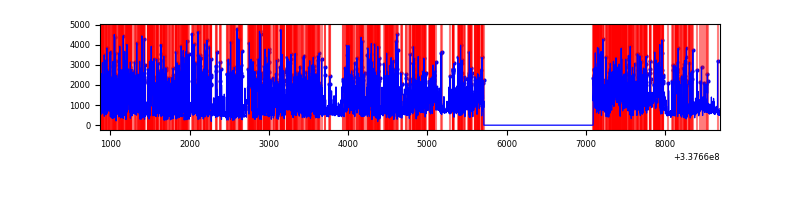 |
Top three noisy pixels from each quadrant. If the there are fewer than three noisy pixels in the level2.evt file, extra rows are filled as -1
| Pixel properties | Quadrant properties | ||||||
|---|---|---|---|---|---|---|---|
| Quadrant | DetID | PixID | Counts | Sigma | Mean | Median | Sigma |
| A | 0 | 13 | 2036601 | 11629.33 | 884 | 872 | 175.1 |
| A | 12 | 96 | 11843 | 62.67 | 884 | 872 | 175.1 |
| A | 13 | 254 | 10460 | 54.77 | 884 | 872 | 175.1 |
| B | 0 | 189 | 2274019 | 14377.1 | 852 | 837 | 158.1 |
| B | 3 | 64 | 629306 | 3974.85 | 852 | 837 | 158.1 |
| B | 10 | 246 | 401662 | 2535.08 | 852 | 837 | 158.1 |
| C | 14 | 238 | 141754 | 711.49 | 854 | 863 | 198.0 |
| C | 15 | 208 | 44513 | 220.43 | 854 | 863 | 198.0 |
| C | 13 | 61 | 5854 | 25.2 | 854 | 863 | 198.0 |
| D | 1 | 52 | 3289533 | 18251.96 | 761 | 744 | 180.2 |
| D | 7 | 80 | 1435736 | 7963.85 | 761 | 744 | 180.2 |
| D | 11 | 176 | 66638 | 365.7 | 761 | 744 | 180.2 |
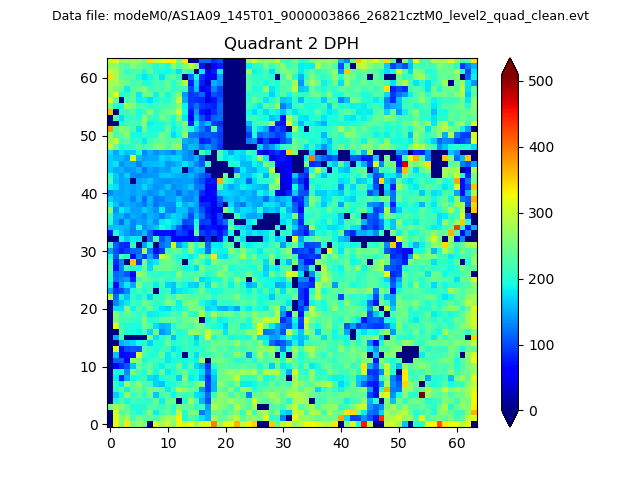
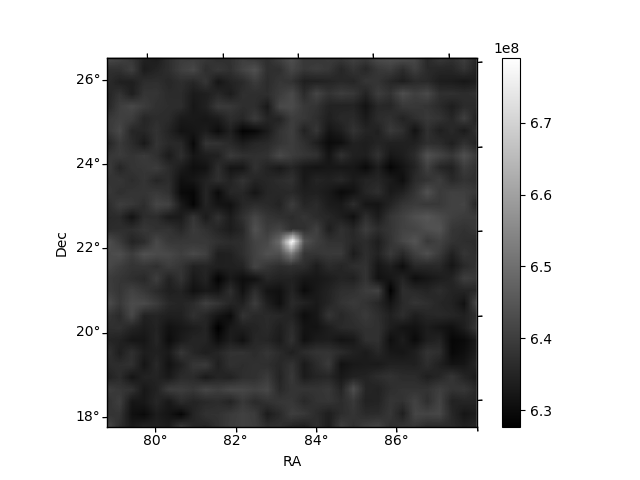
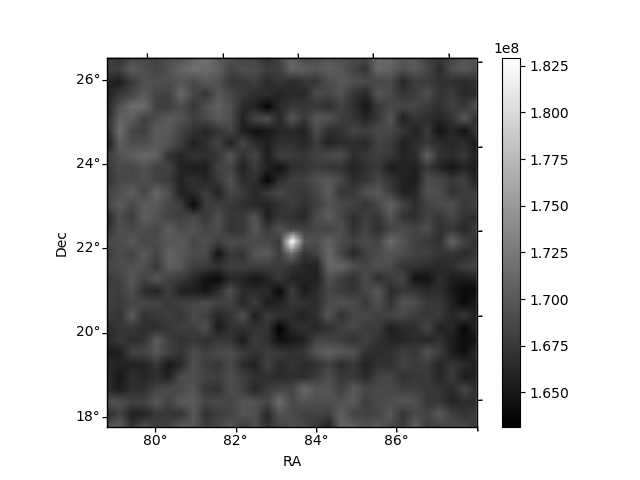
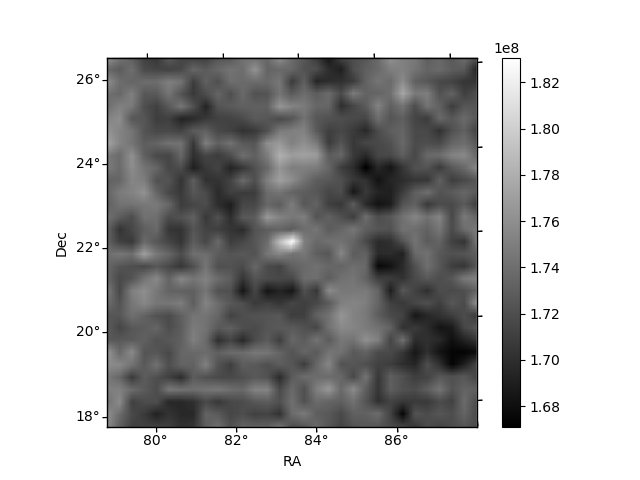
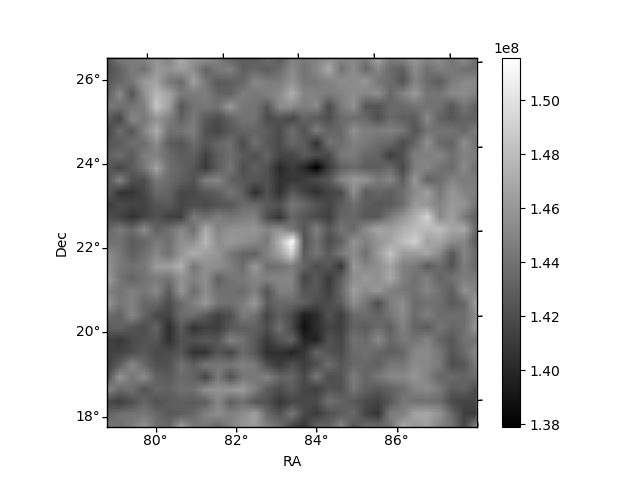
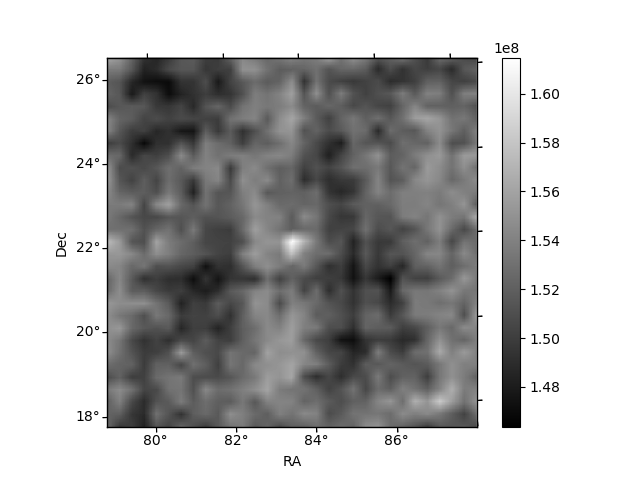
Histogram calculated using DETX and DETY for each event in the final _common_clean file
| Quadrant A | 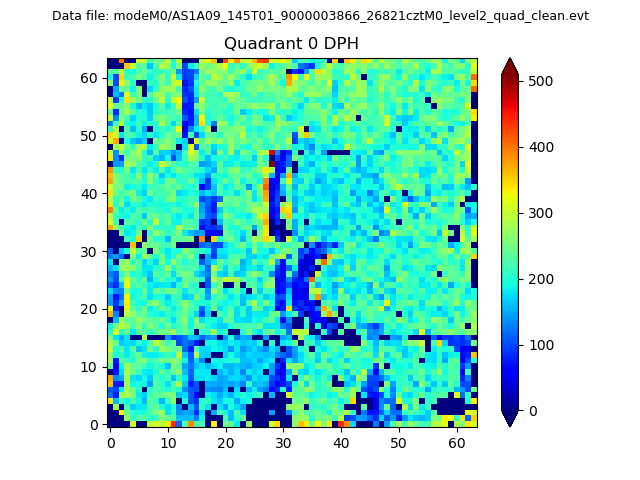 |
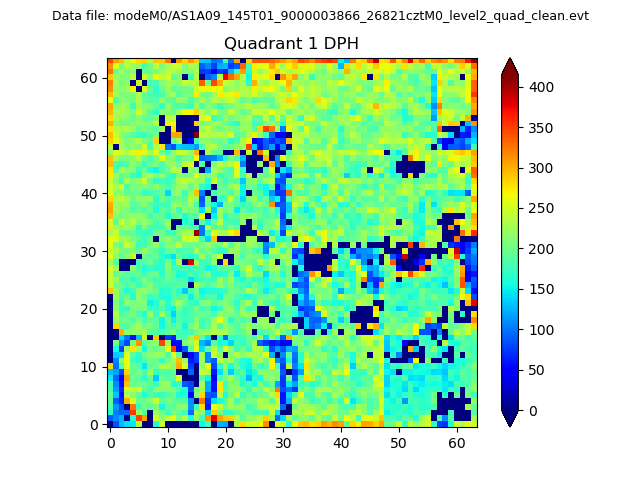 |
Quadrant B |
|---|---|---|---|
| Quadrant D | 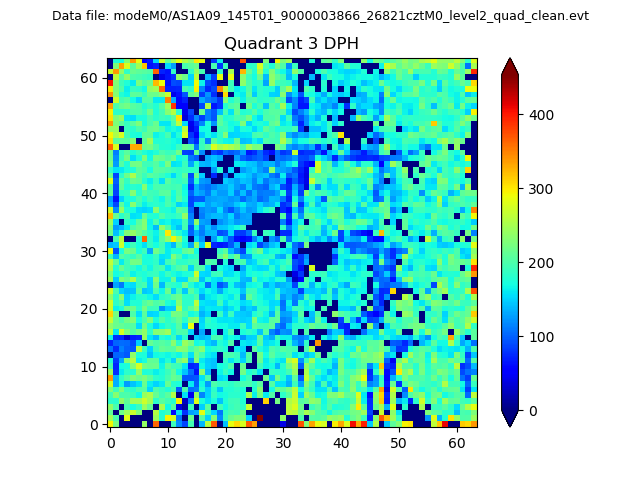 |
 |
Quadrant C |
| Plot type | Count rate plots | Images |
|---|---|---|
| Comparison with Poisson distribution Blue bars denote a histogram of data divided into 1 sec bins. Red curve is a Poisson curve with rate = median count rate of data. |
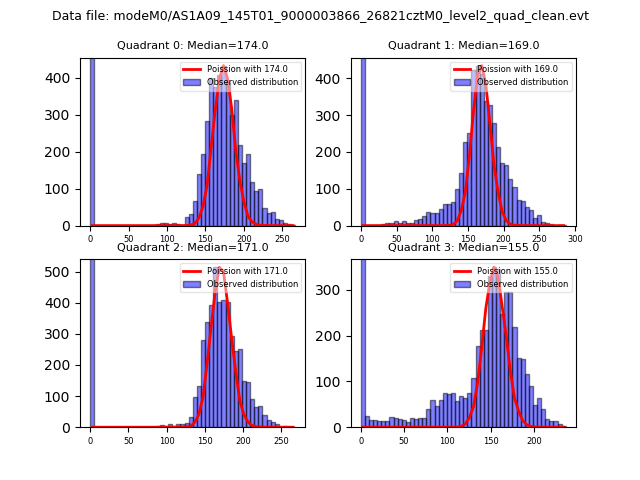 |
 |
| Quadrant-wise count rates Data is divided into 100 sec bins |
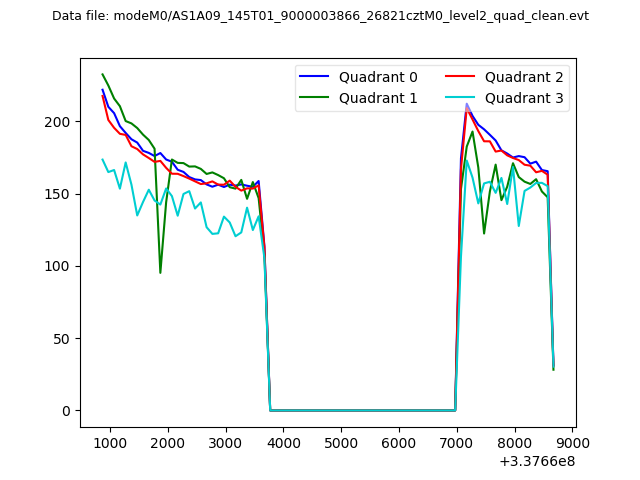 |
|
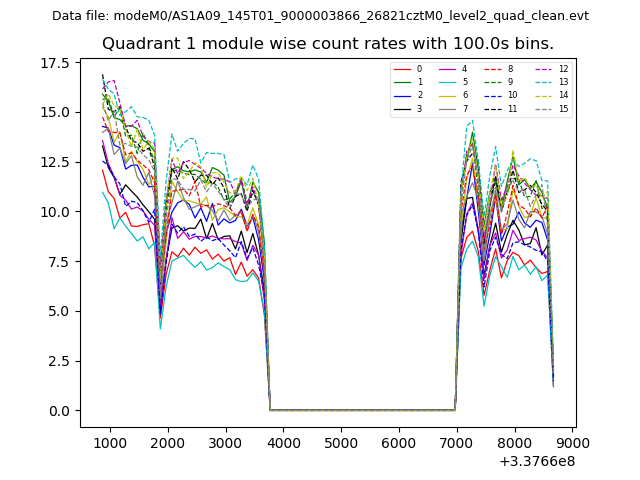
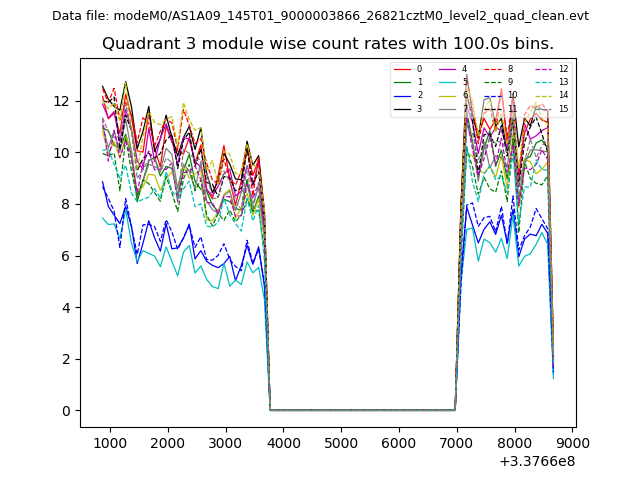
| Module-wise count rates for Quadrant A Data is divided into 100 sec bins |
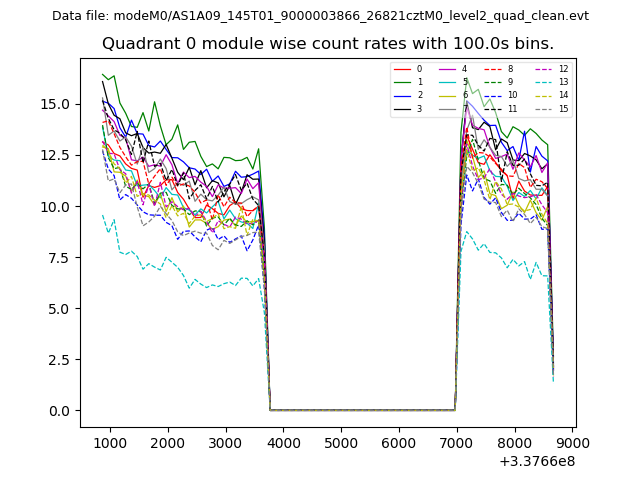 |
 |
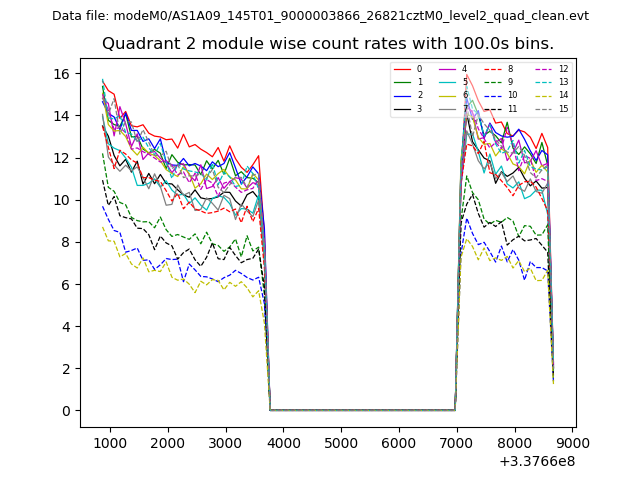
| Module-wise count rates for Quadrant B Data is divided into 100 sec bins |
 |
 |
| Module-wise count rates for Quadrant C Data is divided into 100 sec bins |
 |
 |
| Module-wise count rates for Quadrant D Data is divided into 100 sec bins |
 |
 |
| Parameter | Plot |
|---|---|
| CZT HV Monitor | 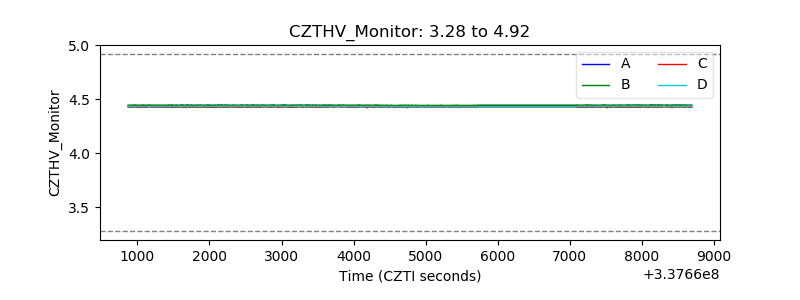 |
| D_VDD | 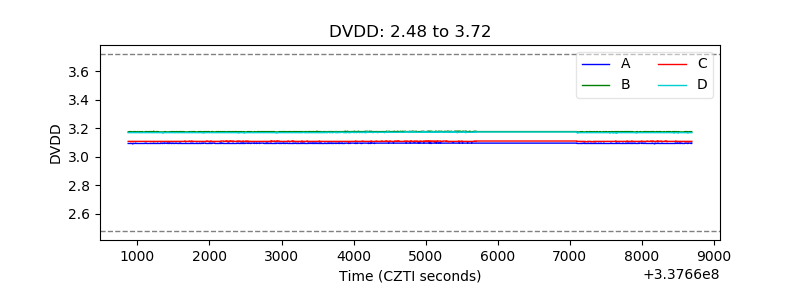 |
| Temperature 1 | 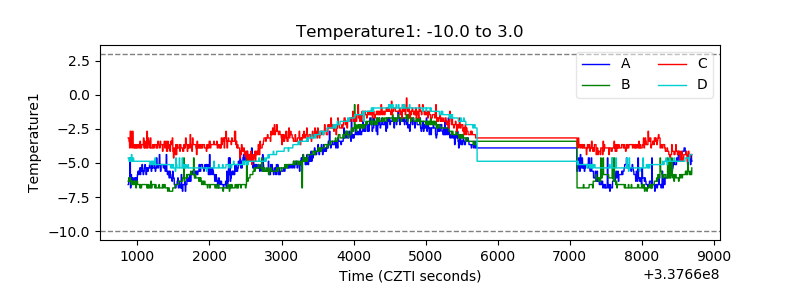 |
| Veto HV Monitor | 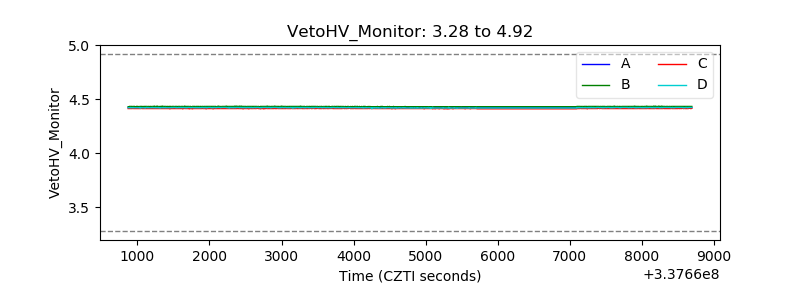 |
| Veto LLD | 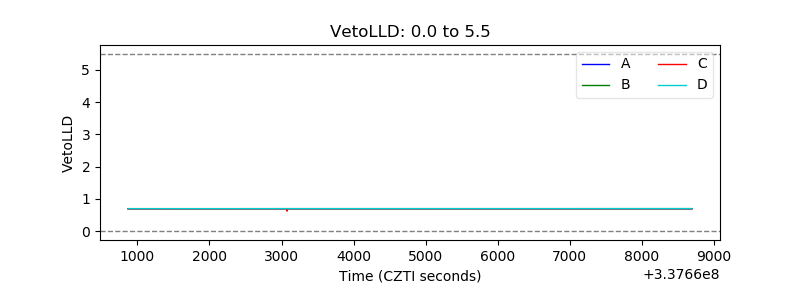 |
| Alpha Counter | 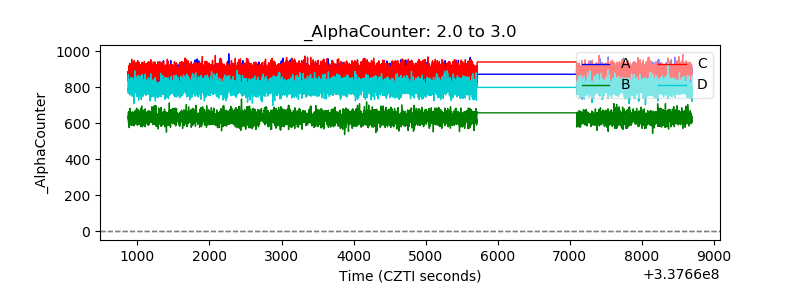 |
| _CPM_Rate | 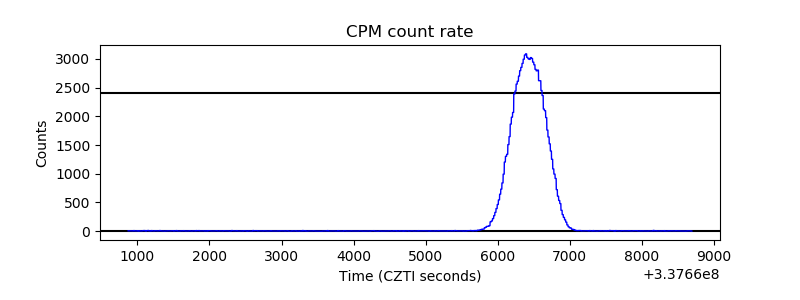 |
| CZT Counter | 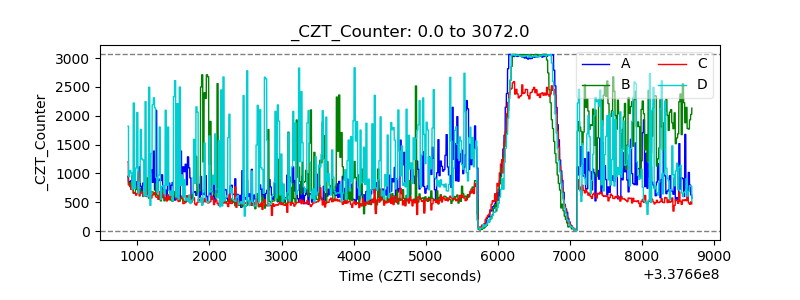 |
| +2.5 Volts monitor |  |
| +5 Volts monitor |  |
| _ROLL_ROT | 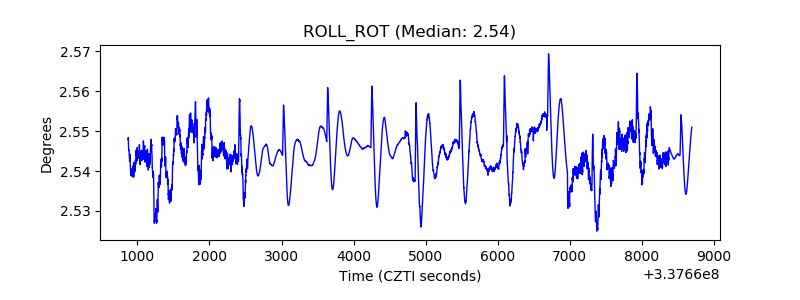 |
| _Roll_DEC | 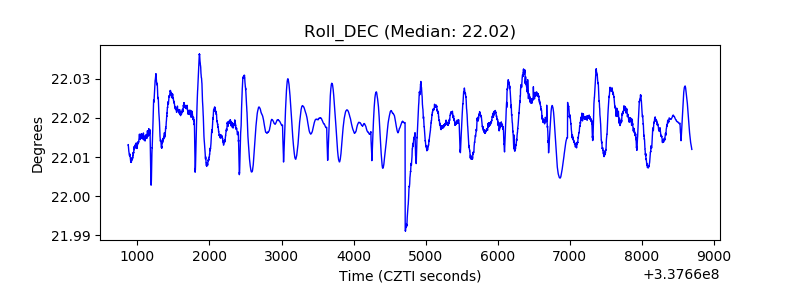 |
| _Roll_RA | 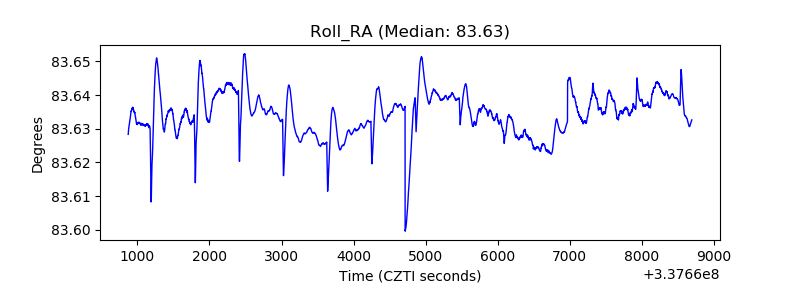 |
| Veto Counter | 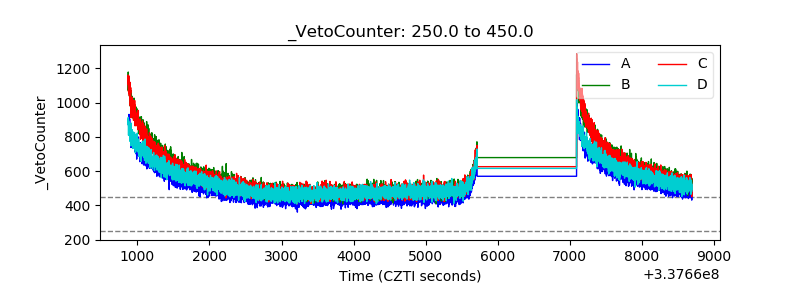 |