| Param | Original file | Final file |
|---|---|---|
| Filename | modeM0/AS1A09_145T01_9000003866_26823cztM0_level2.evt | modeM0/AS1A09_145T01_9000003866_26823cztM0_level2_quad_clean.evt |
| Size (bytes) | 556,951,680 | 84,614,400 |
| Size | 531.2 MB | 80.7 MB |
| Events in quadrant A | 4,618,114 | 558,536 |
| Events in quadrant B | 3,266,784 | 570,744 |
| Events in quadrant C | 3,014,388 | 543,932 |
| Events in quadrant D | 5,588,650 | 496,872 |
| Mode M9 | |||
|---|---|---|---|
| Quadrant | BADHDUFLAG | Total packets | Discarded packets |
| A | 0 | 12 | 0 |
| B | 0 | 12 | 0 |
| C | 0 | 12 | 0 |
| D | 0 | 12 | 0 |
| Mode M0 | |||
|---|---|---|---|
| Quadrant | BADHDUFLAG | Total packets | Discarded packets |
| A | 0 | 17642 | 0 |
| B | 0 | 13033 | 0 |
| C | 0 | 12166 | 0 |
| D | 0 | 20402 | 0 |
| Quadrant | Total seconds | Saturated seconds | Saturation percentage |
|---|---|---|---|
| A | 5600 | 208 | 3.714286% |
| B | 5601 | 119 | 2.124621% |
| C | 5601 | 87 | 1.553294% |
| D | 5601 | 944 | 16.854133% |
Noise dominated data is calculated using 1-second bins in cleaned event files. If a bin has >2000 counts, and if more than 50% of those come from <1% of pixels, then it is considered to be noise-dominated and hence unusable.
| Quadrant | # 1 sec bins | Bins with >0 counts | Bins with >2000 counts | High rate bins dominated by noise | Noise dominated (total time) | Noise dominated (detector-on time) | Marked lightcurve |
|---|---|---|---|---|---|---|---|
| A | 6890 | 5601 | 69 | 69 | 1.00% | 1.23% | 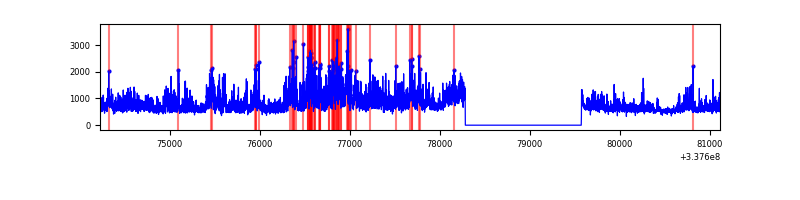 |
| B | 6890 | 5601 | 31 | 31 | 0.45% | 0.55% | 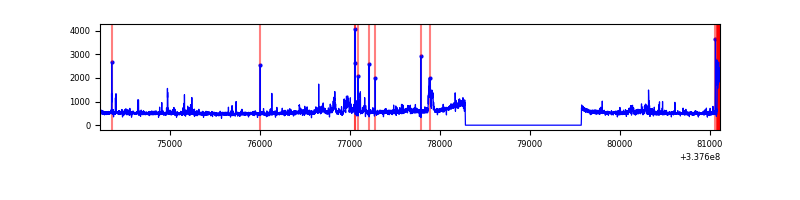 |
| C | 6891 | 5602 | 8 | 8 | 0.12% | 0.14% | 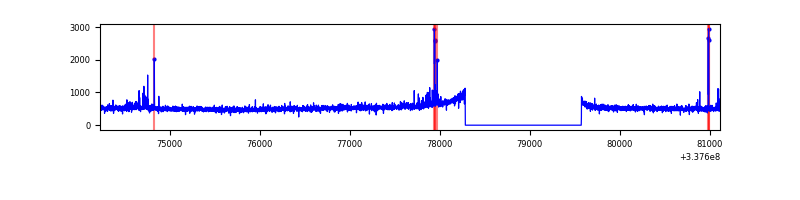 |
| D | 6891 | 5602 | 545 | 545 | 7.91% | 9.73% | 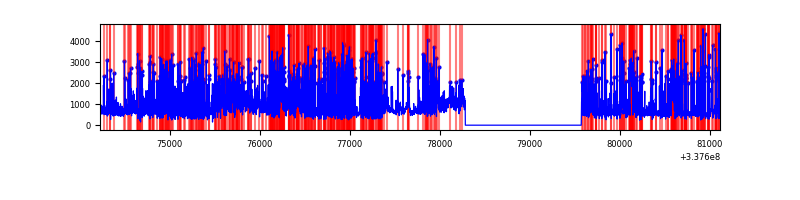 |
Top three noisy pixels from each quadrant. If the there are fewer than three noisy pixels in the level2.evt file, extra rows are filled as -1
| Pixel properties | Quadrant properties | ||||||
|---|---|---|---|---|---|---|---|
| Quadrant | DetID | PixID | Counts | Sigma | Mean | Median | Sigma |
| A | 0 | 13 | 1654068 | 10813.59 | 757 | 747 | 152.9 |
| A | 8 | 255 | 46158 | 297.01 | 757 | 747 | 152.9 |
| A | 13 | 254 | 9143 | 54.91 | 757 | 747 | 152.9 |
| B | 0 | 189 | 183690 | 1290.24 | 747 | 732 | 141.8 |
| B | 3 | 64 | 110187 | 771.89 | 747 | 732 | 141.8 |
| B | 7 | 205 | 19151 | 129.89 | 747 | 732 | 141.8 |
| C | 14 | 238 | 117907 | 695.91 | 721 | 729 | 168.4 |
| C | 15 | 208 | 66266 | 389.22 | 721 | 729 | 168.4 |
| C | 3 | 233 | 16409 | 93.12 | 721 | 729 | 168.4 |
| D | 1 | 52 | 2458289 | 15128.92 | 674 | 658 | 162.4 |
| D | 7 | 80 | 475115 | 2920.71 | 674 | 658 | 162.4 |
| D | 2 | 250 | 84061 | 513.42 | 674 | 658 | 162.4 |
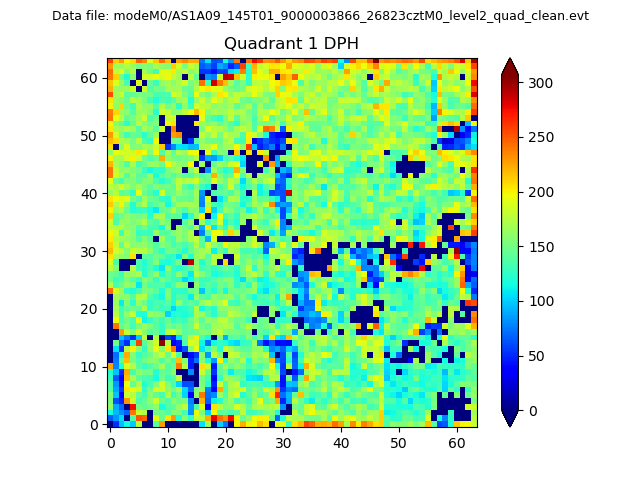
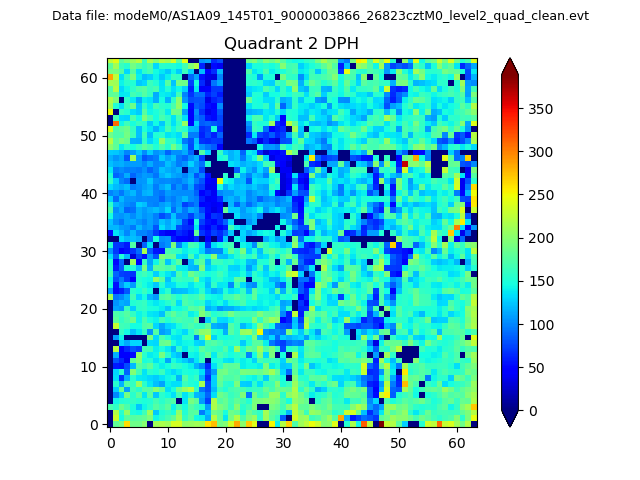
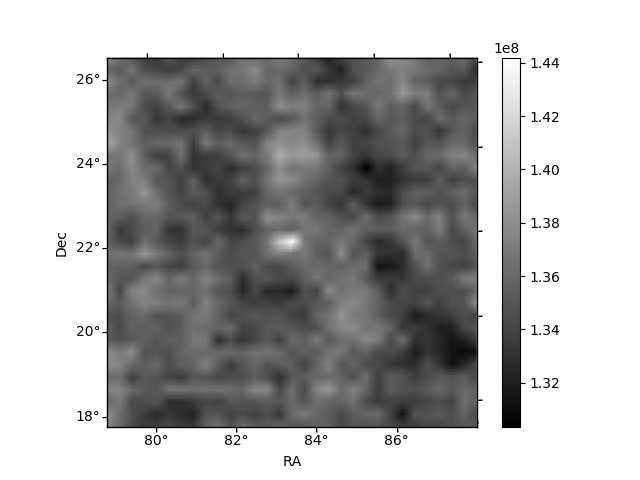
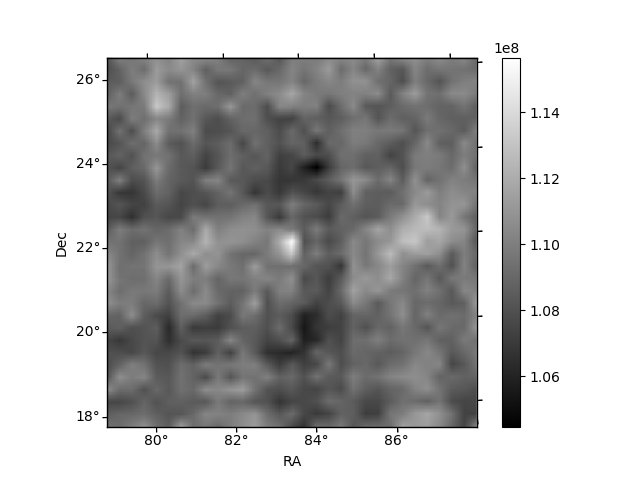
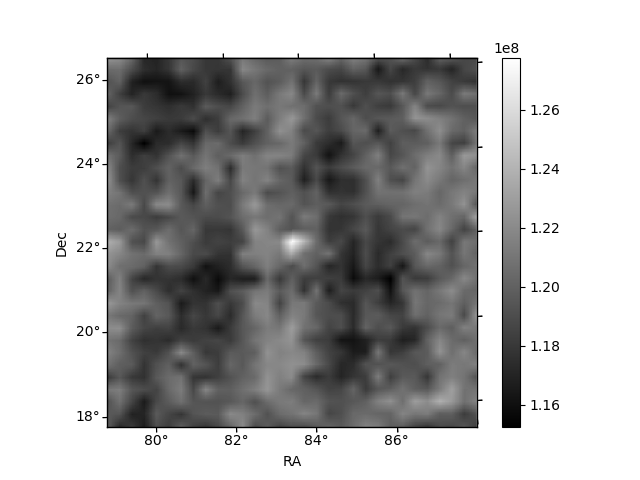
Histogram calculated using DETX and DETY for each event in the final _common_clean file
| Quadrant A |  |
 |
Quadrant B |
|---|---|---|---|
| Quadrant D |  |
 |
Quadrant C |
| Plot type | Count rate plots | Images |
|---|---|---|
| Comparison with Poisson distribution Blue bars denote a histogram of data divided into 1 sec bins. Red curve is a Poisson curve with rate = median count rate of data. |
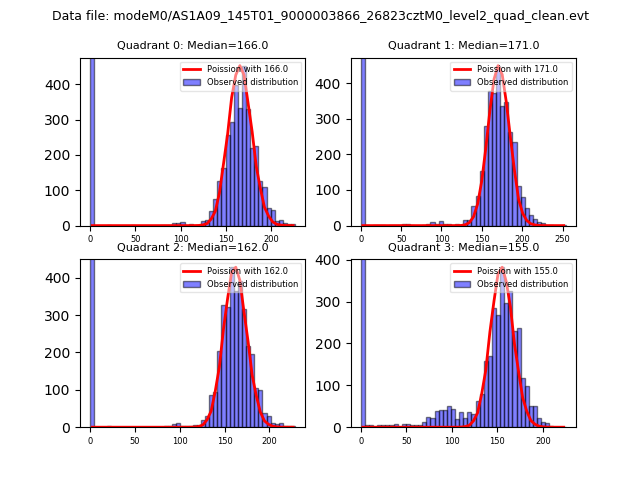 |
 |
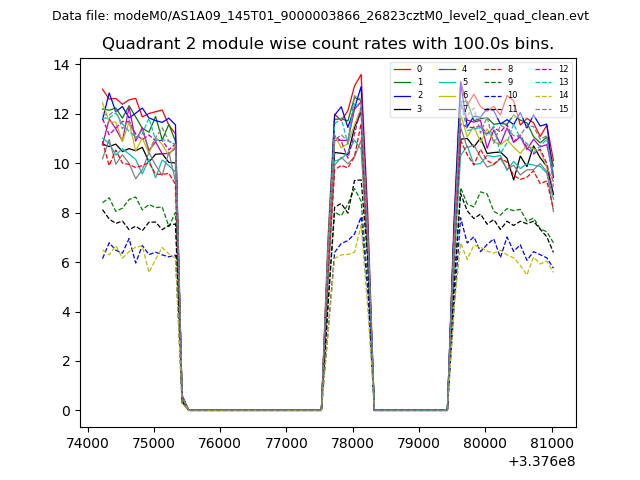
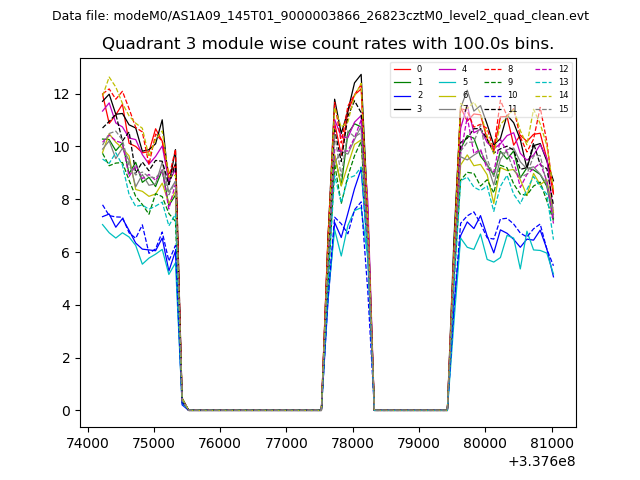
| Quadrant-wise count rates Data is divided into 100 sec bins |
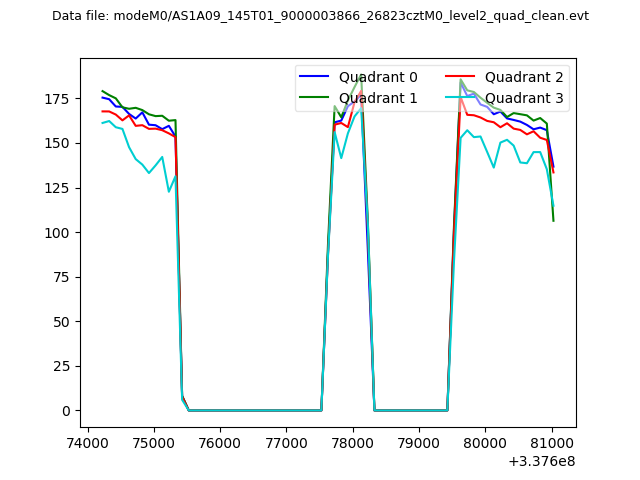 |
|
| Module-wise count rates for Quadrant A Data is divided into 100 sec bins |
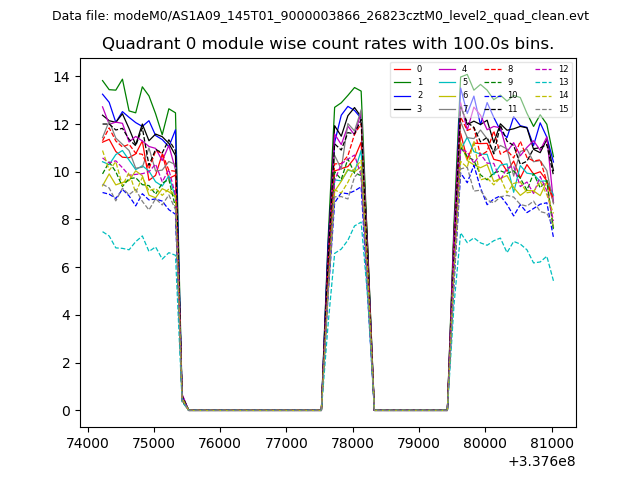 |
 |
| Module-wise count rates for Quadrant B Data is divided into 100 sec bins |
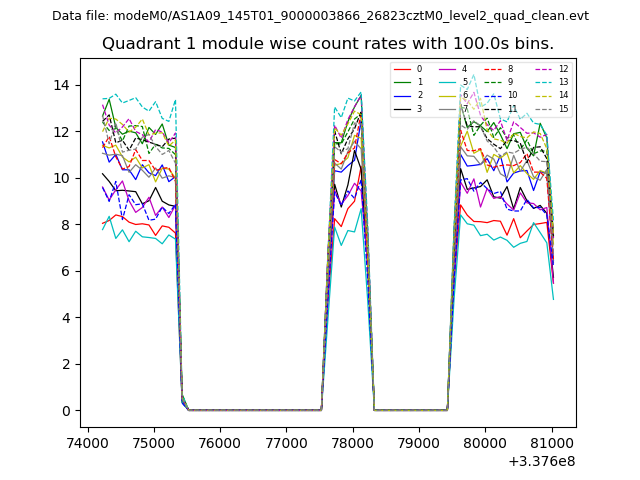 |
 |
| Module-wise count rates for Quadrant C Data is divided into 100 sec bins |
 |
 |
| Module-wise count rates for Quadrant D Data is divided into 100 sec bins |
 |
 |
| Parameter | Plot |
|---|---|
| CZT HV Monitor | 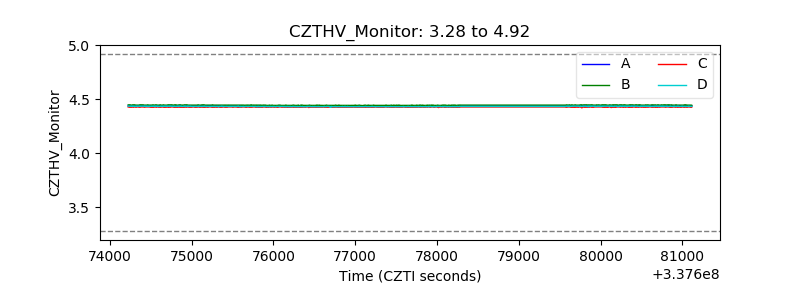 |
| D_VDD | 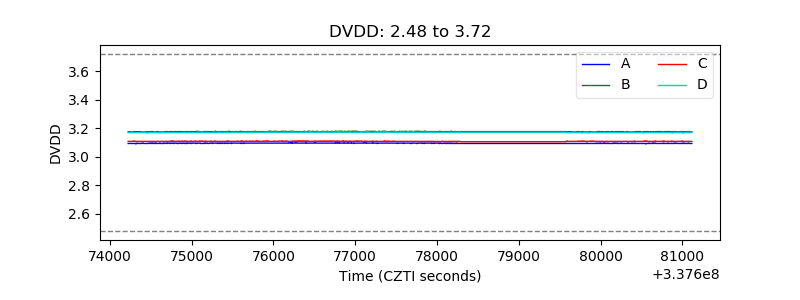 |
| Temperature 1 | 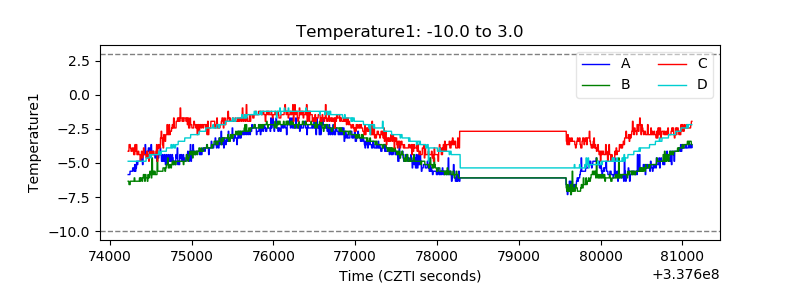 |
| Veto HV Monitor | 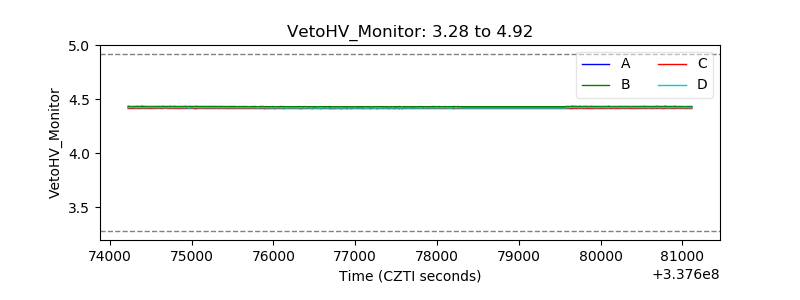 |
| Veto LLD | 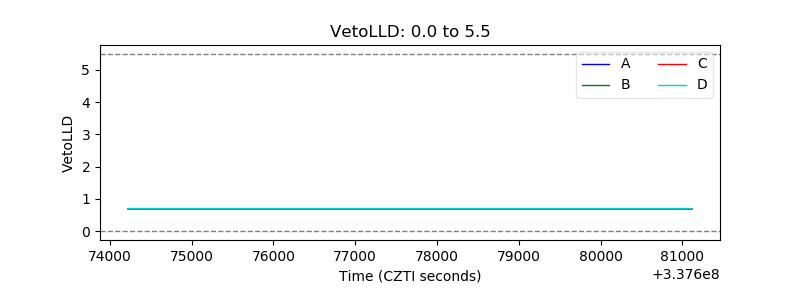 |
| Alpha Counter | 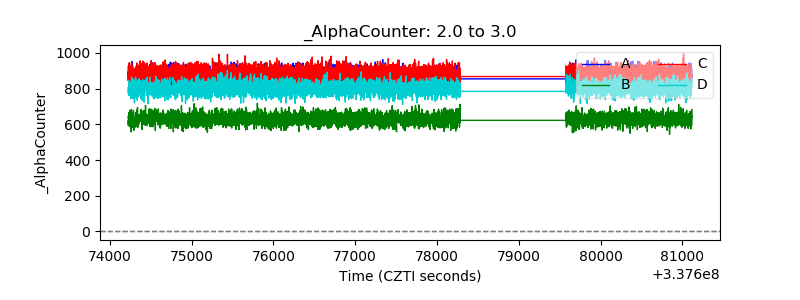 |
| _CPM_Rate |  |
| CZT Counter | 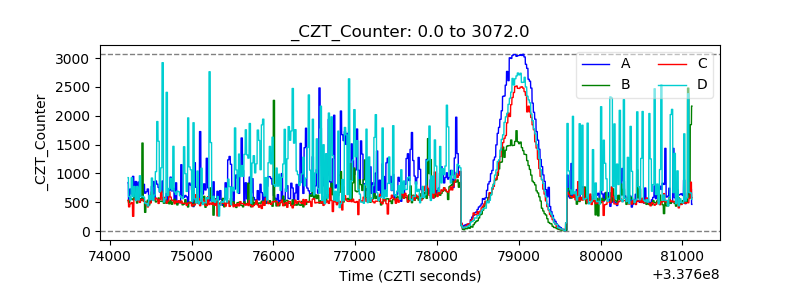 |
| +2.5 Volts monitor |  |
| +5 Volts monitor |  |
| _ROLL_ROT | 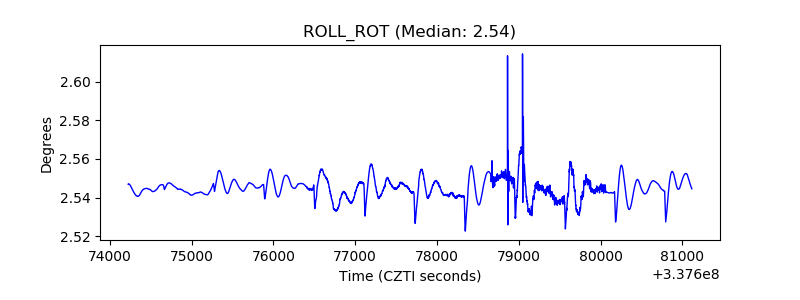 |
| _Roll_DEC | 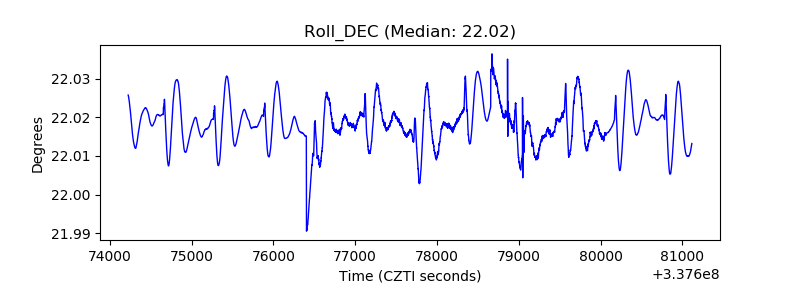 |
| _Roll_RA | 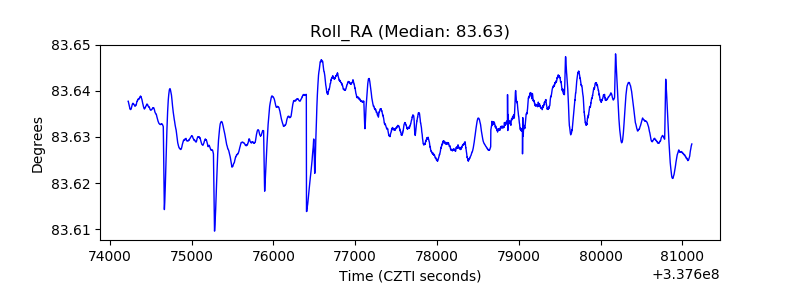 |
| Veto Counter | 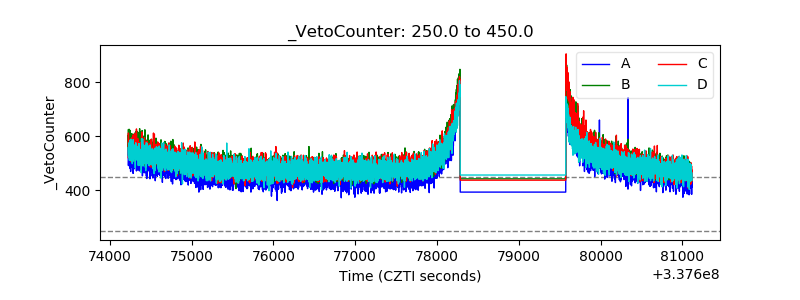 |