| Param | Original file | Final file |
|---|---|---|
| Filename | modeM0/AS1A09_145T01_9000003866_26824cztM0_level2.evt | modeM0/AS1A09_145T01_9000003866_26824cztM0_level2_quad_clean.evt |
| Size (bytes) | 520,407,360 | 82,808,640 |
| Size | 496.3 MB | 79.0 MB |
| Events in quadrant A | 3,940,906 | 541,858 |
| Events in quadrant B | 3,683,120 | 534,354 |
| Events in quadrant C | 2,960,037 | 529,598 |
| Events in quadrant D | 4,789,000 | 501,882 |
| Mode M9 | |||
|---|---|---|---|
| Quadrant | BADHDUFLAG | Total packets | Discarded packets |
| A | 0 | 10 | 0 |
| B | 0 | 10 | 0 |
| C | 0 | 10 | 0 |
| D | 0 | 10 | 0 |
| Mode M0 | |||
|---|---|---|---|
| Quadrant | BADHDUFLAG | Total packets | Discarded packets |
| A | 0 | 15648 | 0 |
| B | 0 | 14265 | 0 |
| C | 0 | 12074 | 0 |
| D | 0 | 18055 | 0 |
| Quadrant | Total seconds | Saturated seconds | Saturation percentage |
|---|---|---|---|
| A | 5719 | 103 | 1.801014% |
| B | 5720 | 385 | 6.730769% |
| C | 5720 | 90 | 1.573427% |
| D | 5720 | 441 | 7.709790% |
Noise dominated data is calculated using 1-second bins in cleaned event files. If a bin has >2000 counts, and if more than 50% of those come from <1% of pixels, then it is considered to be noise-dominated and hence unusable.
| Quadrant | # 1 sec bins | Bins with >0 counts | Bins with >2000 counts | High rate bins dominated by noise | Noise dominated (total time) | Noise dominated (detector-on time) | Marked lightcurve |
|---|---|---|---|---|---|---|---|
| A | 6719 | 5720 | 14 | 14 | 0.21% | 0.24% | 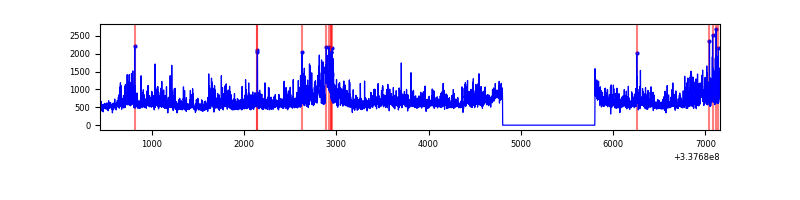 |
| B | 6720 | 5721 | 228 | 228 | 3.39% | 3.99% | 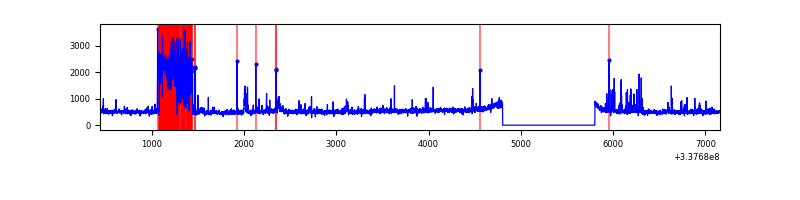 |
| C | 6720 | 5721 | 3 | 3 | 0.04% | 0.05% | 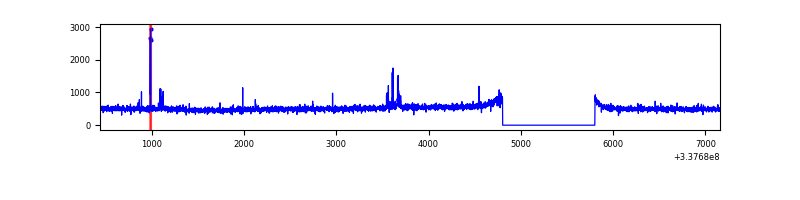 |
| D | 6720 | 5720 | 312 | 312 | 4.64% | 5.45% | 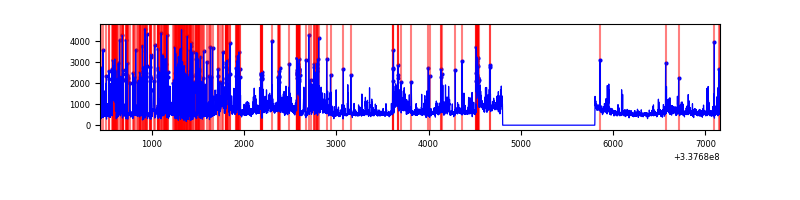 |
Top three noisy pixels from each quadrant. If the there are fewer than three noisy pixels in the level2.evt file, extra rows are filled as -1
| Pixel properties | Quadrant properties | ||||||
|---|---|---|---|---|---|---|---|
| Quadrant | DetID | PixID | Counts | Sigma | Mean | Median | Sigma |
| A | 0 | 13 | 887277 | 5797.11 | 754 | 742 | 152.9 |
| A | 8 | 255 | 114367 | 743.0 | 754 | 742 | 152.9 |
| A | 6 | 16 | 22729 | 143.77 | 754 | 742 | 152.9 |
| B | 3 | 64 | 757059 | 5490.05 | 719 | 702 | 137.8 |
| B | 0 | 189 | 54189 | 388.23 | 719 | 702 | 137.8 |
| B | 10 | 246 | 21057 | 147.74 | 719 | 702 | 137.8 |
| C | 14 | 238 | 116160 | 682.75 | 718 | 724 | 169.1 |
| C | 15 | 208 | 42556 | 247.42 | 718 | 724 | 169.1 |
| C | 13 | 61 | 4909 | 24.75 | 718 | 724 | 169.1 |
| D | 1 | 52 | 1509786 | 8788.1 | 711 | 695 | 171.7 |
| D | 7 | 80 | 470281 | 2734.61 | 711 | 695 | 171.7 |
| D | 2 | 250 | 106522 | 616.28 | 711 | 695 | 171.7 |
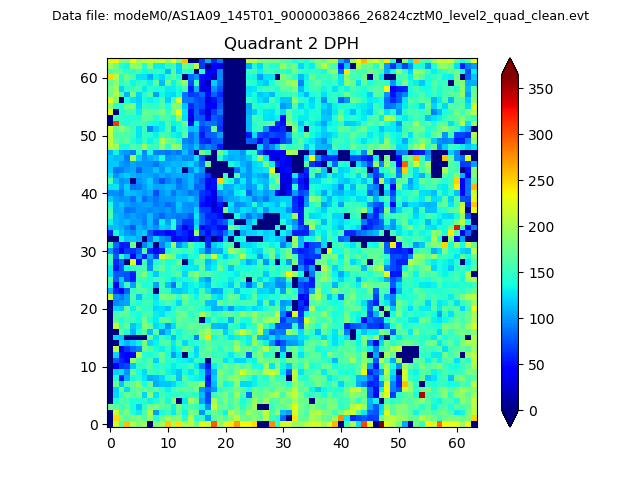
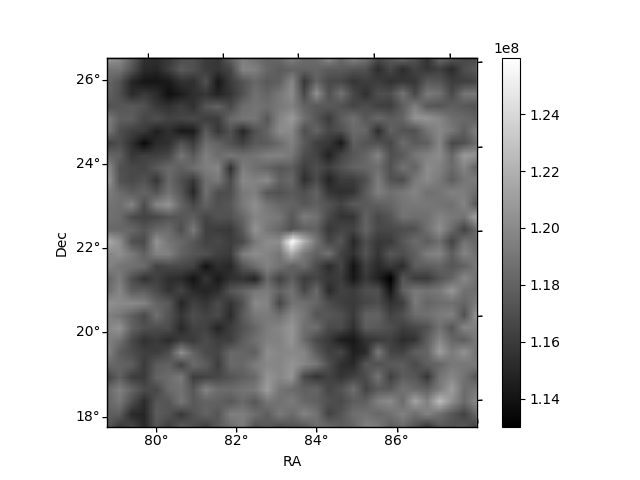
Histogram calculated using DETX and DETY for each event in the final _common_clean file
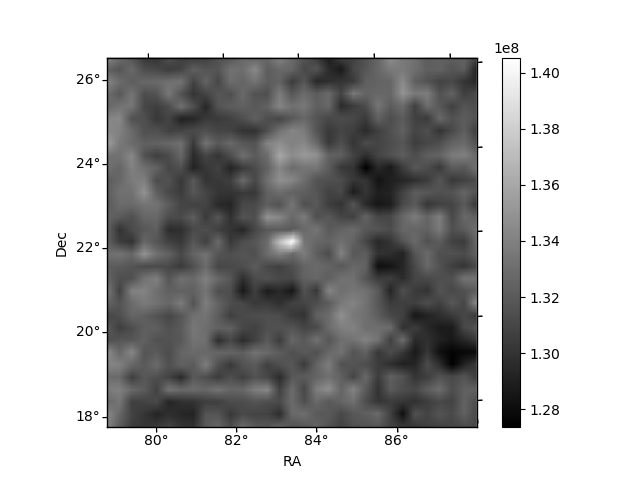
| Quadrant A | 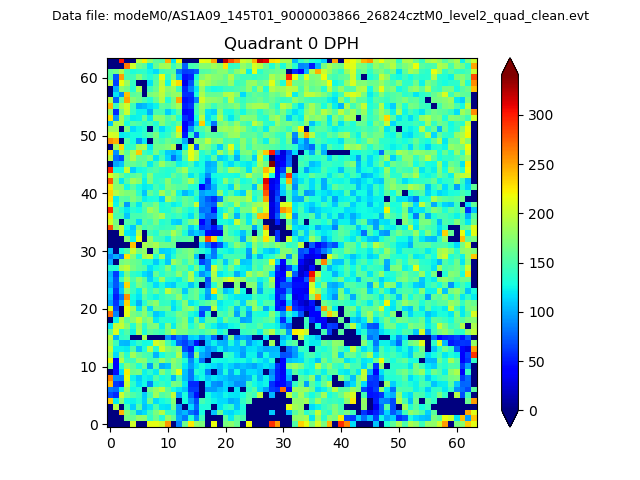 |
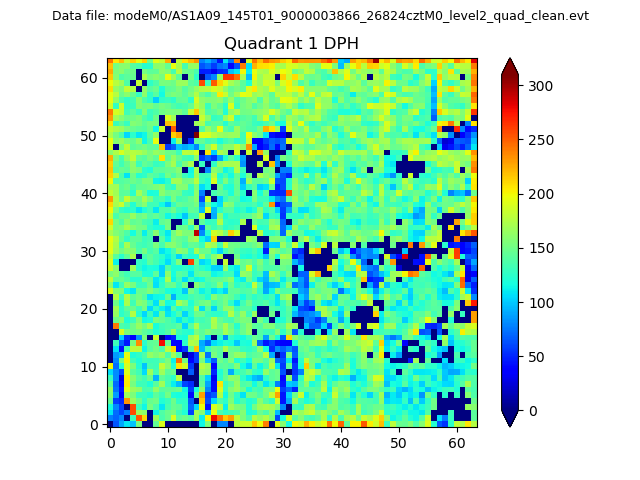 |
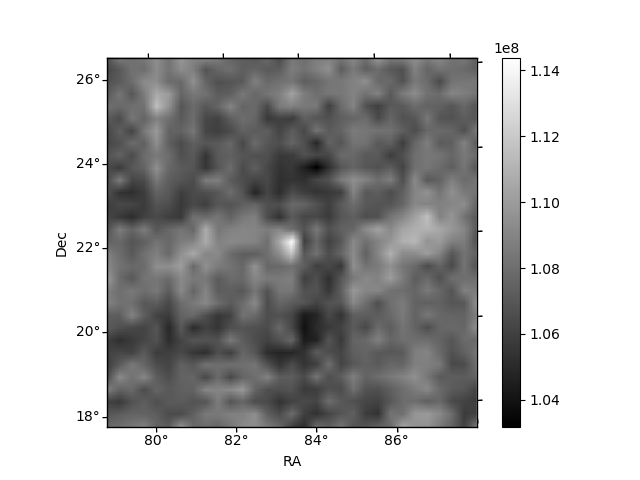
Quadrant B |
|---|---|---|---|
| Quadrant D | 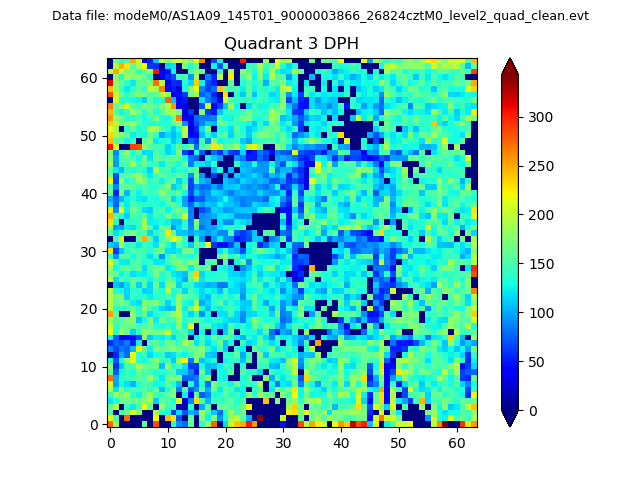 |
 |
Quadrant C |
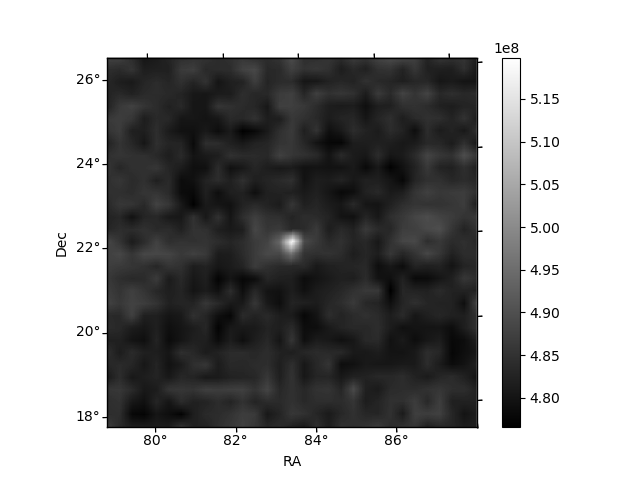
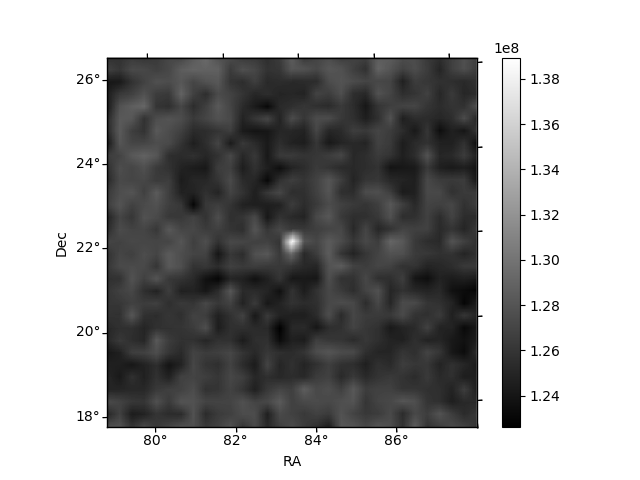
| Plot type | Count rate plots | Images |
|---|---|---|
| Comparison with Poisson distribution Blue bars denote a histogram of data divided into 1 sec bins. Red curve is a Poisson curve with rate = median count rate of data. |
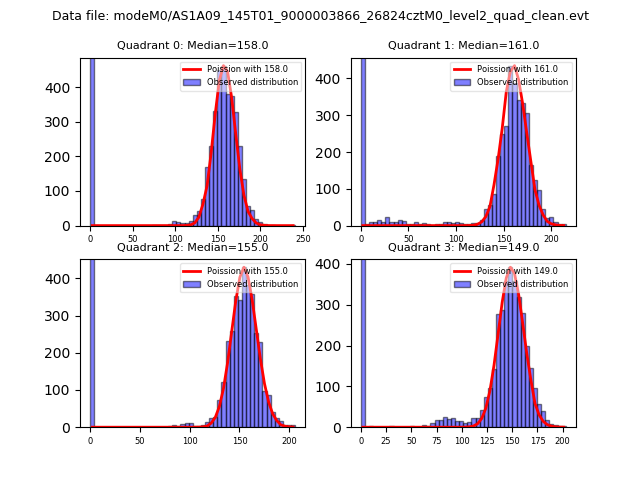 |
 |
| Quadrant-wise count rates Data is divided into 100 sec bins |
 |
|
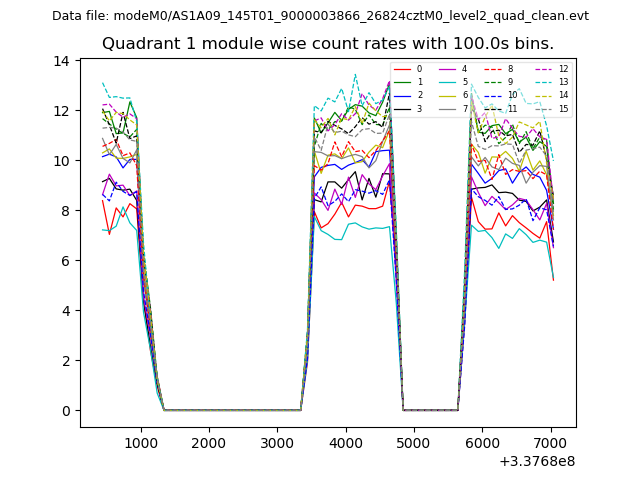
| Module-wise count rates for Quadrant A Data is divided into 100 sec bins |
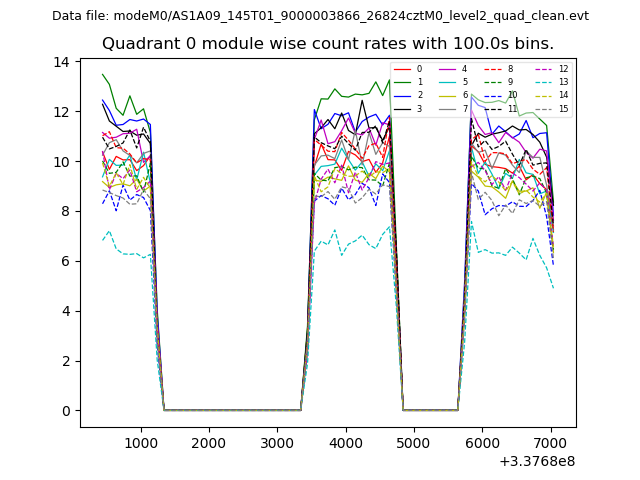 |
 |
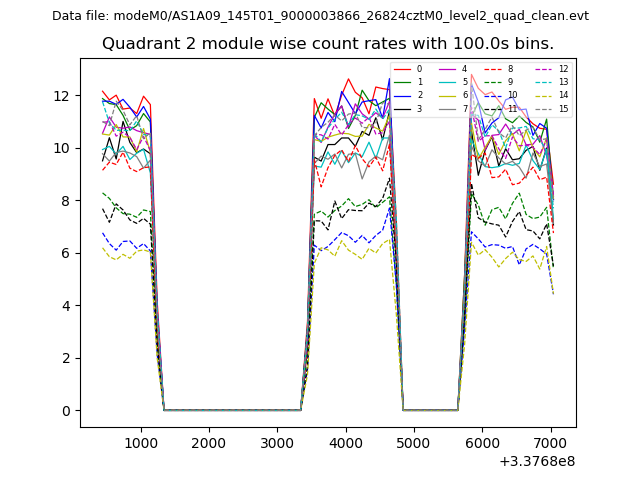
| Module-wise count rates for Quadrant B Data is divided into 100 sec bins |
 |
 |
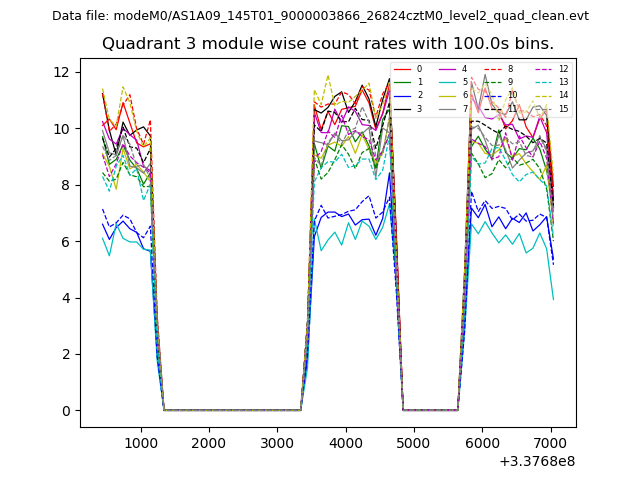
| Module-wise count rates for Quadrant C Data is divided into 100 sec bins |
 |
 |
| Module-wise count rates for Quadrant D Data is divided into 100 sec bins |
 |
 |
| Parameter | Plot |
|---|---|
| CZT HV Monitor | 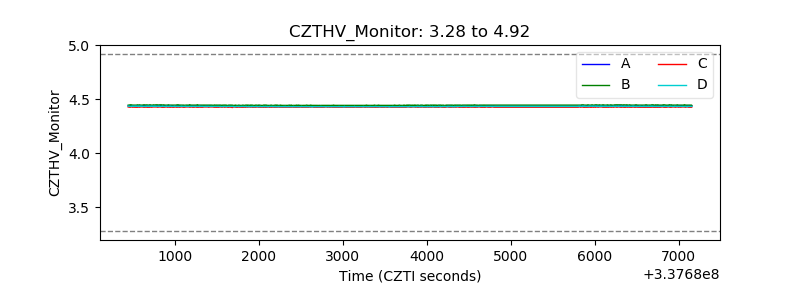 |
| D_VDD | 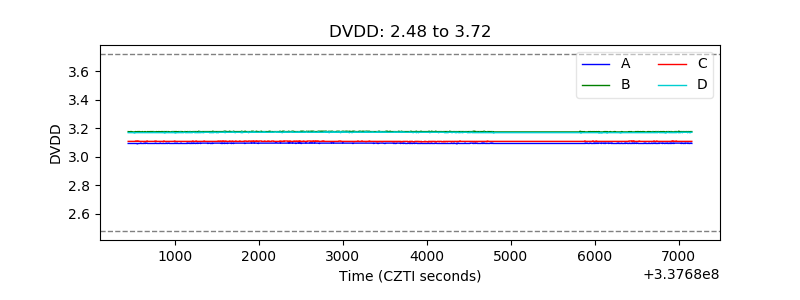 |
| Temperature 1 | 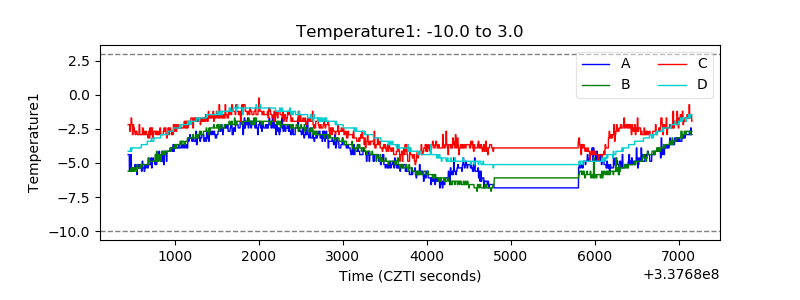 |
| Veto HV Monitor | 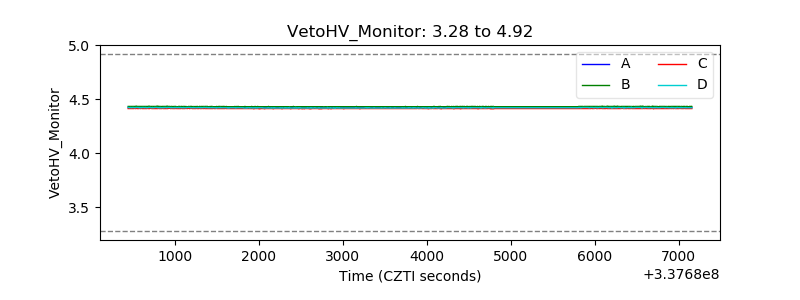 |
| Veto LLD | 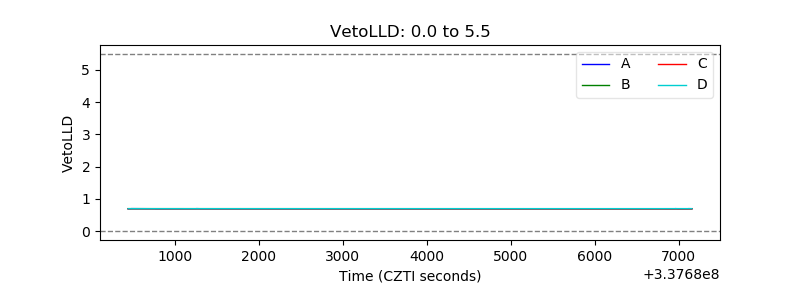 |
| Alpha Counter |  |
| _CPM_Rate | 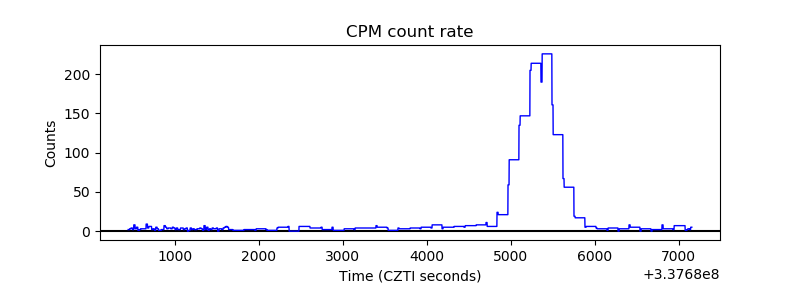 |
| CZT Counter | 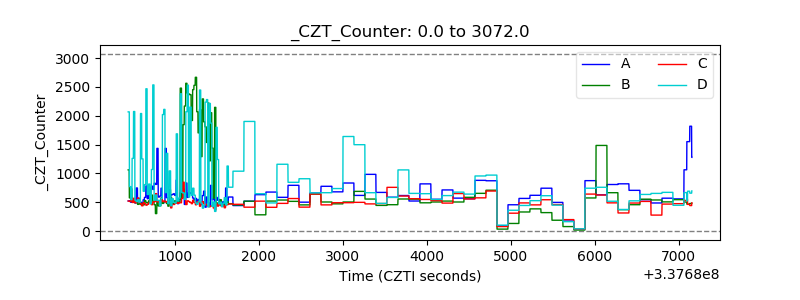 |
| +2.5 Volts monitor |  |
| +5 Volts monitor |  |
| _ROLL_ROT | 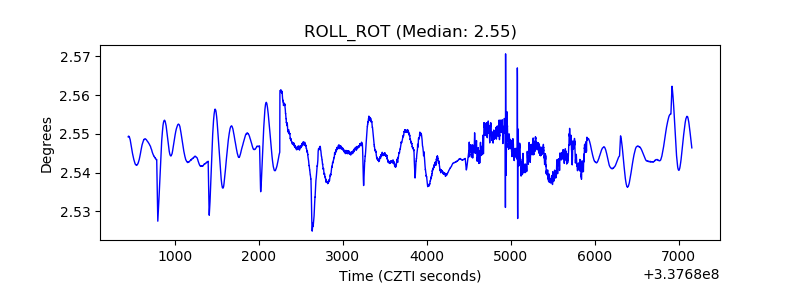 |
| _Roll_DEC |  |
| _Roll_RA | 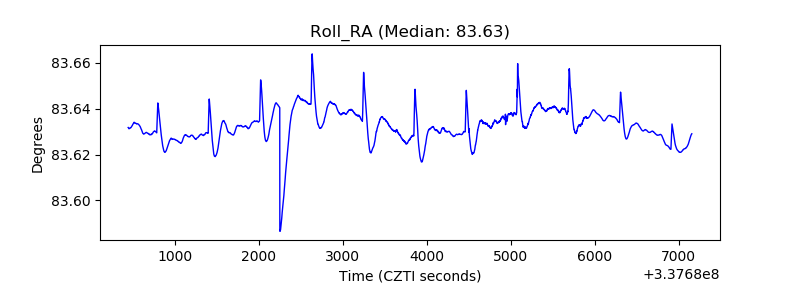 |
| Veto Counter | 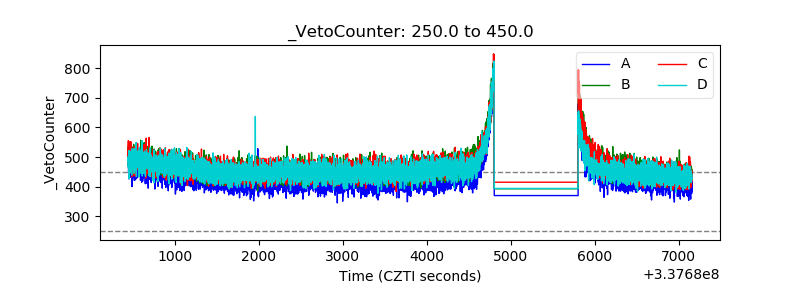 |