| Param | Original file | Final file |
|---|---|---|
| Filename | modeM0/AS1A09_145T01_9000003866_26825cztM0_level2.evt | modeM0/AS1A09_145T01_9000003866_26825cztM0_level2_quad_clean.evt |
| Size (bytes) | 685,105,920 | 87,782,400 |
| Size | 653.4 MB | 83.7 MB |
| Events in quadrant A | 4,333,081 | 572,261 |
| Events in quadrant B | 4,426,408 | 575,521 |
| Events in quadrant C | 3,232,045 | 558,120 |
| Events in quadrant D | 8,319,624 | 500,748 |
| Mode M9 | |||
|---|---|---|---|
| Quadrant | BADHDUFLAG | Total packets | Discarded packets |
| A | 0 | 5 | 0 |
| B | 0 | 5 | 0 |
| C | 0 | 5 | 0 |
| D | 0 | 5 | 0 |
| Mode M0 | |||
|---|---|---|---|
| Quadrant | BADHDUFLAG | Total packets | Discarded packets |
| A | 0 | 16924 | 0 |
| B | 0 | 17056 | 0 |
| C | 0 | 13342 | 0 |
| D | 0 | 29170 | 0 |
| Quadrant | Total seconds | Saturated seconds | Saturation percentage |
|---|---|---|---|
| A | 6467 | 148 | 2.288542% |
| B | 6467 | 432 | 6.680068% |
| C | 6468 | 101 | 1.561534% |
| D | 6468 | 1588 | 24.551639% |
Noise dominated data is calculated using 1-second bins in cleaned event files. If a bin has >2000 counts, and if more than 50% of those come from <1% of pixels, then it is considered to be noise-dominated and hence unusable.
| Quadrant | # 1 sec bins | Bins with >0 counts | Bins with >2000 counts | High rate bins dominated by noise | Noise dominated (total time) | Noise dominated (detector-on time) | Marked lightcurve |
|---|---|---|---|---|---|---|---|
| A | 7047 | 6467 | 35 | 35 | 0.50% | 0.54% | 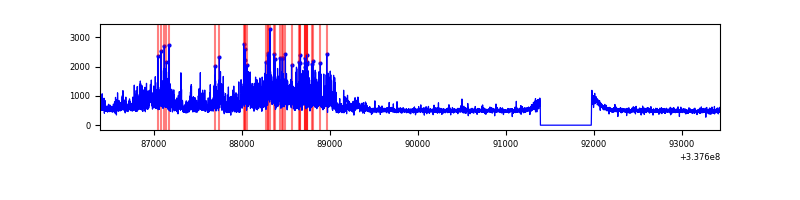 |
| B | 7047 | 6468 | 268 | 268 | 3.80% | 4.14% | 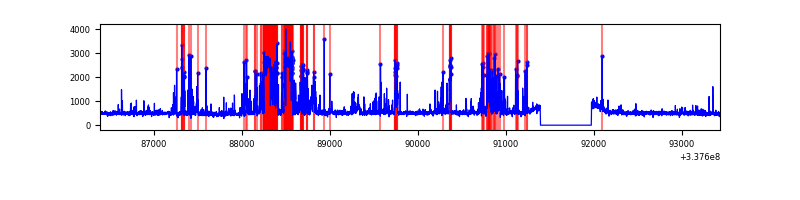 |
| C | 7048 | 6469 | 1 | 1 | 0.01% | 0.02% | 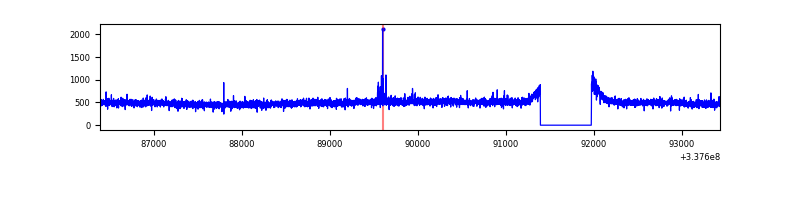 |
| D | 7048 | 6469 | 1346 | 1346 | 19.10% | 20.81% | 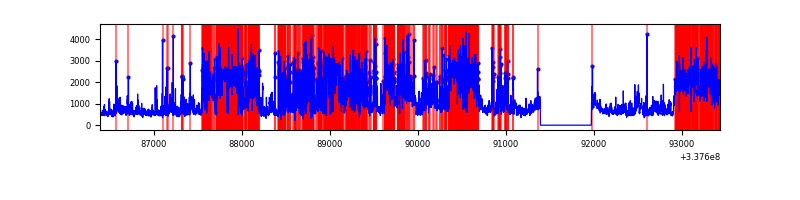 |
Top three noisy pixels from each quadrant. If the there are fewer than three noisy pixels in the level2.evt file, extra rows are filled as -1
| Pixel properties | Quadrant properties | ||||||
|---|---|---|---|---|---|---|---|
| Quadrant | DetID | PixID | Counts | Sigma | Mean | Median | Sigma |
| A | 0 | 13 | 1106480 | 6585.12 | 827 | 812 | 167.9 |
| A | 6 | 16 | 27996 | 161.9 | 827 | 812 | 167.9 |
| A | 12 | 96 | 11757 | 65.19 | 827 | 812 | 167.9 |
| B | 0 | 189 | 851077 | 5454.57 | 803 | 783 | 155.9 |
| B | 3 | 64 | 338157 | 2164.23 | 803 | 783 | 155.9 |
| B | 10 | 246 | 38570 | 242.4 | 803 | 783 | 155.9 |
| C | 14 | 238 | 126562 | 672.72 | 792 | 799 | 186.9 |
| C | 15 | 208 | 10602 | 52.44 | 792 | 799 | 186.9 |
| C | 3 | 233 | 9965 | 49.03 | 792 | 799 | 186.9 |
| D | 1 | 52 | 3547551 | 20303.22 | 724 | 707 | 174.7 |
| D | 7 | 80 | 1724384 | 9866.86 | 724 | 707 | 174.7 |
| D | 2 | 250 | 241775 | 1379.95 | 724 | 707 | 174.7 |
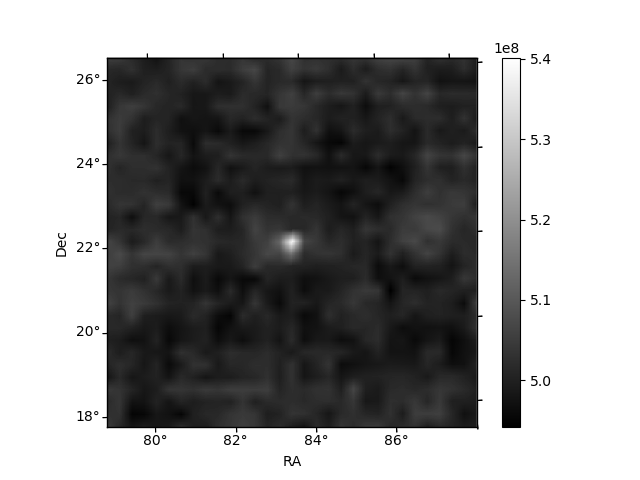
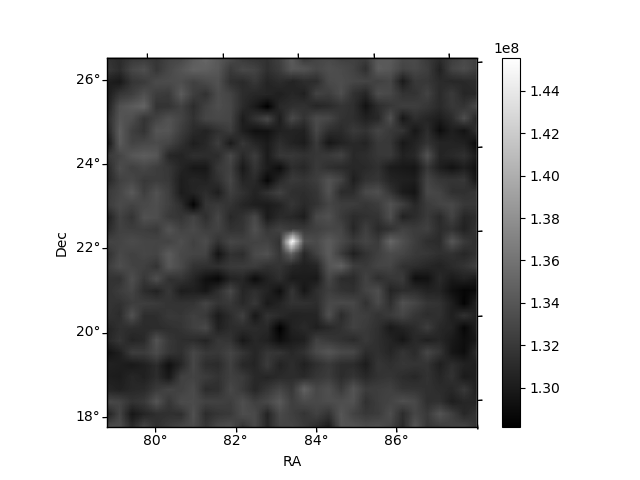
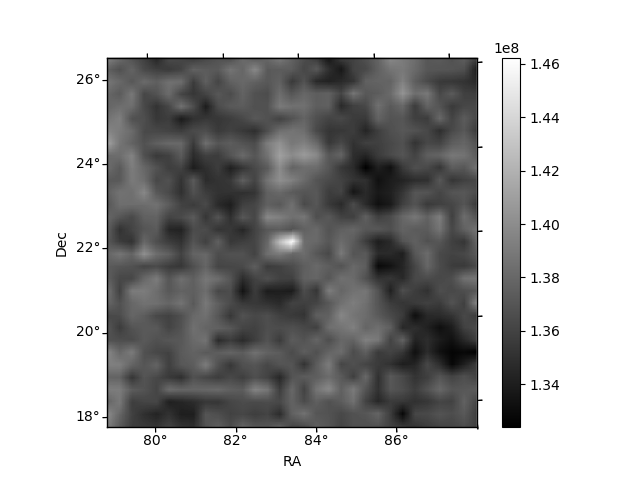
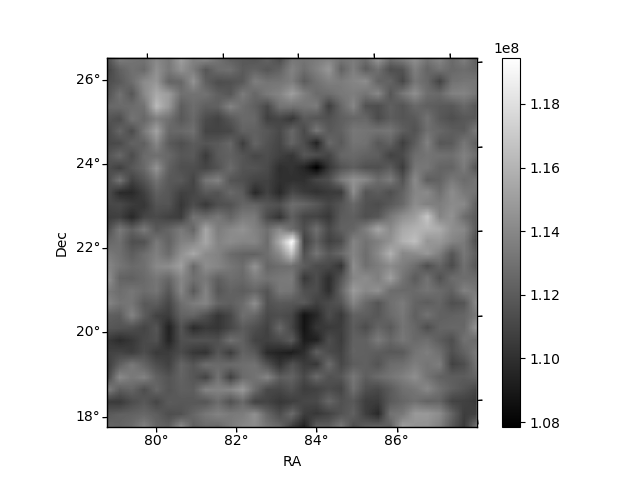
Histogram calculated using DETX and DETY for each event in the final _common_clean file
| Quadrant A | 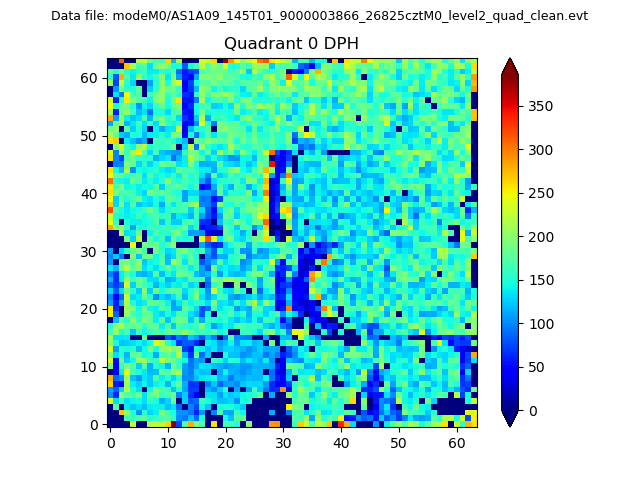 |
 |
Quadrant B |
|---|---|---|---|
| Quadrant D | 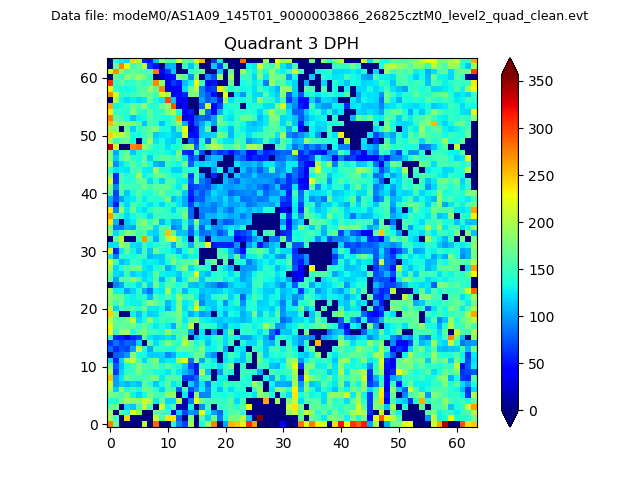 |
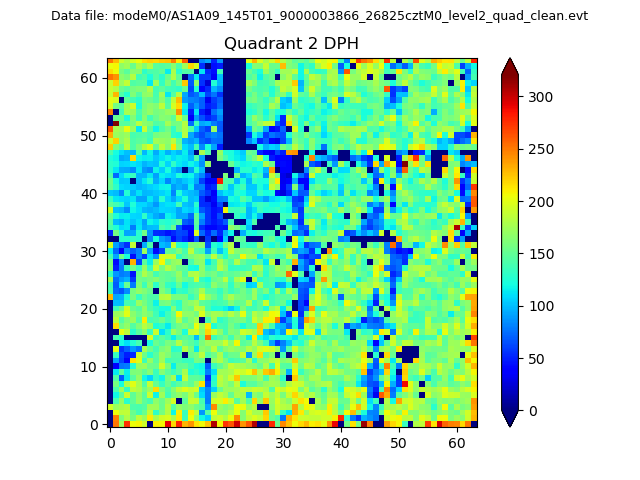 |
Quadrant C |
| Plot type | Count rate plots | Images |
|---|---|---|
| Comparison with Poisson distribution Blue bars denote a histogram of data divided into 1 sec bins. Red curve is a Poisson curve with rate = median count rate of data. |
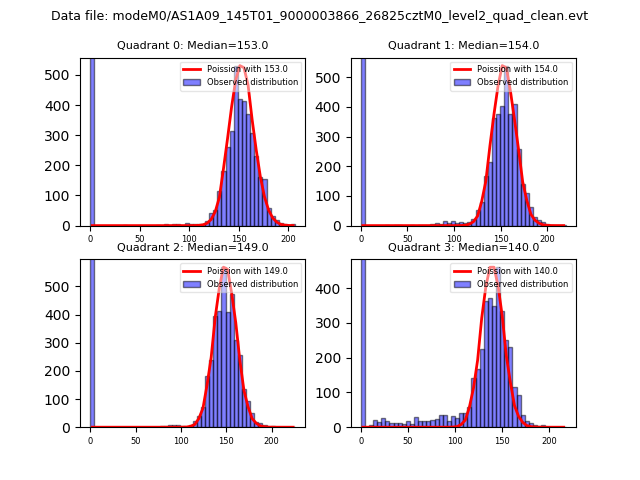 |
 |
| Quadrant-wise count rates Data is divided into 100 sec bins |
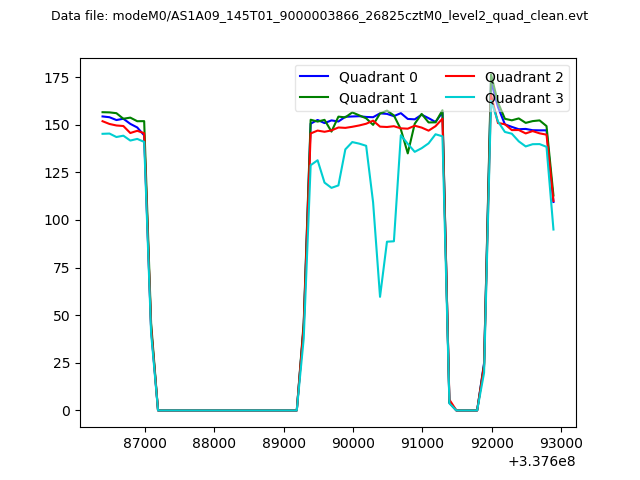 |
|
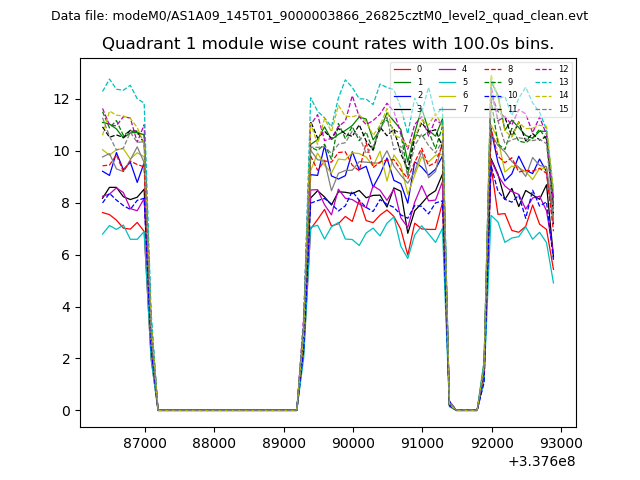
| Module-wise count rates for Quadrant A Data is divided into 100 sec bins |
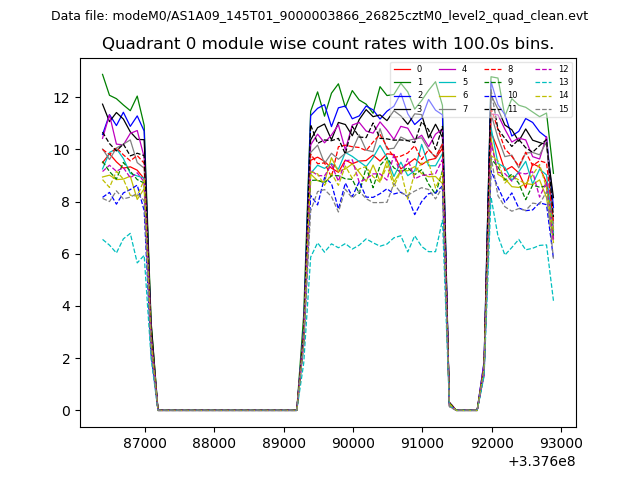 |
 |
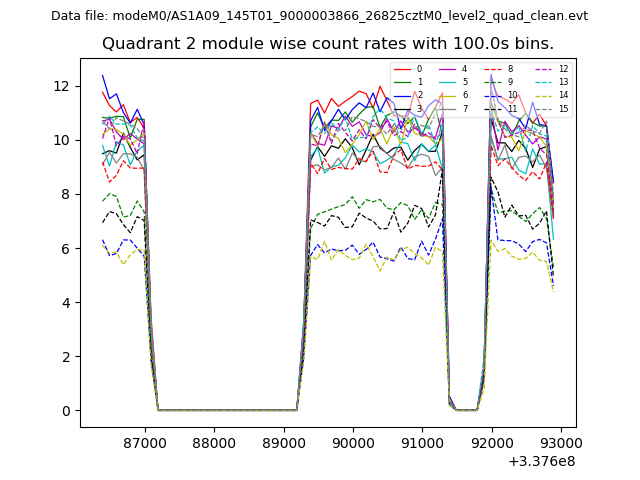
| Module-wise count rates for Quadrant B Data is divided into 100 sec bins |
 |
 |
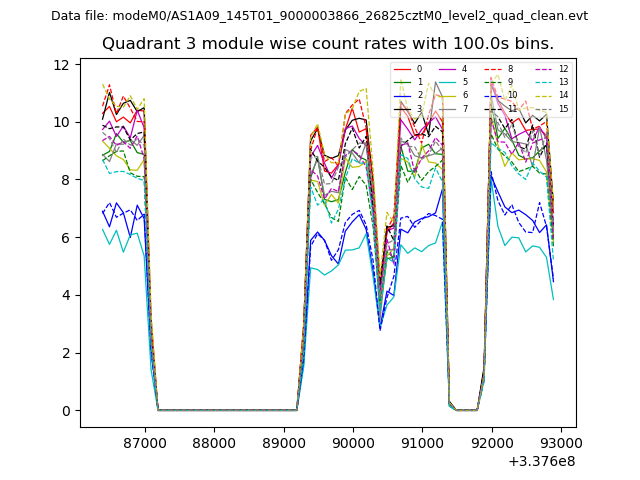
| Module-wise count rates for Quadrant C Data is divided into 100 sec bins |
 |
 |
| Module-wise count rates for Quadrant D Data is divided into 100 sec bins |
 |
 |
| Parameter | Plot |
|---|---|
| CZT HV Monitor | 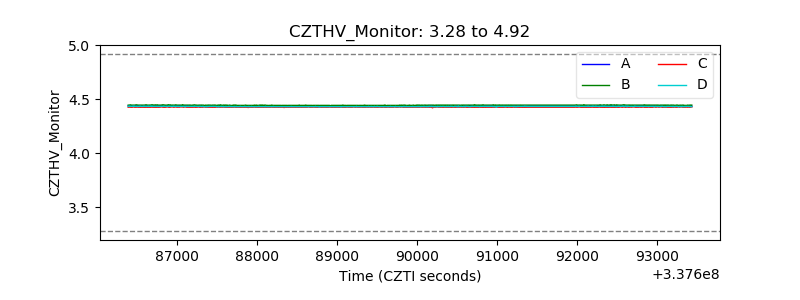 |
| D_VDD | 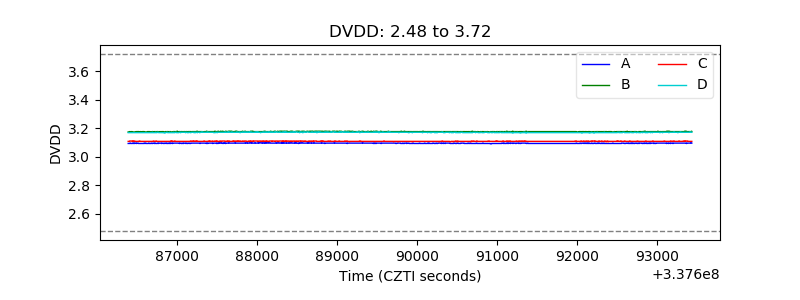 |
| Temperature 1 | 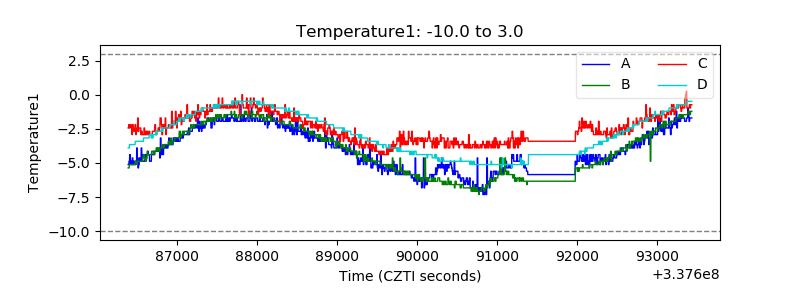 |
| Veto HV Monitor | 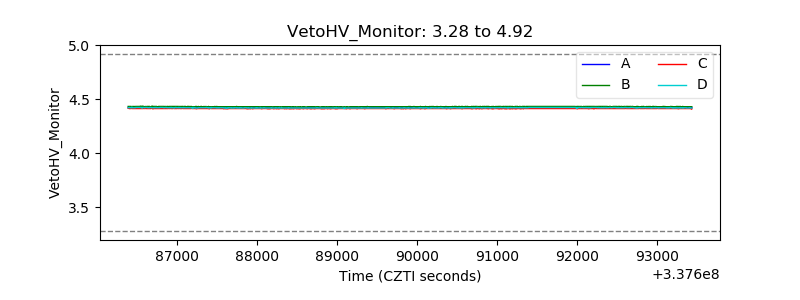 |
| Veto LLD | 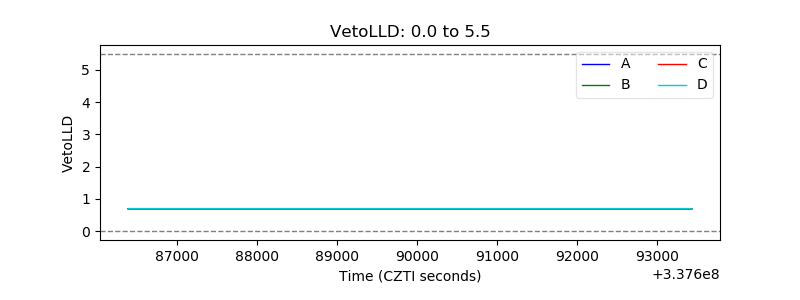 |
| Alpha Counter | 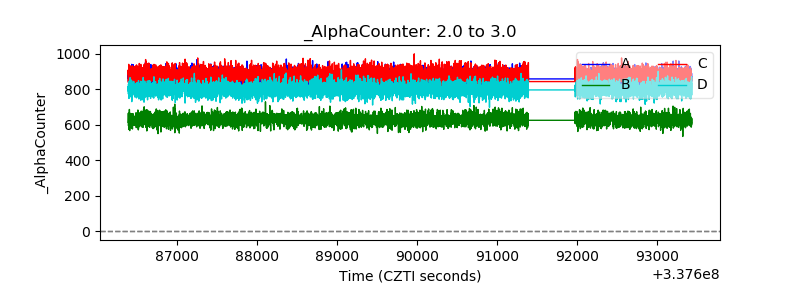 |
| _CPM_Rate |  |
| CZT Counter | 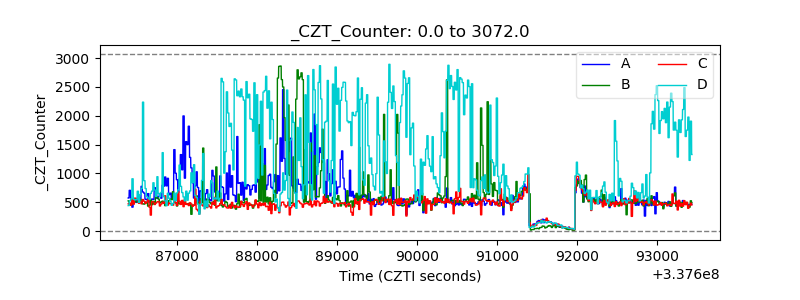 |
| +2.5 Volts monitor | 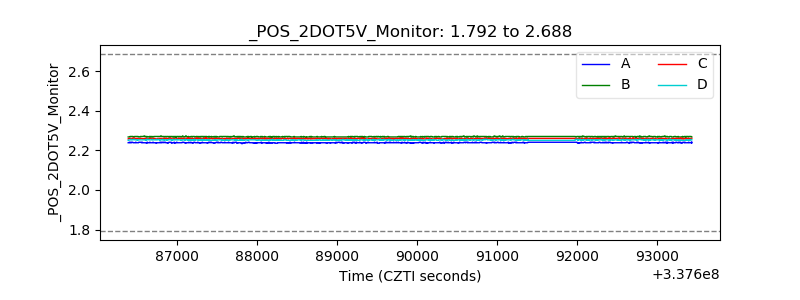 |
| +5 Volts monitor | 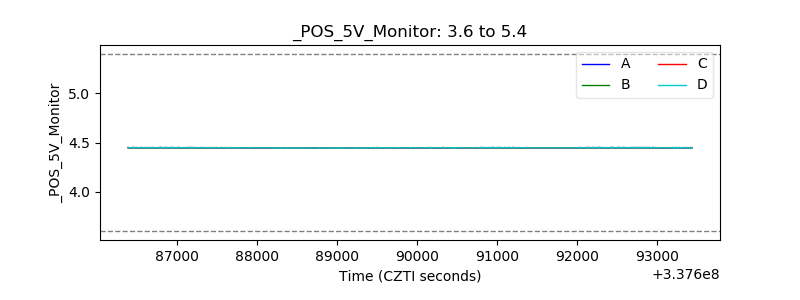 |
| _ROLL_ROT | 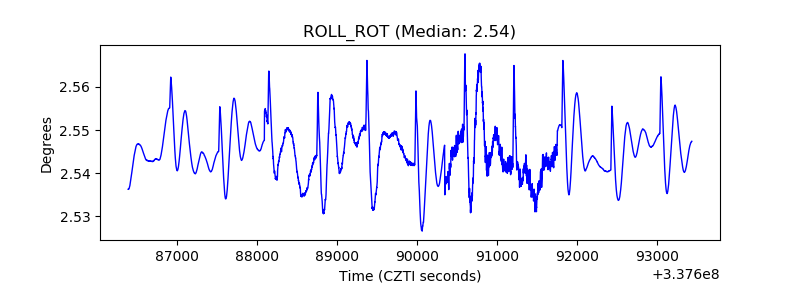 |
| _Roll_DEC | 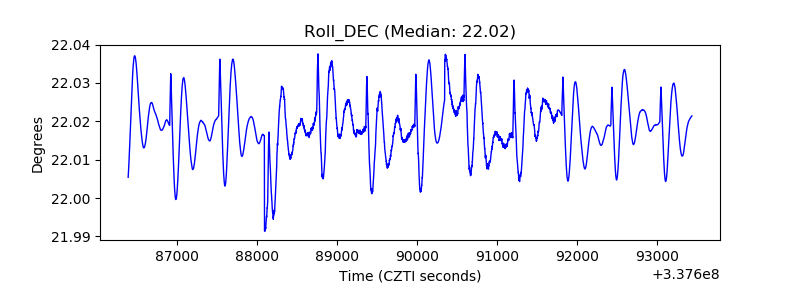 |
| _Roll_RA | 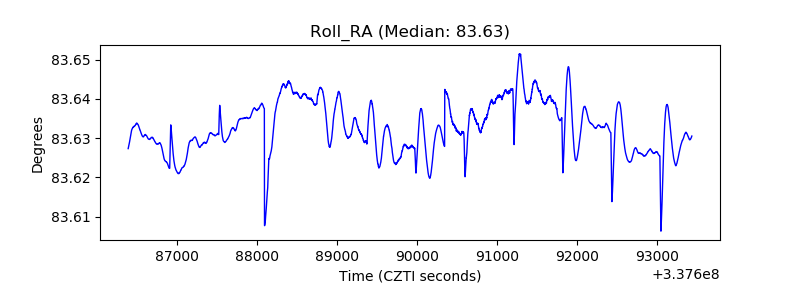 |
| Veto Counter |  |