| Param | Original file | Final file |
|---|---|---|
| Filename | modeM0/AS1A09_145T01_9000003866_26826cztM0_level2.evt | modeM0/AS1A09_145T01_9000003866_26826cztM0_level2_quad_clean.evt |
| Size (bytes) | 1,831,210,560 | 221,604,480 |
| Size | 1.7 GB | 211.3 MB |
| Events in quadrant A | 11,294,277 | 1,437,606 |
| Events in quadrant B | 11,342,501 | 1,430,864 |
| Events in quadrant C | 9,019,418 | 1,398,977 |
| Events in quadrant D | 22,630,037 | 1,241,929 |
| Mode M9 | |||
|---|---|---|---|
| Quadrant | BADHDUFLAG | Total packets | Discarded packets |
| A | 0 | 16 | 0 |
| B | 0 | 16 | 0 |
| C | 0 | 16 | 0 |
| D | 0 | 16 | 0 |
| Mode M0 | |||
|---|---|---|---|
| Quadrant | BADHDUFLAG | Total packets | Discarded packets |
| A | 0 | 44782 | 0 |
| B | 0 | 44105 | 0 |
| C | 0 | 37060 | 0 |
| D | 0 | 79254 | 0 |
| Quadrant | Total seconds | Saturated seconds | Saturation percentage |
|---|---|---|---|
| A | 17420 | 481 | 2.761194% |
| B | 17420 | 1195 | 6.859931% |
| C | 17420 | 483 | 2.772675% |
| D | 17420 | 4566 | 26.211251% |
Noise dominated data is calculated using 1-second bins in cleaned event files. If a bin has >2000 counts, and if more than 50% of those come from <1% of pixels, then it is considered to be noise-dominated and hence unusable.
| Quadrant | # 1 sec bins | Bins with >0 counts | Bins with >2000 counts | High rate bins dominated by noise | Noise dominated (total time) | Noise dominated (detector-on time) | Marked lightcurve |
|---|---|---|---|---|---|---|---|
| A | 19095 | 17423 | 53 | 53 | 0.28% | 0.30% | 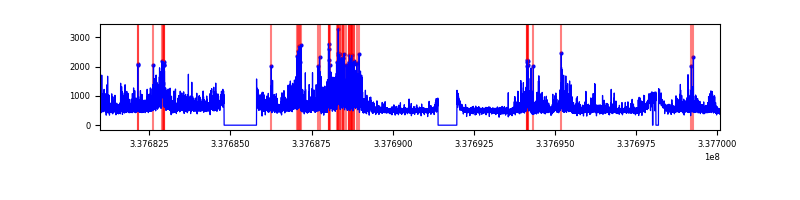 |
| B | 19095 | 17424 | 585 | 585 | 3.06% | 3.36% | 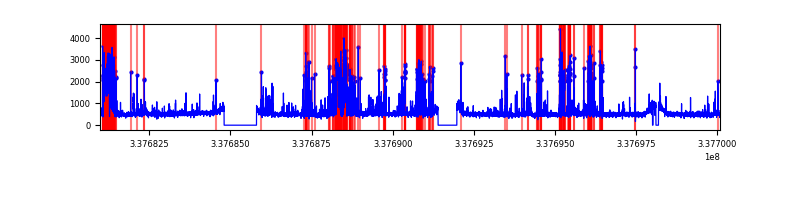 |
| C | 19095 | 17424 | 15 | 15 | 0.08% | 0.09% | 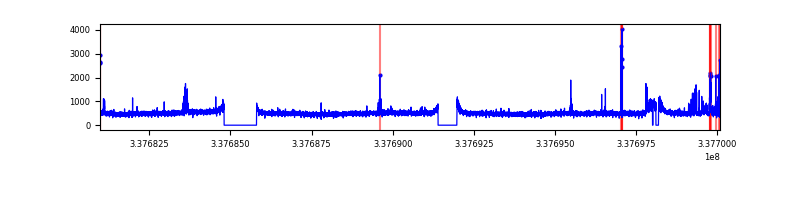 |
| D | 19095 | 17423 | 3658 | 3658 | 19.16% | 21.00% | 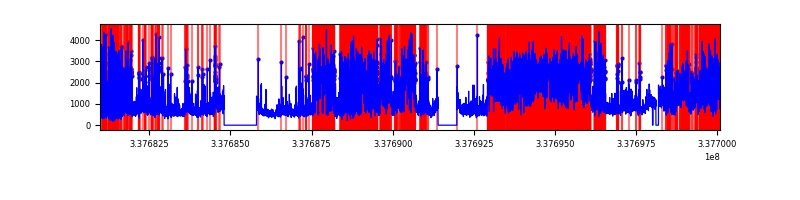 |
Top three noisy pixels from each quadrant. If the there are fewer than three noisy pixels in the level2.evt file, extra rows are filled as -1
| Pixel properties | Quadrant properties | ||||||
|---|---|---|---|---|---|---|---|
| Quadrant | DetID | PixID | Counts | Sigma | Mean | Median | Sigma |
| A | 0 | 13 | 2408548 | 5277.19 | 2260 | 2217 | 456.0 |
| A | 8 | 255 | 116056 | 249.65 | 2260 | 2217 | 456.0 |
| A | 6 | 16 | 38385 | 79.32 | 2260 | 2217 | 456.0 |
| B | 3 | 64 | 1618920 | 3856.41 | 2191 | 2140 | 419.2 |
| B | 0 | 189 | 906292 | 2156.62 | 2191 | 2140 | 419.2 |
| B | 10 | 246 | 89646 | 208.72 | 2191 | 2140 | 419.2 |
| C | 14 | 238 | 344276 | 675.6 | 2161 | 2178 | 506.4 |
| C | 14 | 176 | 159596 | 310.88 | 2161 | 2178 | 506.4 |
| C | 15 | 208 | 75763 | 145.32 | 2161 | 2178 | 506.4 |
| D | 1 | 52 | 8322421 | 17614.25 | 1971 | 1924 | 472.4 |
| D | 7 | 80 | 6016530 | 12732.75 | 1971 | 1924 | 472.4 |
| D | 2 | 250 | 605298 | 1277.33 | 1971 | 1924 | 472.4 |
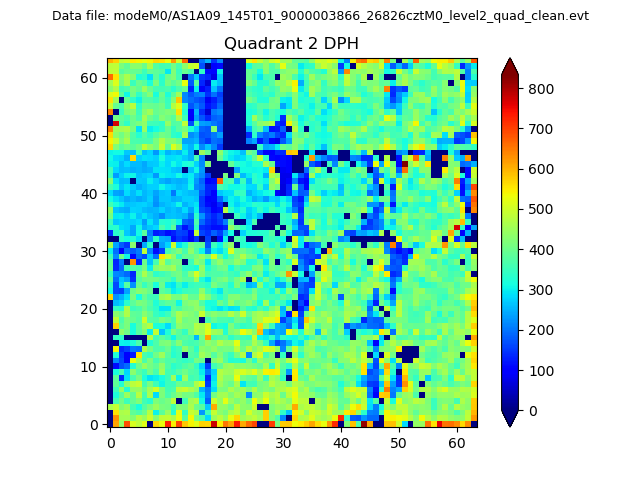
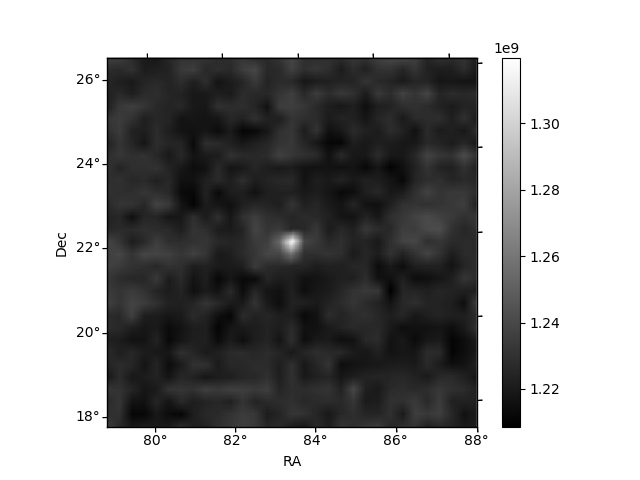
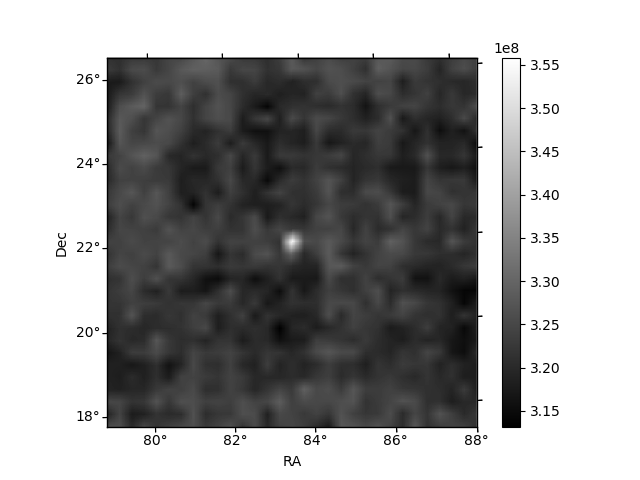
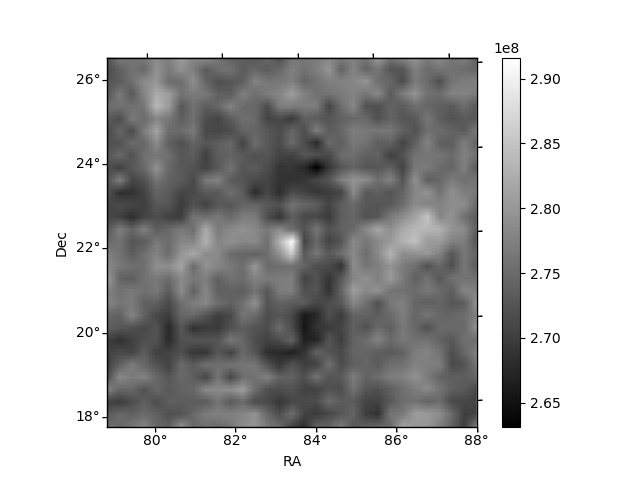
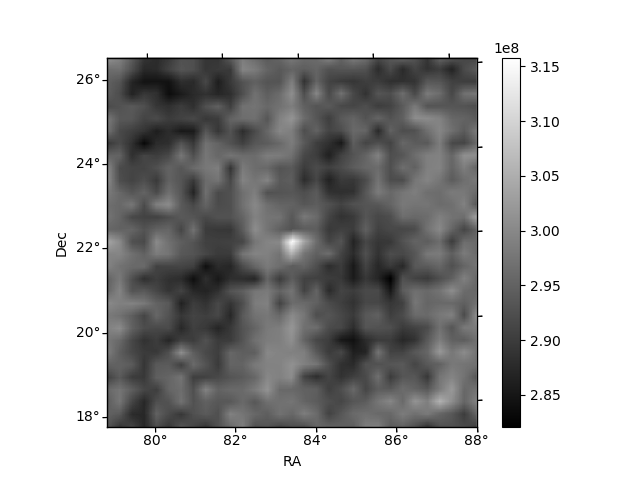
Histogram calculated using DETX and DETY for each event in the final _common_clean file
| Quadrant A | 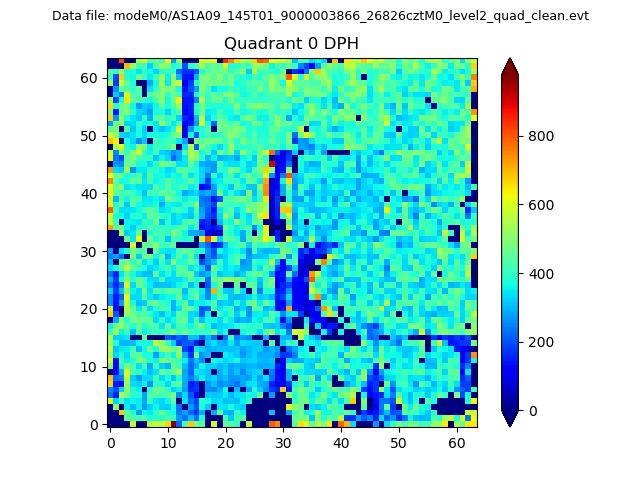 |
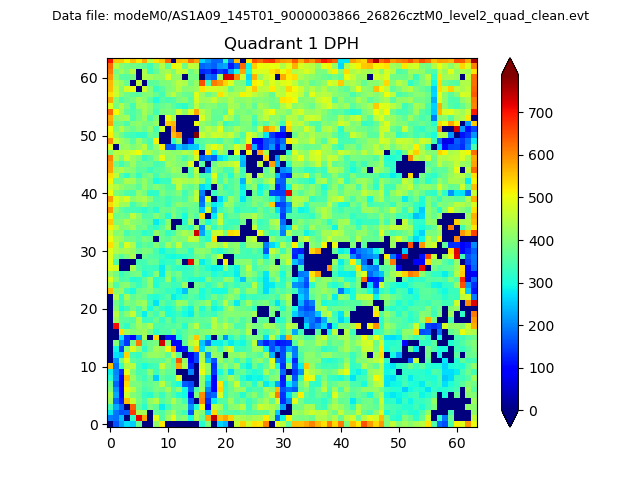 |
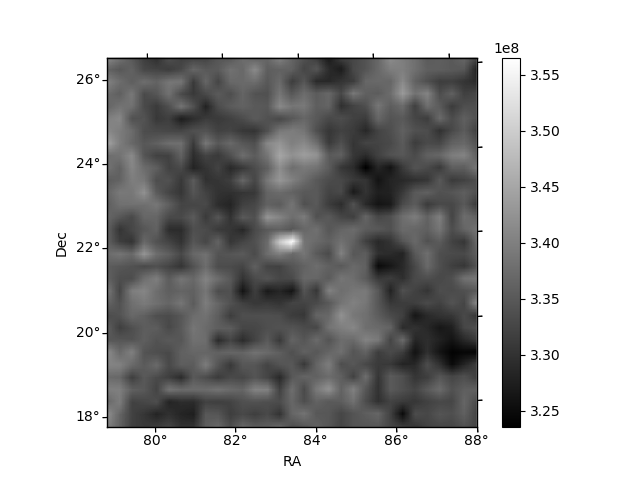
Quadrant B |
|---|---|---|---|
| Quadrant D | 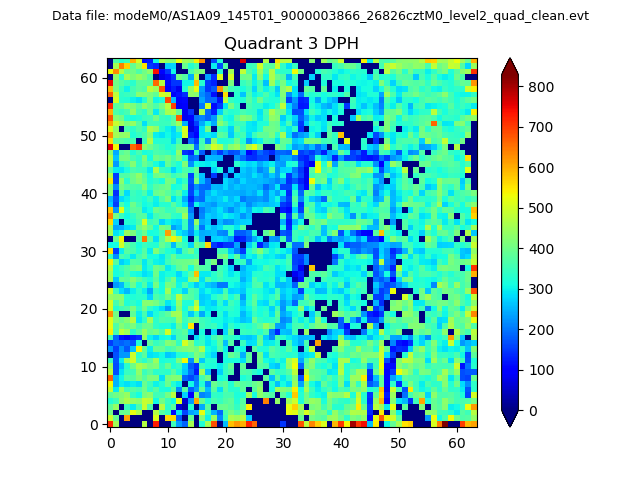 |
 |
Quadrant C |
| Plot type | Count rate plots | Images |
|---|---|---|
| Comparison with Poisson distribution Blue bars denote a histogram of data divided into 1 sec bins. Red curve is a Poisson curve with rate = median count rate of data. |
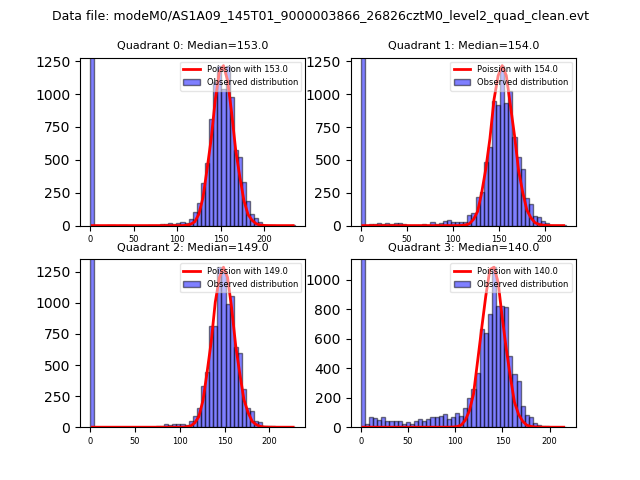 |
 |
| Quadrant-wise count rates Data is divided into 100 sec bins |
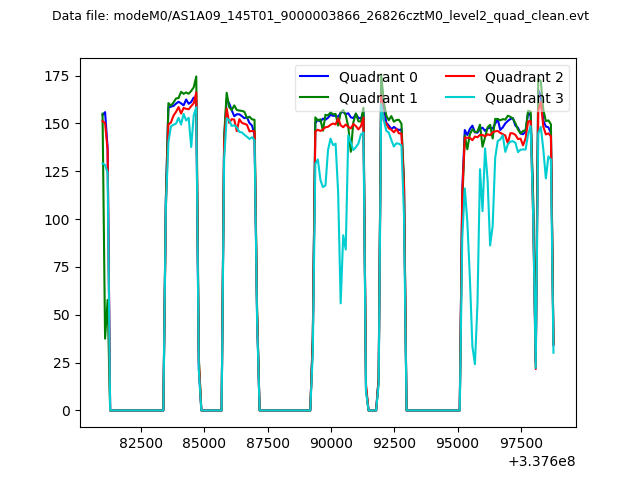 |
|
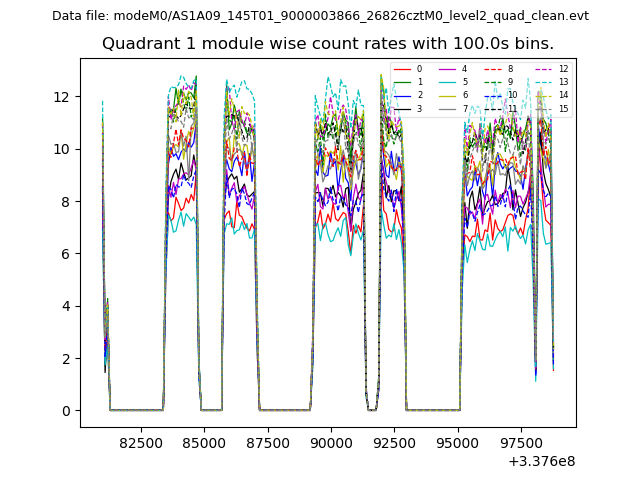
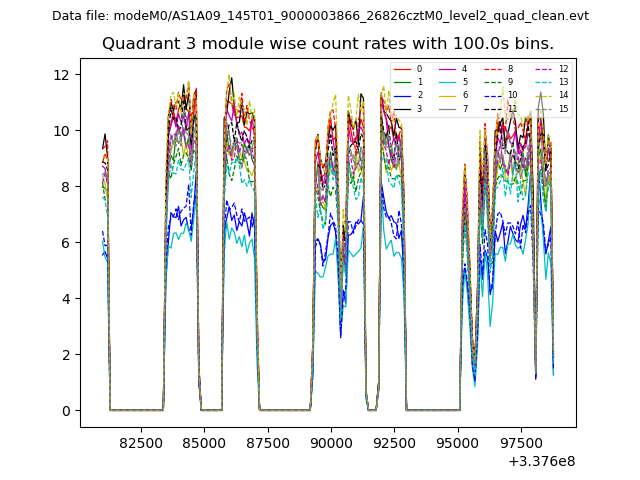
| Module-wise count rates for Quadrant A Data is divided into 100 sec bins |
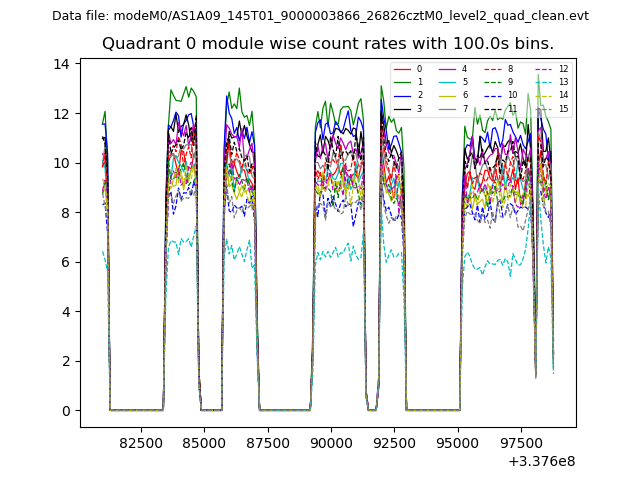 |
 |
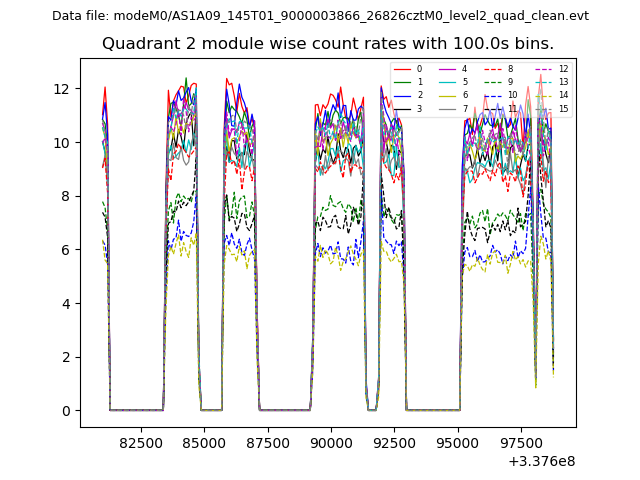
| Module-wise count rates for Quadrant B Data is divided into 100 sec bins |
 |
 |
| Module-wise count rates for Quadrant C Data is divided into 100 sec bins |
 |
 |
| Module-wise count rates for Quadrant D Data is divided into 100 sec bins |
 |
 |
| Parameter | Plot |
|---|---|
| CZT HV Monitor | 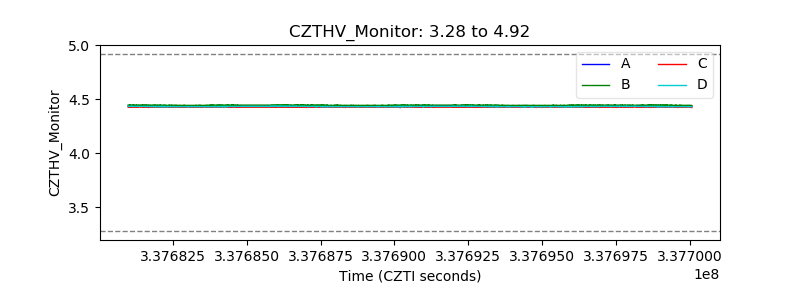 |
| D_VDD | 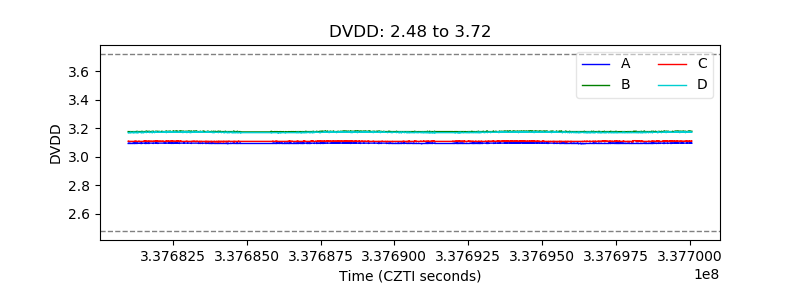 |
| Temperature 1 | 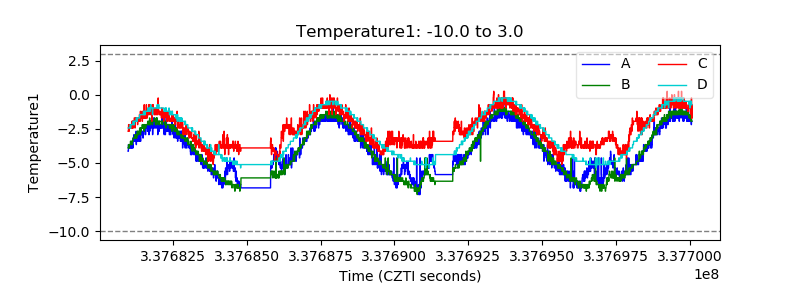 |
| Veto HV Monitor | 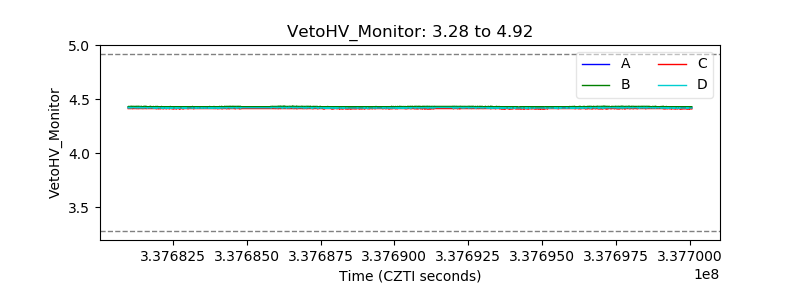 |
| Veto LLD | 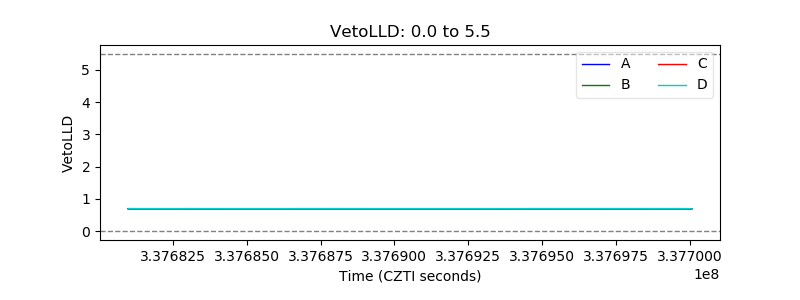 |
| Alpha Counter | 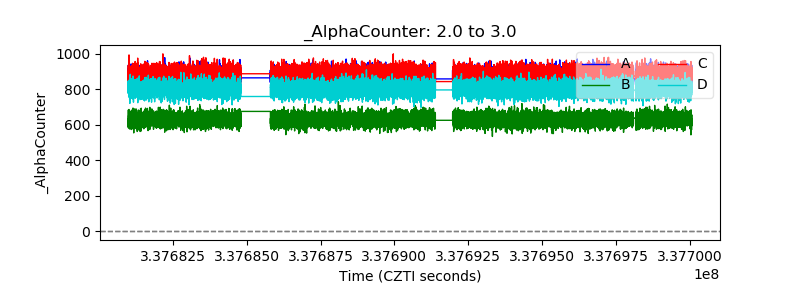 |
| _CPM_Rate | 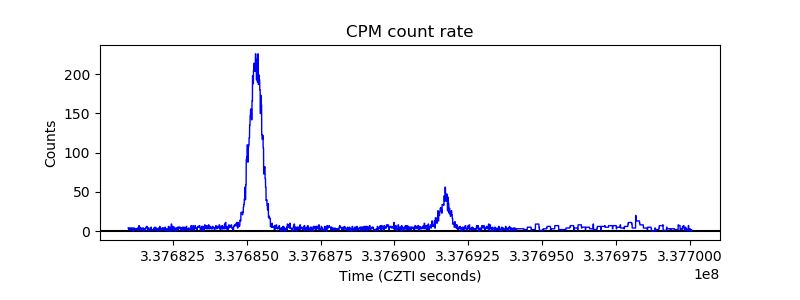 |
| CZT Counter |  |
| +2.5 Volts monitor |  |
| +5 Volts monitor |  |
| _ROLL_ROT | 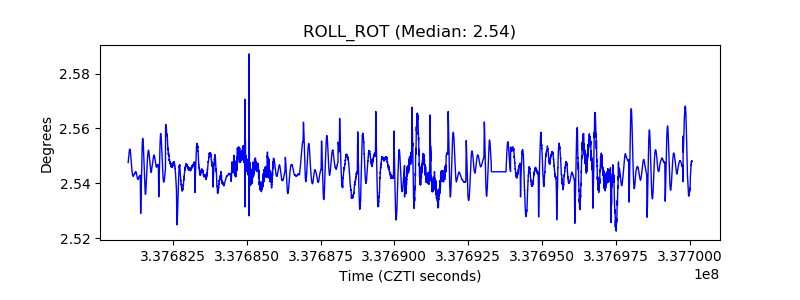 |
| _Roll_DEC | 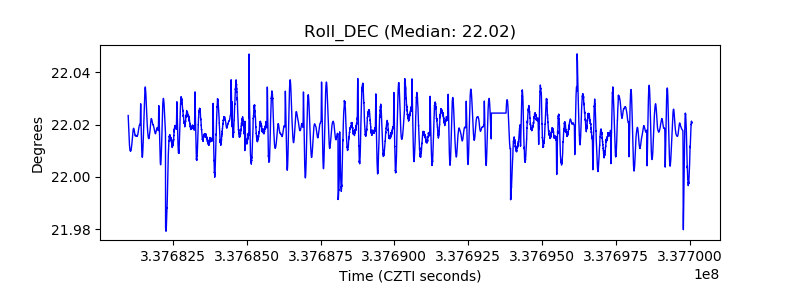 |
| _Roll_RA | 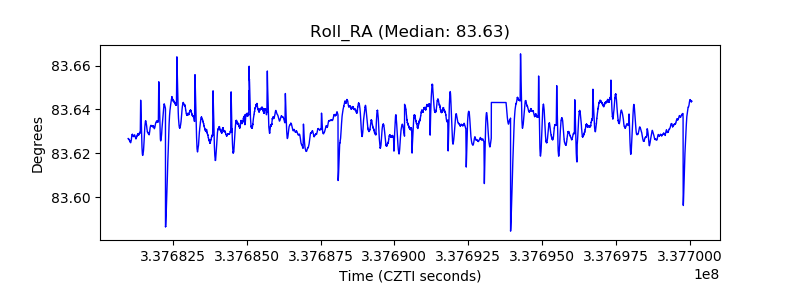 |
| Veto Counter | 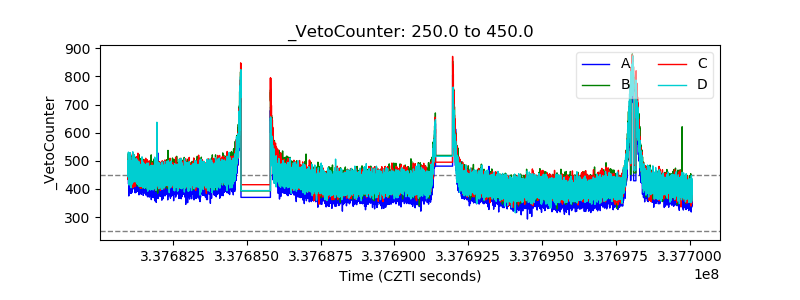 |