| Param | Original file | Final file |
|---|---|---|
| Filename | modeM0/AS1A09_145T01_9000003866_26827cztM0_level2.evt | modeM0/AS1A09_145T01_9000003866_26827cztM0_level2_quad_clean.evt |
| Size (bytes) | 752,857,920 | 78,217,920 |
| Size | 718.0 MB | 74.6 MB |
| Events in quadrant A | 4,692,263 | 488,687 |
| Events in quadrant B | 3,849,634 | 491,525 |
| Events in quadrant C | 3,691,672 | 477,897 |
| Events in quadrant D | 10,088,477 | 416,673 |
| Mode M9 | |||
|---|---|---|---|
| Quadrant | BADHDUFLAG | Total packets | Discarded packets |
| A | 0 | 2 | 0 |
| B | 0 | 2 | 0 |
| C | 0 | 2 | 0 |
| D | 0 | 2 | 0 |
| Mode M0 | |||
|---|---|---|---|
| Quadrant | BADHDUFLAG | Total packets | Discarded packets |
| A | 0 | 18691 | 0 |
| B | 0 | 15580 | 0 |
| C | 0 | 15248 | 0 |
| D | 0 | 34880 | 0 |
| Quadrant | Total seconds | Saturated seconds | Saturation percentage |
|---|---|---|---|
| A | 7081 | 125 | 1.765287% |
| B | 7082 | 177 | 2.499294% |
| C | 7082 | 109 | 1.539113% |
| D | 7081 | 1978 | 27.933908% |
Noise dominated data is calculated using 1-second bins in cleaned event files. If a bin has >2000 counts, and if more than 50% of those come from <1% of pixels, then it is considered to be noise-dominated and hence unusable.
| Quadrant | # 1 sec bins | Bins with >0 counts | Bins with >2000 counts | High rate bins dominated by noise | Noise dominated (total time) | Noise dominated (detector-on time) | Marked lightcurve |
|---|---|---|---|---|---|---|---|
| A | 7357 | 7083 | 8 | 8 | 0.11% | 0.11% | 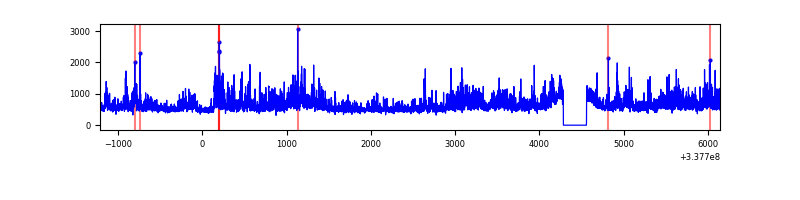 |
| B | 7358 | 7084 | 62 | 62 | 0.84% | 0.88% | 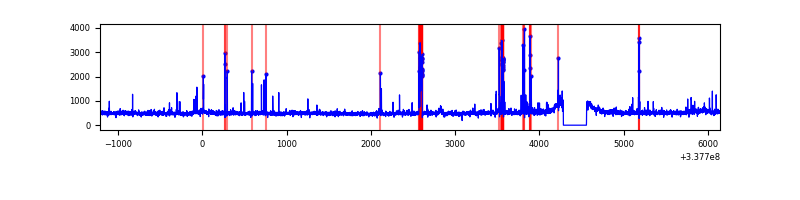 |
| C | 7358 | 7084 | 8 | 8 | 0.11% | 0.11% | 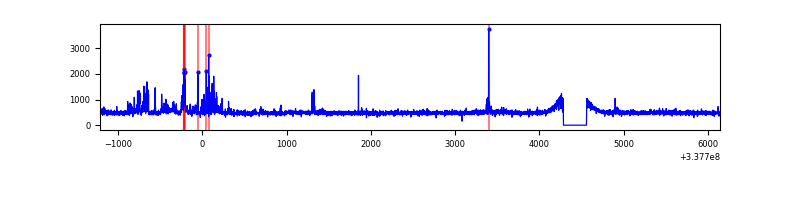 |
| D | 7357 | 7083 | 1611 | 1611 | 21.90% | 22.74% | 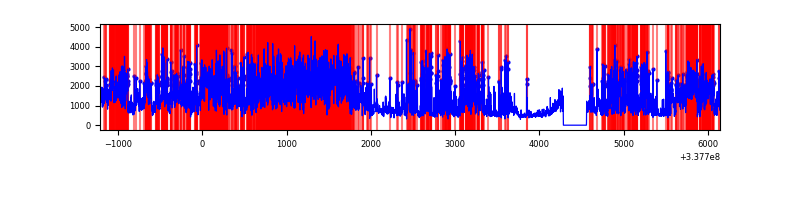 |
Top three noisy pixels from each quadrant. If the there are fewer than three noisy pixels in the level2.evt file, extra rows are filled as -1
| Pixel properties | Quadrant properties | ||||||
|---|---|---|---|---|---|---|---|
| Quadrant | DetID | PixID | Counts | Sigma | Mean | Median | Sigma |
| A | 0 | 13 | 1238687 | 6838.69 | 893 | 877 | 181.0 |
| A | 13 | 254 | 11624 | 59.38 | 893 | 877 | 181.0 |
| A | 3 | 137 | 8376 | 41.43 | 893 | 877 | 181.0 |
| B | 3 | 64 | 127829 | 749.05 | 881 | 861 | 169.5 |
| B | 10 | 246 | 114338 | 669.46 | 881 | 861 | 169.5 |
| B | 7 | 205 | 91477 | 534.59 | 881 | 861 | 169.5 |
| C | 14 | 176 | 206823 | 1020.02 | 853 | 859 | 201.9 |
| C | 14 | 238 | 135632 | 667.45 | 853 | 859 | 201.9 |
| C | 15 | 208 | 23272 | 111.0 | 853 | 859 | 201.9 |
| D | 1 | 52 | 4346885 | 22752.85 | 790 | 774 | 191.0 |
| D | 7 | 80 | 2352272 | 12310.61 | 790 | 774 | 191.0 |
| D | 2 | 250 | 264764 | 1382.05 | 790 | 774 | 191.0 |
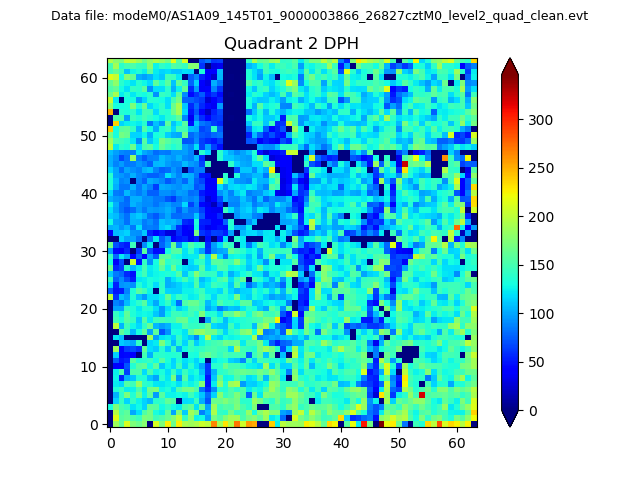
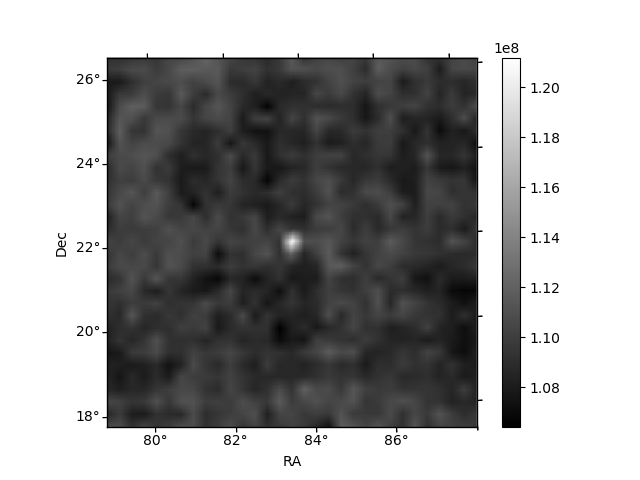
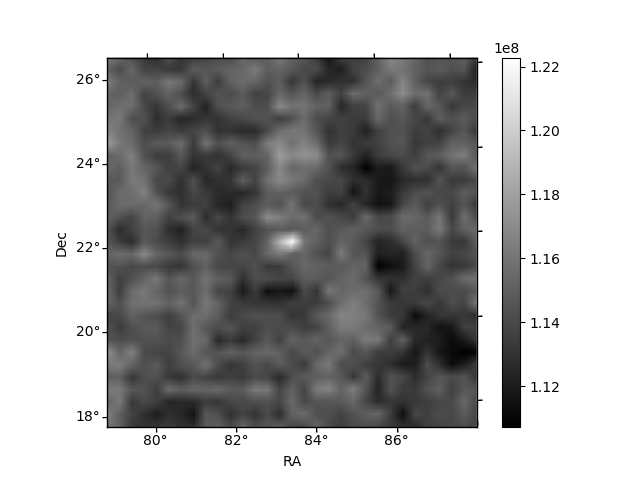
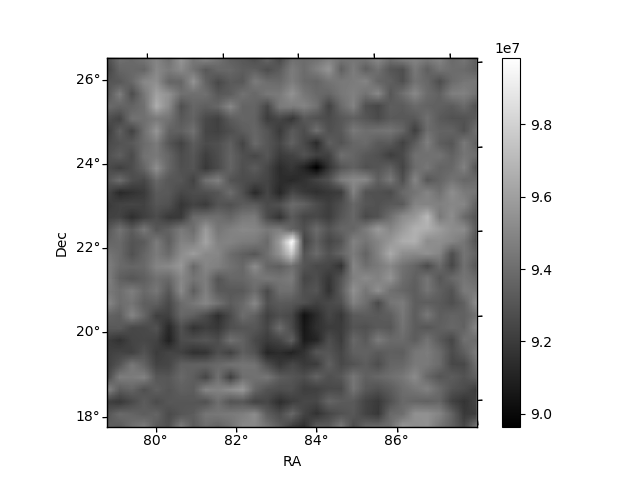
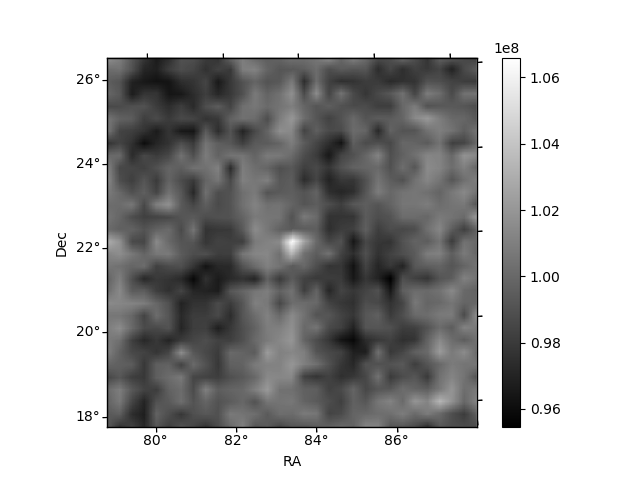
Histogram calculated using DETX and DETY for each event in the final _common_clean file
| Quadrant A | 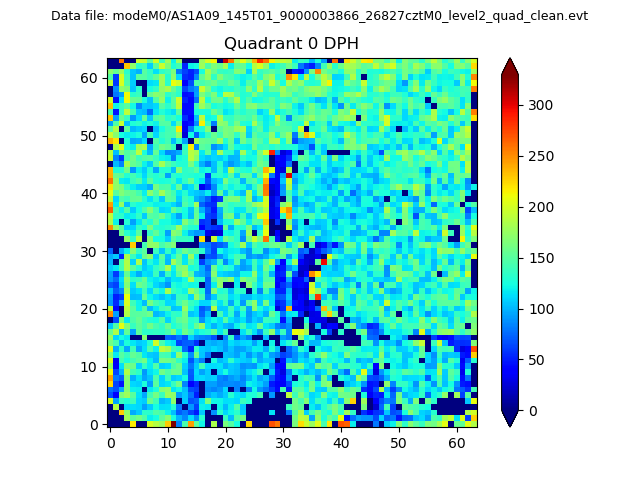 |
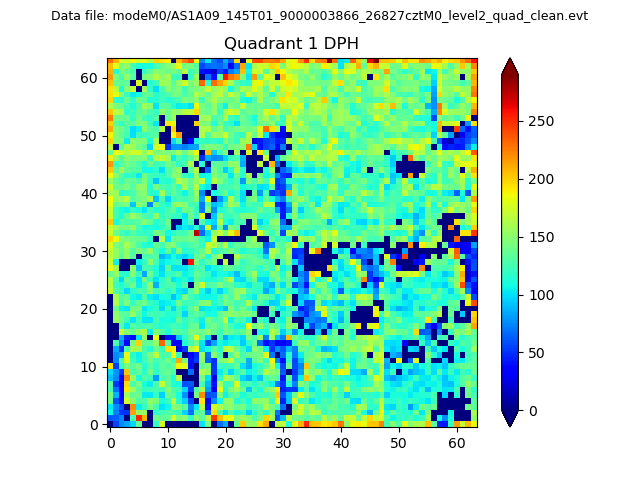 |
Quadrant B |
|---|---|---|---|
| Quadrant D | 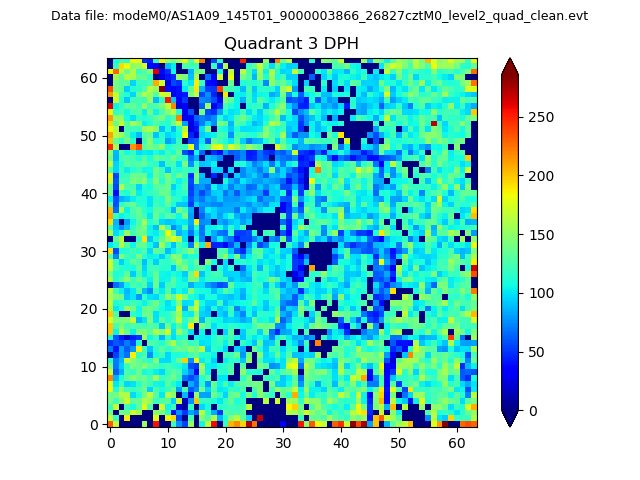 |
 |
Quadrant C |
| Plot type | Count rate plots | Images |
|---|---|---|
| Comparison with Poisson distribution Blue bars denote a histogram of data divided into 1 sec bins. Red curve is a Poisson curve with rate = median count rate of data. |
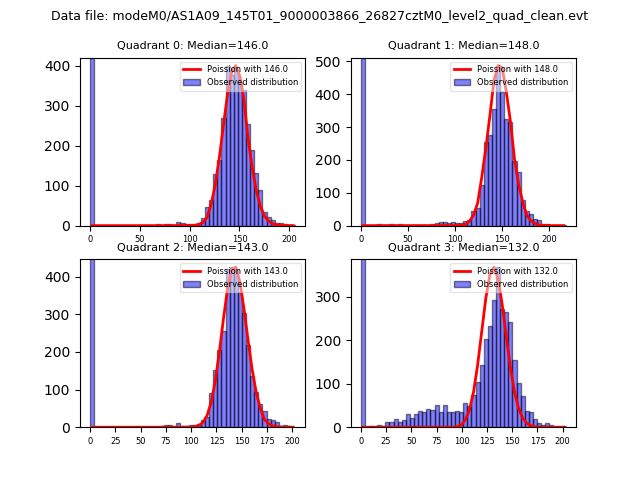 |
 |
| Quadrant-wise count rates Data is divided into 100 sec bins |
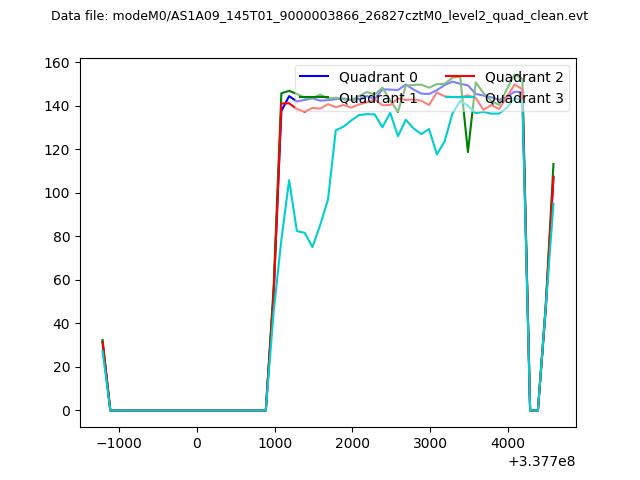 |
|
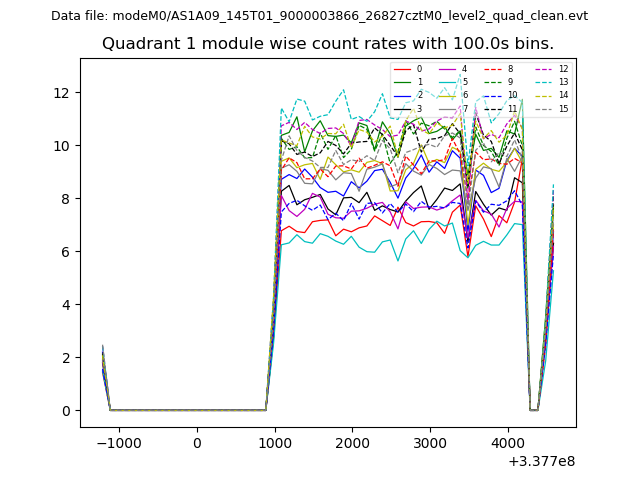
| Module-wise count rates for Quadrant A Data is divided into 100 sec bins |
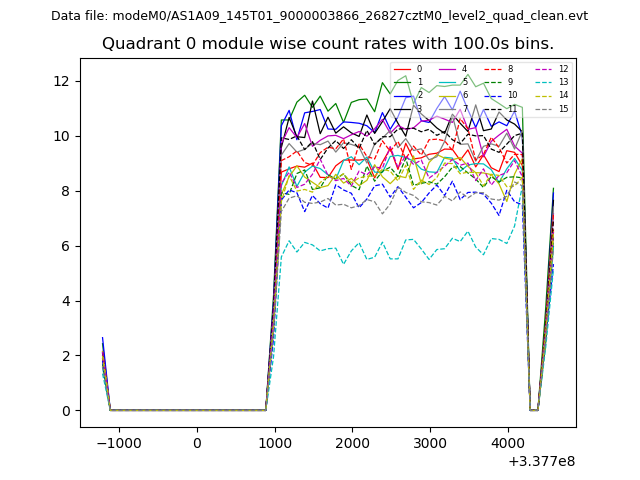 |
 |
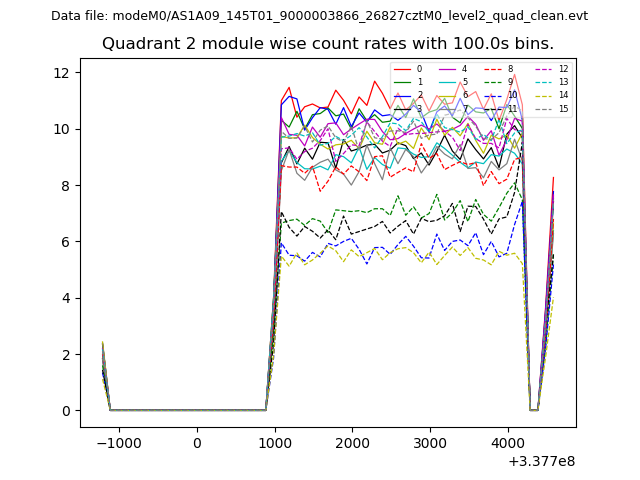
| Module-wise count rates for Quadrant B Data is divided into 100 sec bins |
 |
 |
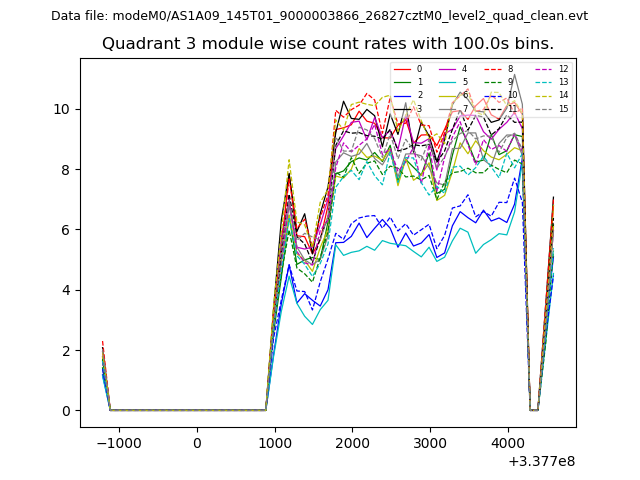
| Module-wise count rates for Quadrant C Data is divided into 100 sec bins |
 |
 |
| Module-wise count rates for Quadrant D Data is divided into 100 sec bins |
 |
 |
| Parameter | Plot |
|---|---|
| CZT HV Monitor | 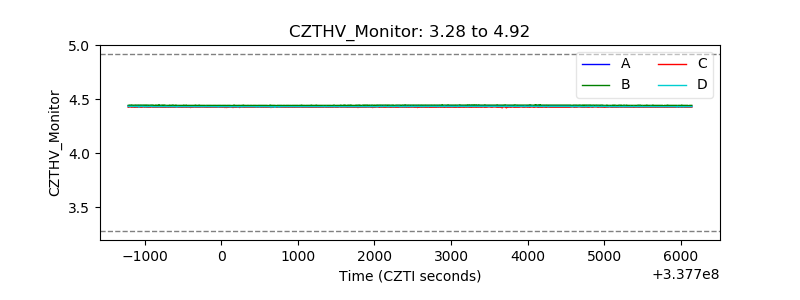 |
| D_VDD | 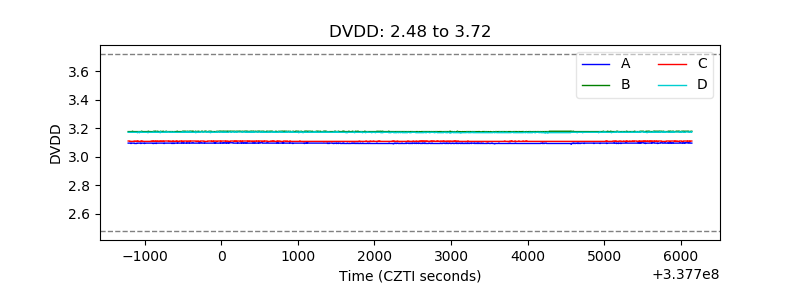 |
| Temperature 1 | 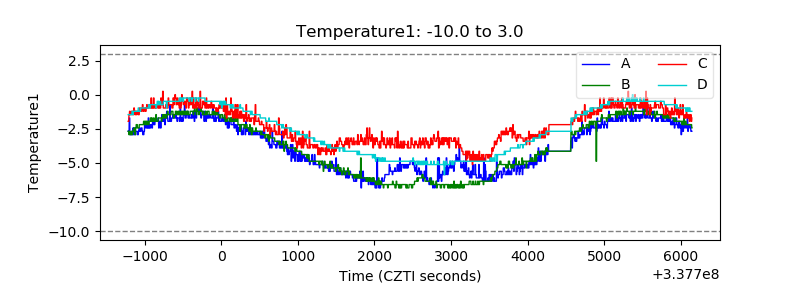 |
| Veto HV Monitor | 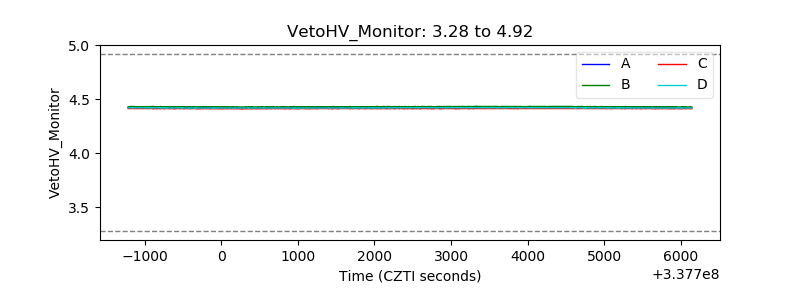 |
| Veto LLD | 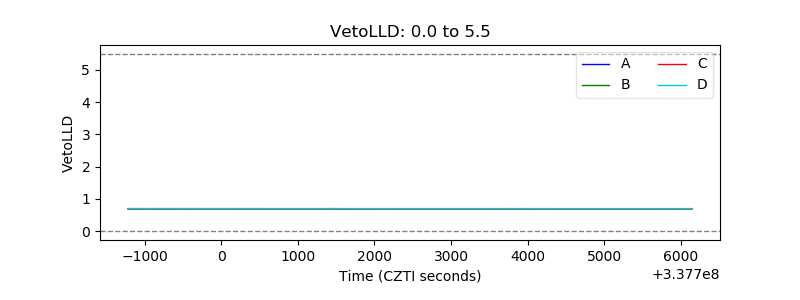 |
| Alpha Counter | 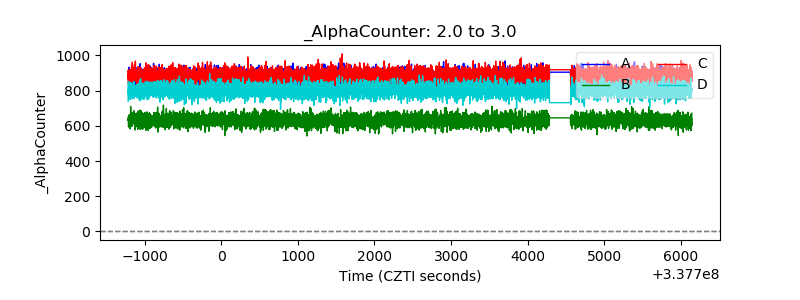 |
| _CPM_Rate | 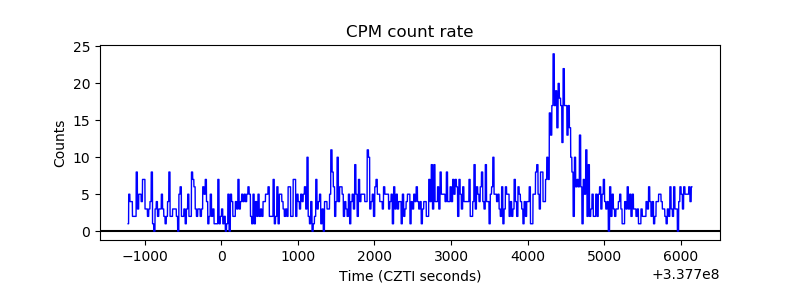 |
| CZT Counter | 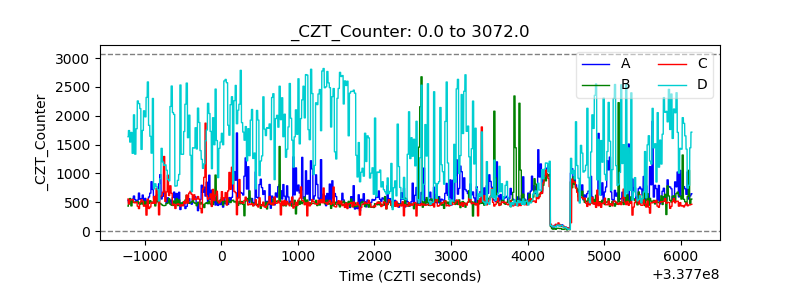 |
| +2.5 Volts monitor | 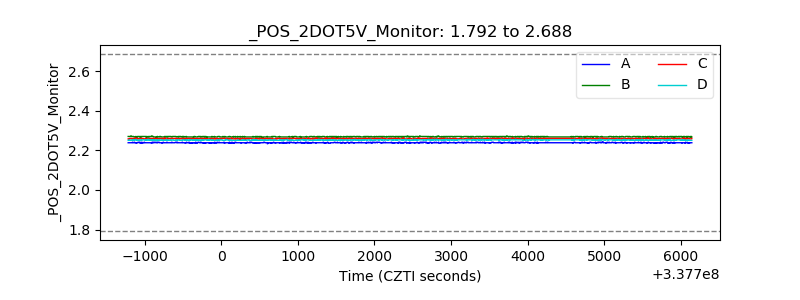 |
| +5 Volts monitor | 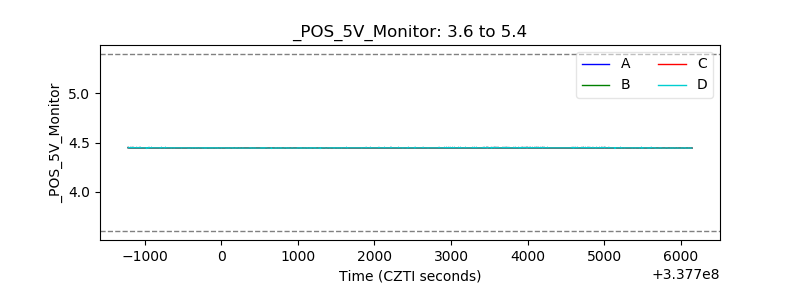 |
| _ROLL_ROT | 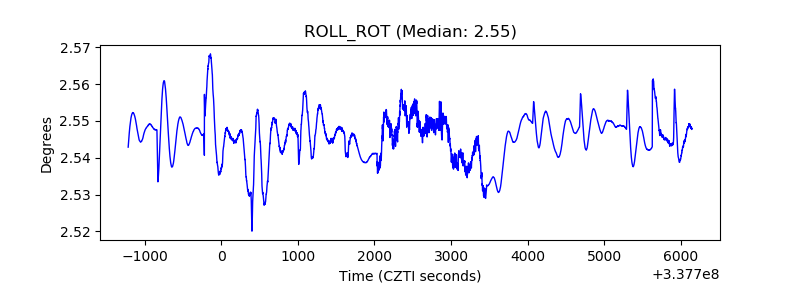 |
| _Roll_DEC | 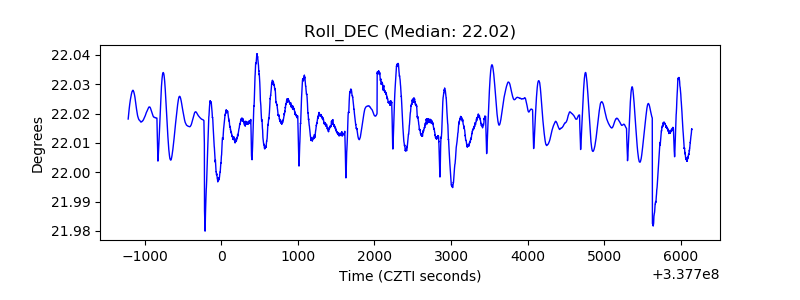 |
| _Roll_RA | 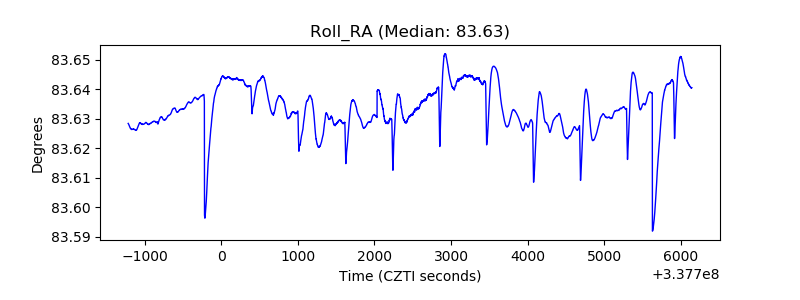 |
| Veto Counter | 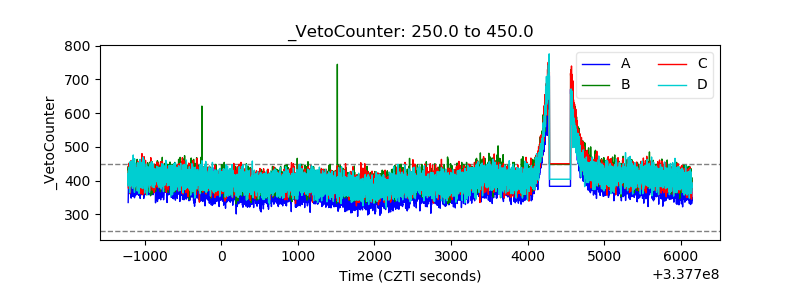 |