| Param | Original file | Final file |
|---|---|---|
| Filename | modeM0/AS1A09_145T01_9000003866_26830cztM0_level2.evt | modeM0/AS1A09_145T01_9000003866_26830cztM0_level2_quad_clean.evt |
| Size (bytes) | 1,610,089,920 | 250,462,080 |
| Size | 1.5 GB | 238.9 MB |
| Events in quadrant A | 11,410,287 | 1,623,985 |
| Events in quadrant B | 9,418,062 | 1,642,424 |
| Events in quadrant C | 8,847,637 | 1,582,840 |
| Events in quadrant D | 17,875,649 | 1,498,555 |
| Mode M9 | |||
|---|---|---|---|
| Quadrant | BADHDUFLAG | Total packets | Discarded packets |
| A | 0 | 19 | 0 |
| B | 0 | 19 | 0 |
| C | 0 | 19 | 0 |
| D | 0 | 19 | 0 |
| Mode M0 | |||
|---|---|---|---|
| Quadrant | BADHDUFLAG | Total packets | Discarded packets |
| A | 0 | 45861 | 0 |
| B | 0 | 38555 | 0 |
| C | 0 | 36883 | 0 |
| D | 0 | 65349 | 0 |
| Quadrant | Total seconds | Saturated seconds | Saturation percentage |
|---|---|---|---|
| A | 17959 | 289 | 1.609221% |
| B | 17959 | 268 | 1.492288% |
| C | 17960 | 251 | 1.397550% |
| D | 17960 | 2399 | 13.357461% |
Noise dominated data is calculated using 1-second bins in cleaned event files. If a bin has >2000 counts, and if more than 50% of those come from <1% of pixels, then it is considered to be noise-dominated and hence unusable.
| Quadrant | # 1 sec bins | Bins with >0 counts | Bins with >2000 counts | High rate bins dominated by noise | Noise dominated (total time) | Noise dominated (detector-on time) | Marked lightcurve |
|---|---|---|---|---|---|---|---|
| A | 19834 | 17961 | 64 | 64 | 0.32% | 0.36% | 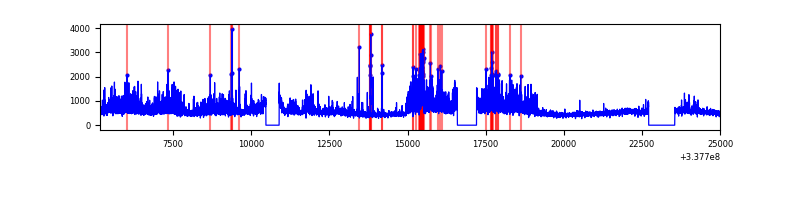 |
| B | 19834 | 17960 | 66 | 66 | 0.33% | 0.37% | 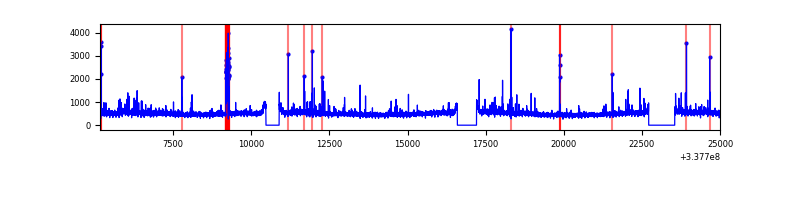 |
| C | 19835 | 17960 | 0 | 0 | 0.00% | 0.00% | 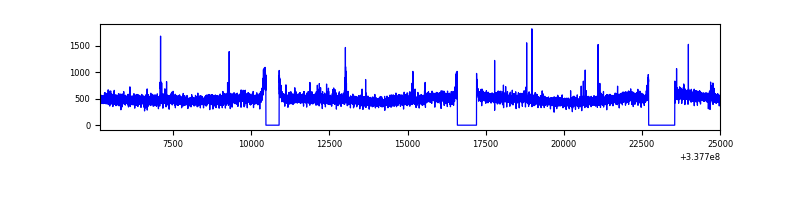 |
| D | 19835 | 17961 | 1715 | 1715 | 8.65% | 9.55% | 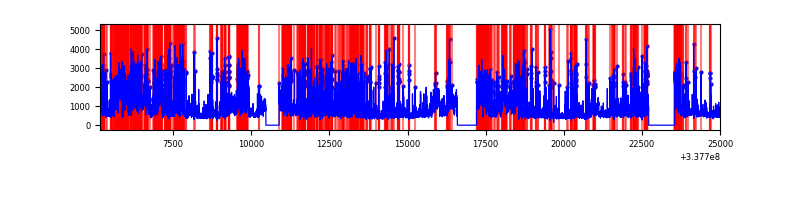 |
Top three noisy pixels from each quadrant. If the there are fewer than three noisy pixels in the level2.evt file, extra rows are filled as -1
| Pixel properties | Quadrant properties | ||||||
|---|---|---|---|---|---|---|---|
| Quadrant | DetID | PixID | Counts | Sigma | Mean | Median | Sigma |
| A | 0 | 13 | 2715879 | 5983.64 | 2252 | 2212 | 453.5 |
| A | 13 | 254 | 28975 | 59.01 | 2252 | 2212 | 453.5 |
| A | 3 | 137 | 20661 | 40.68 | 2252 | 2212 | 453.5 |
| B | 7 | 205 | 256491 | 599.04 | 2238 | 2189 | 424.5 |
| B | 10 | 246 | 256201 | 598.36 | 2238 | 2189 | 424.5 |
| B | 15 | 33 | 53118 | 119.97 | 2238 | 2189 | 424.5 |
| C | 14 | 238 | 346287 | 675.16 | 2164 | 2185 | 509.7 |
| C | 15 | 208 | 34422 | 63.25 | 2164 | 2185 | 509.7 |
| C | 3 | 233 | 26945 | 48.58 | 2164 | 2185 | 509.7 |
| D | 1 | 52 | 6712213 | 13370.26 | 2092 | 2043 | 501.9 |
| D | 7 | 80 | 2144908 | 4269.74 | 2092 | 2043 | 501.9 |
| D | 2 | 250 | 659557 | 1310.12 | 2092 | 2043 | 501.9 |
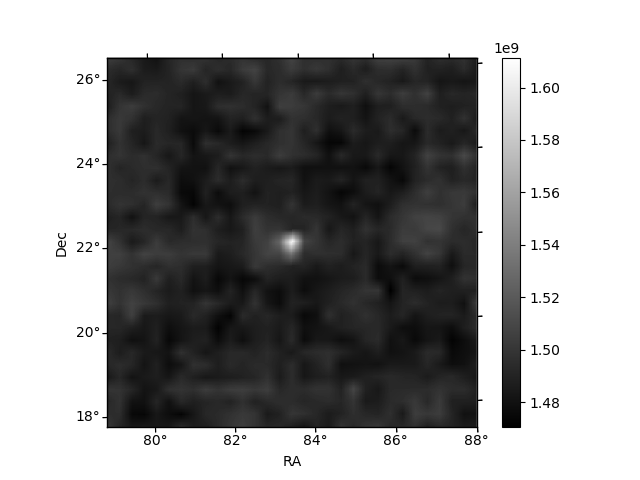
Histogram calculated using DETX and DETY for each event in the final _common_clean file
| Quadrant A | 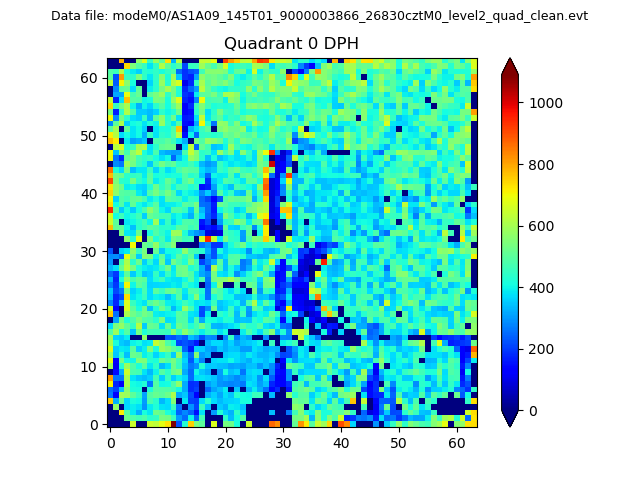 |
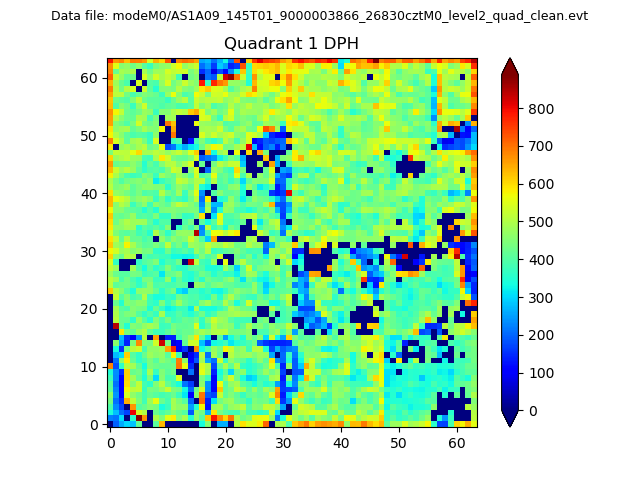 |
Quadrant B |
|---|---|---|---|
| Quadrant D |  |
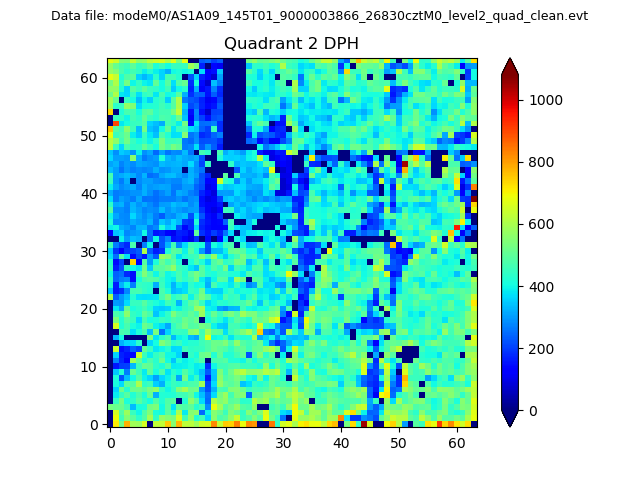 |
Quadrant C |
| Plot type | Count rate plots | Images |
|---|---|---|
| Comparison with Poisson distribution Blue bars denote a histogram of data divided into 1 sec bins. Red curve is a Poisson curve with rate = median count rate of data. |
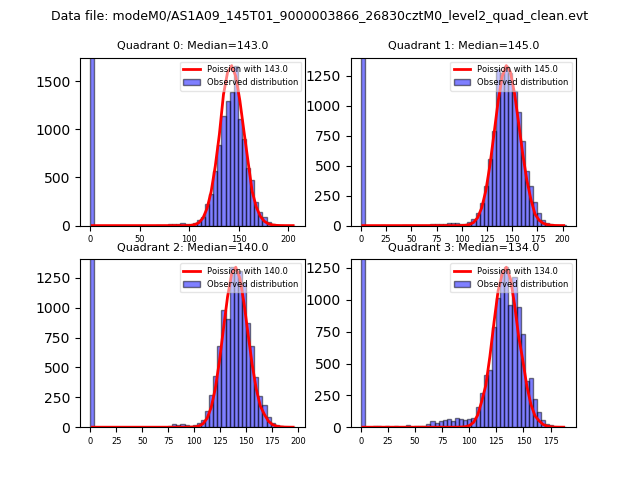 |
 |
| Quadrant-wise count rates Data is divided into 100 sec bins |
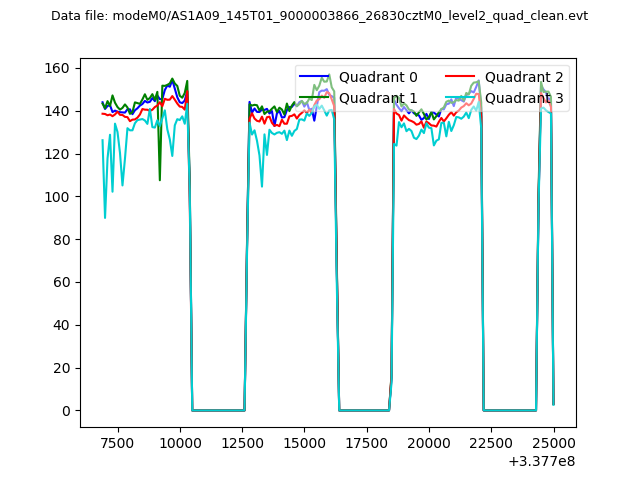 |
|
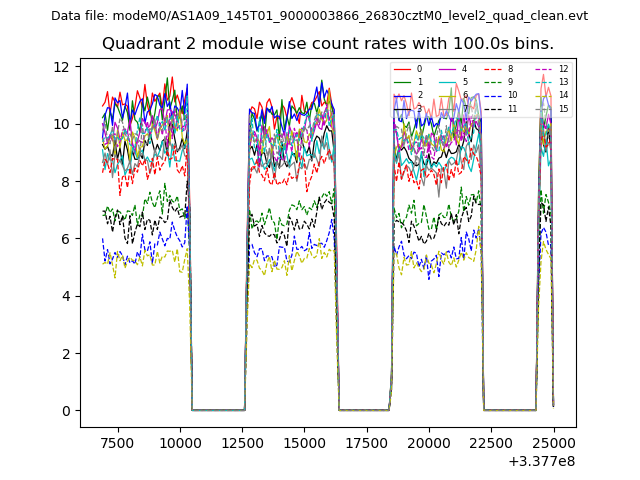
| Module-wise count rates for Quadrant A Data is divided into 100 sec bins |
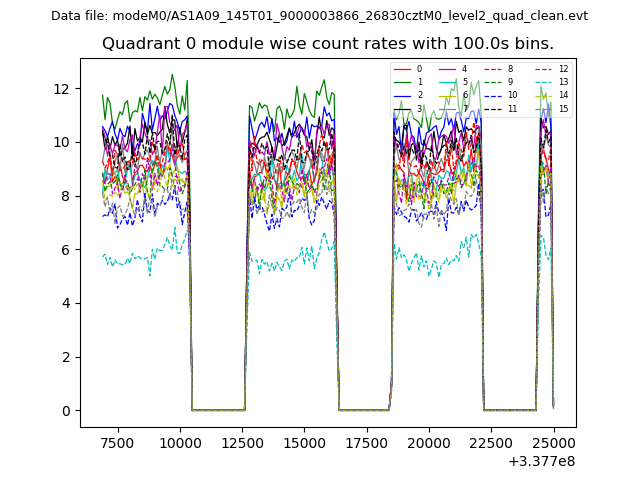 |
 |
| Module-wise count rates for Quadrant B Data is divided into 100 sec bins |
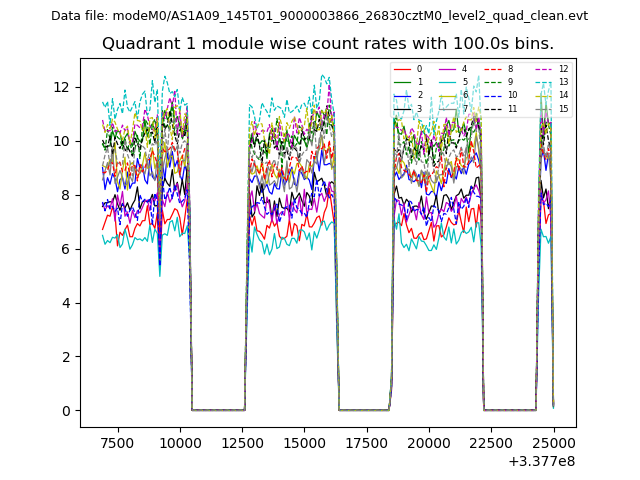 |
 |
| Module-wise count rates for Quadrant C Data is divided into 100 sec bins |
 |
 |
| Module-wise count rates for Quadrant D Data is divided into 100 sec bins |
 |
 |
| Parameter | Plot |
|---|---|
| CZT HV Monitor | 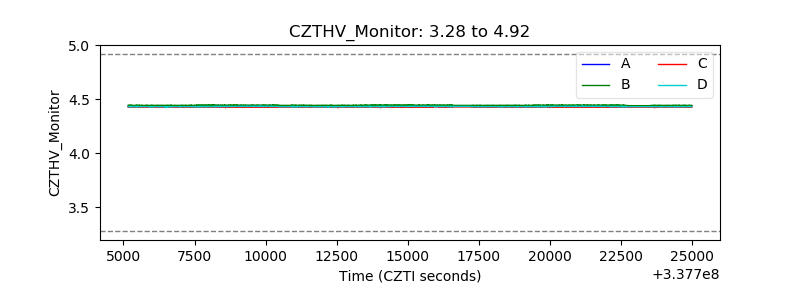 |
| D_VDD | 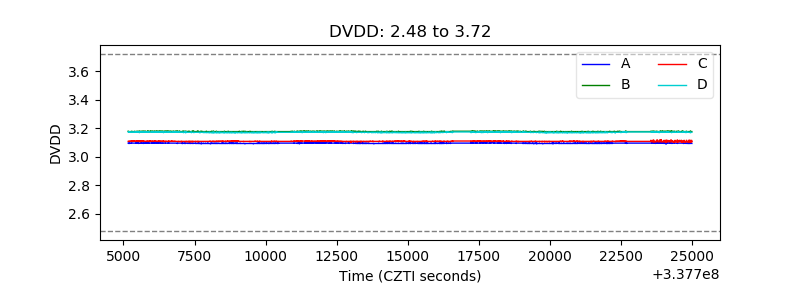 |
| Temperature 1 | 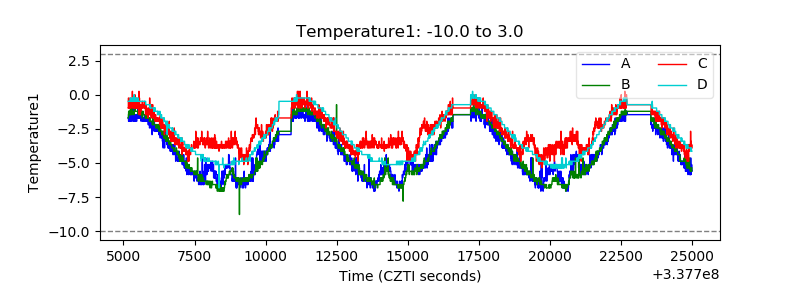 |
| Veto HV Monitor | 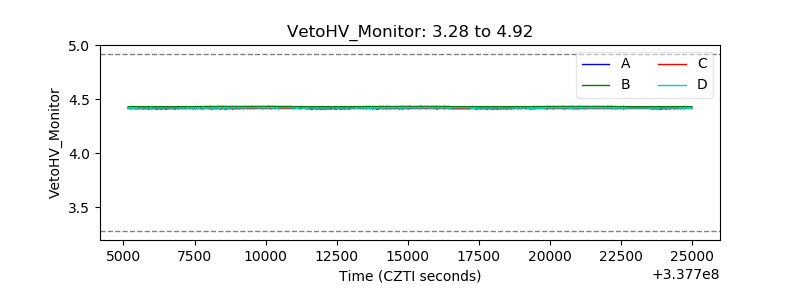 |
| Veto LLD | 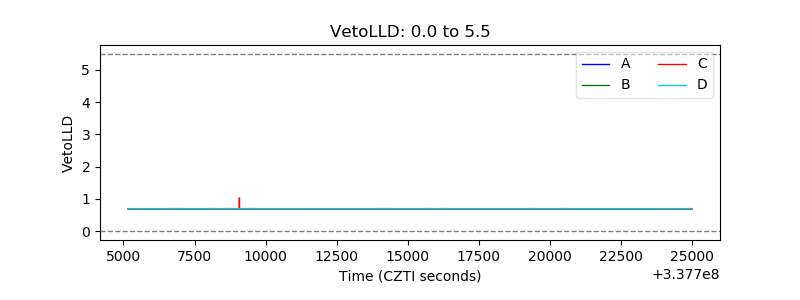 |
| Alpha Counter | 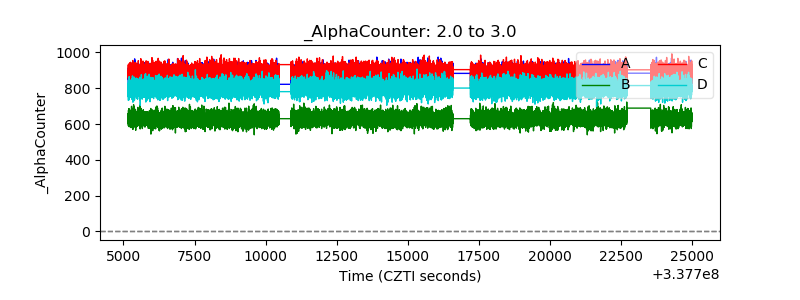 |
| _CPM_Rate | 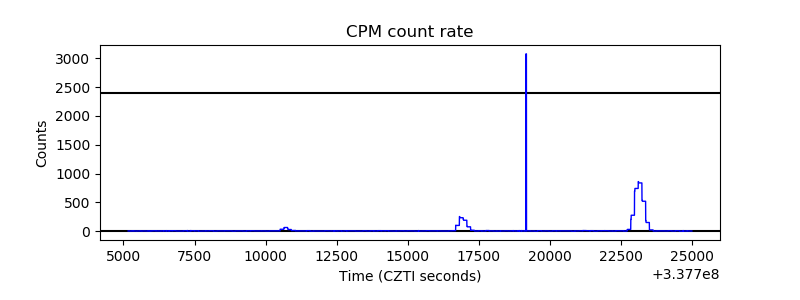 |
| CZT Counter | 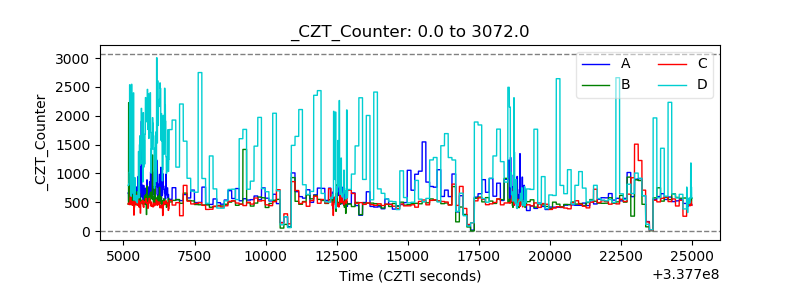 |
| +2.5 Volts monitor | 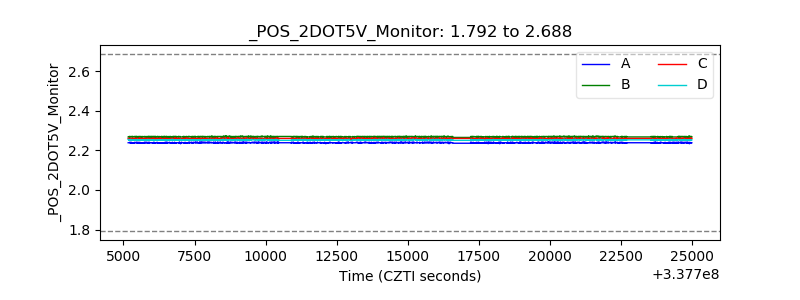 |
| +5 Volts monitor | 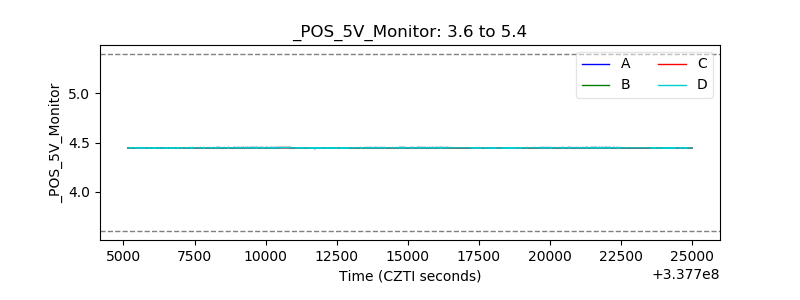 |
| _ROLL_ROT | 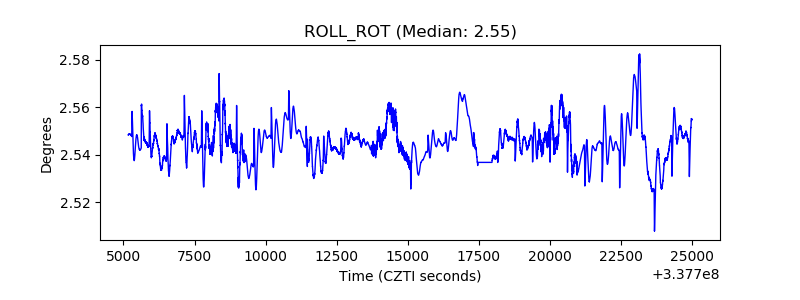 |
| _Roll_DEC | 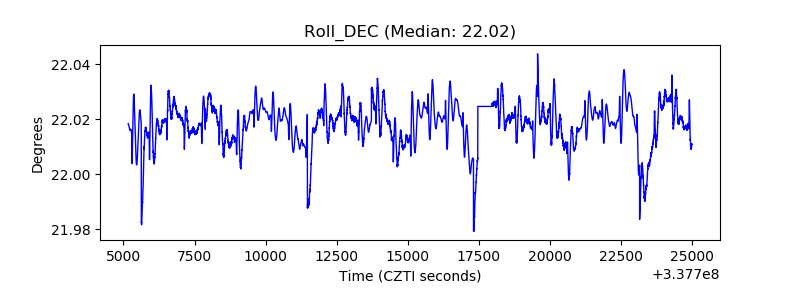 |
| _Roll_RA | 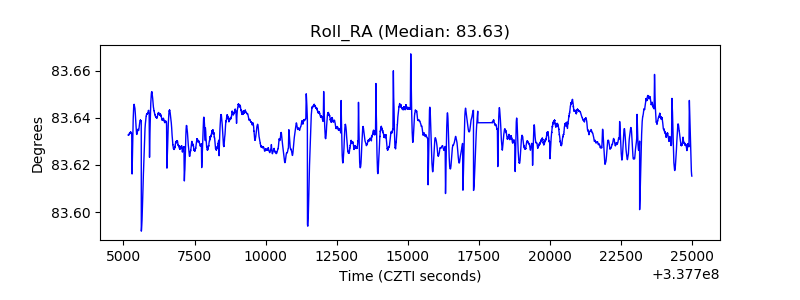 |
| Veto Counter | 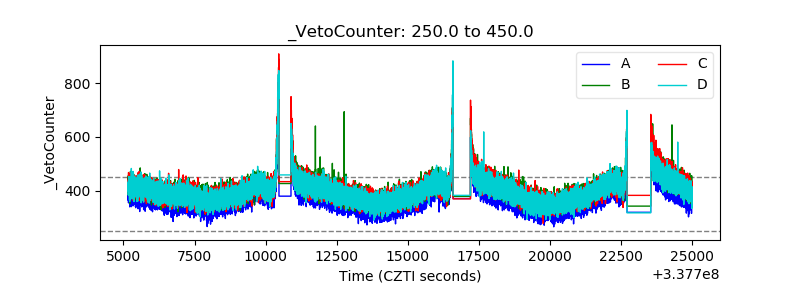 |