| Param | Original file | Final file |
|---|---|---|
| Filename | modeM0/AS1A09_145T01_9000003866_26831cztM0_level2.evt | modeM0/AS1A09_145T01_9000003866_26831cztM0_level2_quad_clean.evt |
| Size (bytes) | 613,388,160 | 100,949,760 |
| Size | 585.0 MB | 96.3 MB |
| Events in quadrant A | 3,659,890 | 662,790 |
| Events in quadrant B | 3,803,152 | 670,352 |
| Events in quadrant C | 3,558,123 | 647,040 |
| Events in quadrant D | 7,081,724 | 589,766 |
| Mode M9 | |||
|---|---|---|---|
| Quadrant | BADHDUFLAG | Total packets | Discarded packets |
| A | 0 | 18 | 0 |
| B | 0 | 18 | 0 |
| C | 0 | 18 | 0 |
| D | 0 | 18 | 0 |
| Mode M0 | |||
|---|---|---|---|
| Quadrant | BADHDUFLAG | Total packets | Discarded packets |
| A | 0 | 15390 | 0 |
| B | 0 | 15656 | 0 |
| C | 0 | 14787 | 0 |
| D | 0 | 25827 | 0 |
| Quadrant | Total seconds | Saturated seconds | Saturation percentage |
|---|---|---|---|
| A | 6990 | 61 | 0.872675% |
| B | 6991 | 117 | 1.673580% |
| C | 6991 | 109 | 1.559147% |
| D | 6991 | 1100 | 15.734516% |
Noise dominated data is calculated using 1-second bins in cleaned event files. If a bin has >2000 counts, and if more than 50% of those come from <1% of pixels, then it is considered to be noise-dominated and hence unusable.
| Quadrant | # 1 sec bins | Bins with >0 counts | Bins with >2000 counts | High rate bins dominated by noise | Noise dominated (total time) | Noise dominated (detector-on time) | Marked lightcurve |
|---|---|---|---|---|---|---|---|
| A | 8805 | 6991 | 0 | 0 | 0.00% | 0.00% | 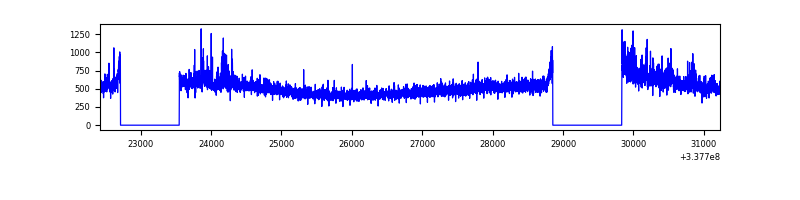 |
| B | 8806 | 6992 | 34 | 34 | 0.39% | 0.49% | 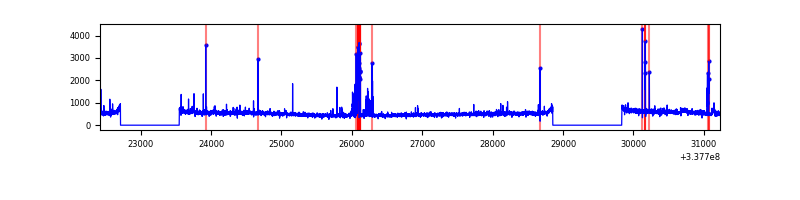 |
| C | 8806 | 6992 | 0 | 0 | 0.00% | 0.00% | 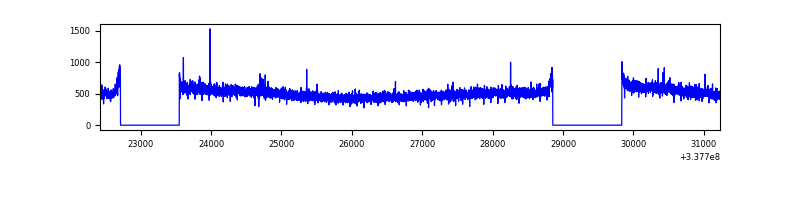 |
| D | 8805 | 6992 | 858 | 858 | 9.74% | 12.27% | 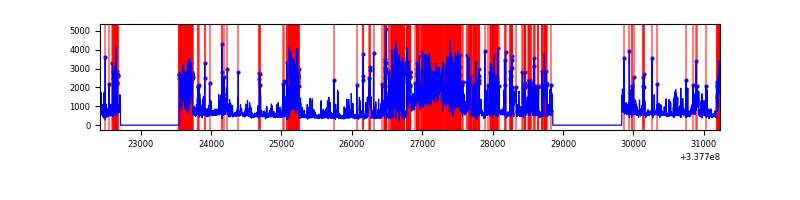 |
Top three noisy pixels from each quadrant. If the there are fewer than three noisy pixels in the level2.evt file, extra rows are filled as -1
| Pixel properties | Quadrant properties | ||||||
|---|---|---|---|---|---|---|---|
| Quadrant | DetID | PixID | Counts | Sigma | Mean | Median | Sigma |
| A | 0 | 13 | 191746 | 1044.89 | 898 | 880 | 182.7 |
| A | 13 | 254 | 12027 | 61.02 | 898 | 880 | 182.7 |
| A | 3 | 137 | 8458 | 41.49 | 898 | 880 | 182.7 |
| B | 3 | 64 | 158507 | 920.13 | 896 | 875 | 171.3 |
| B | 7 | 205 | 59728 | 343.54 | 896 | 875 | 171.3 |
| B | 0 | 189 | 25664 | 144.7 | 896 | 875 | 171.3 |
| C | 14 | 238 | 139874 | 680.26 | 867 | 876 | 204.3 |
| C | 8 | 128 | 11621 | 52.59 | 867 | 876 | 204.3 |
| C | 15 | 208 | 8816 | 38.86 | 867 | 876 | 204.3 |
| D | 1 | 52 | 2088323 | 10462.69 | 830 | 811 | 199.5 |
| D | 15 | 36 | 877052 | 4391.75 | 830 | 811 | 199.5 |
| D | 7 | 80 | 672914 | 3368.61 | 830 | 811 | 199.5 |
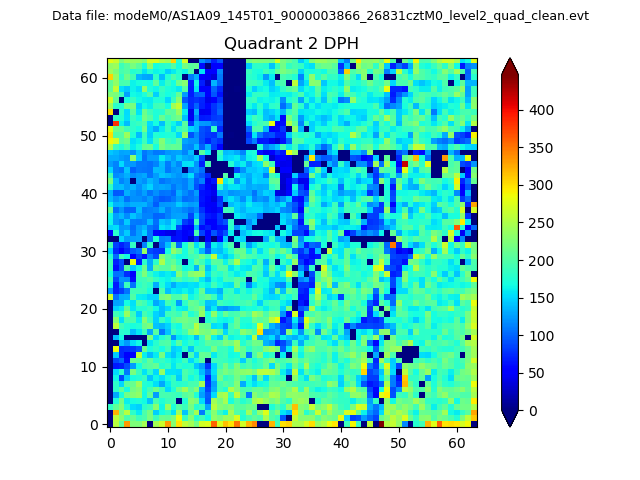
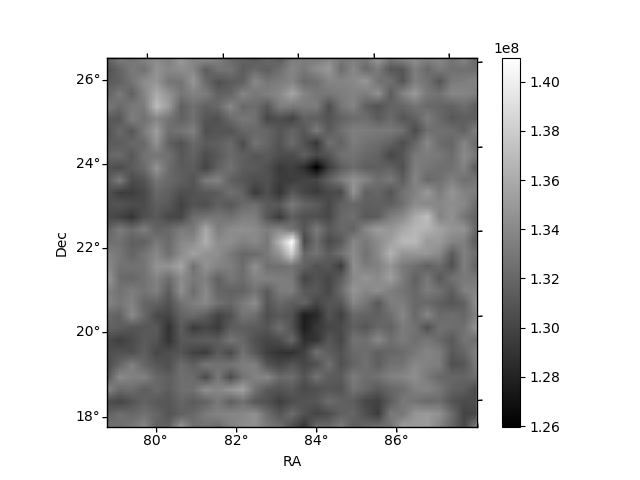
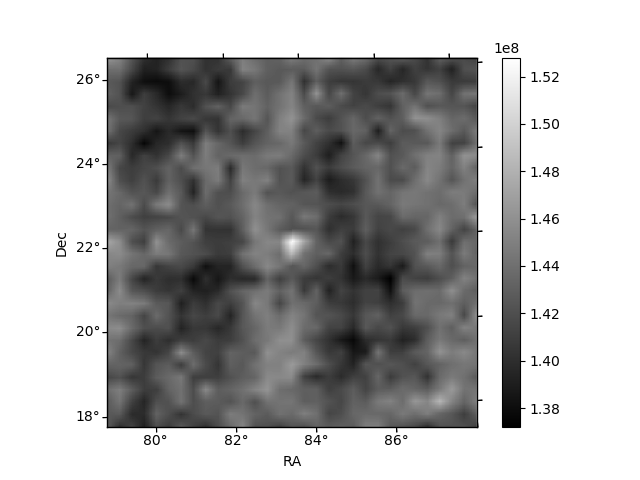
Histogram calculated using DETX and DETY for each event in the final _common_clean file
| Quadrant A | 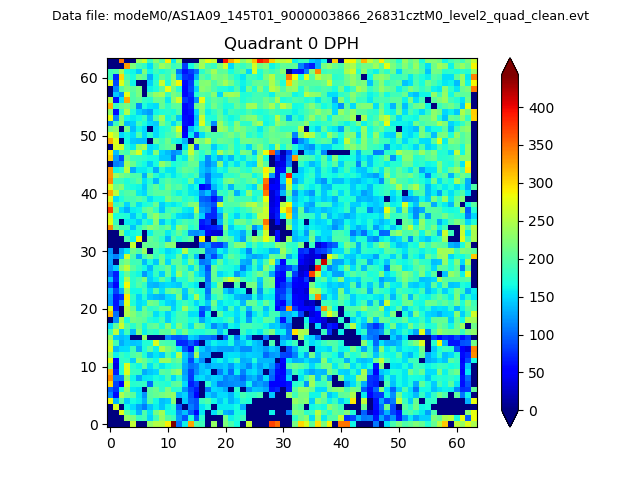 |
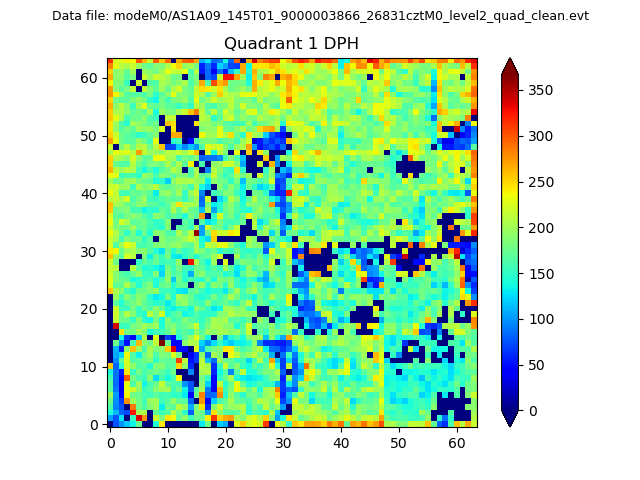 |
Quadrant B |
|---|---|---|---|
| Quadrant D | 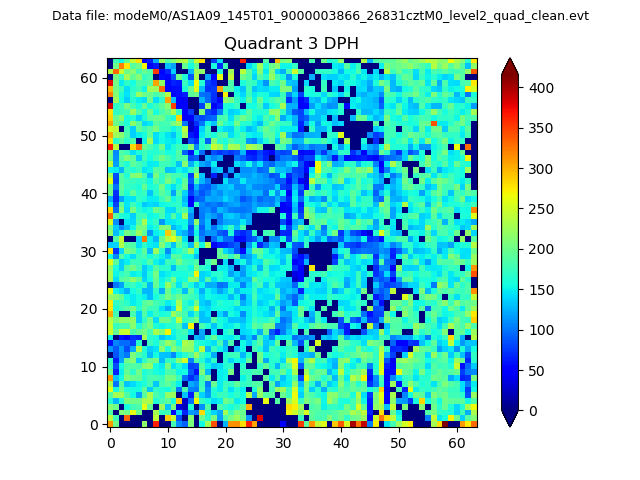 |
 |
Quadrant C |
| Plot type | Count rate plots | Images |
|---|---|---|
| Comparison with Poisson distribution Blue bars denote a histogram of data divided into 1 sec bins. Red curve is a Poisson curve with rate = median count rate of data. |
 |
 |
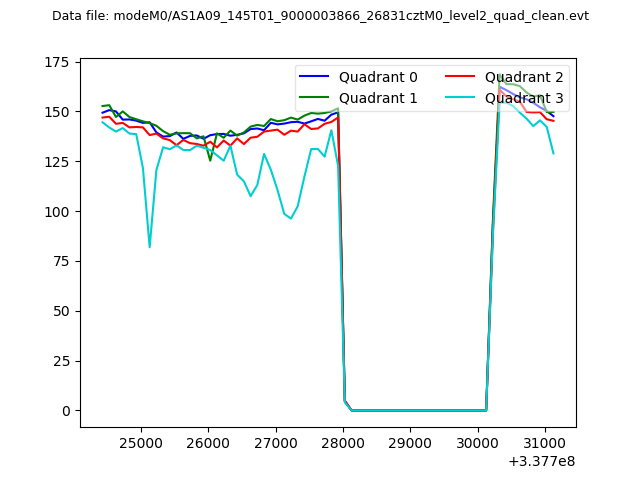
| Quadrant-wise count rates Data is divided into 100 sec bins |
 |
|
| Module-wise count rates for Quadrant A Data is divided into 100 sec bins |
 |
 |
| Module-wise count rates for Quadrant B Data is divided into 100 sec bins |
 |
 |
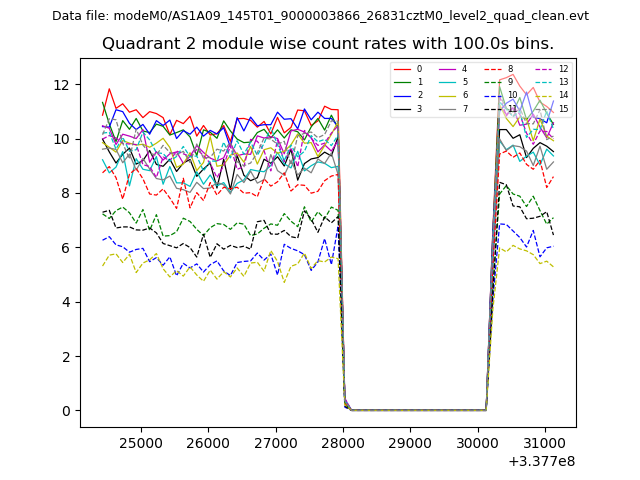
| Module-wise count rates for Quadrant C Data is divided into 100 sec bins |
 |
 |
| Module-wise count rates for Quadrant D Data is divided into 100 sec bins |
 |
 |
| Parameter | Plot |
|---|---|
| CZT HV Monitor | 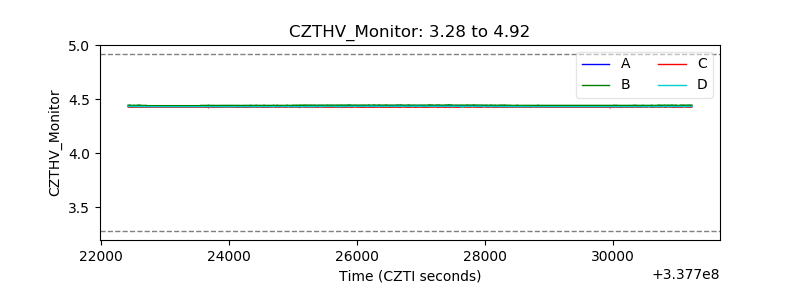 |
| D_VDD | 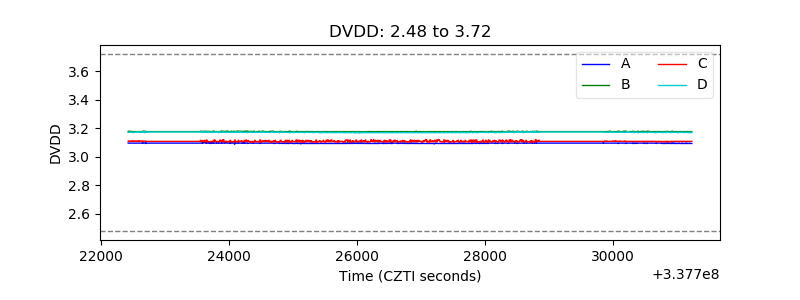 |
| Temperature 1 | 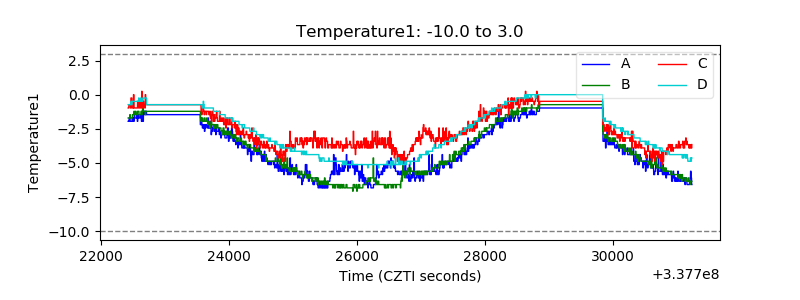 |
| Veto HV Monitor |  |
| Veto LLD | 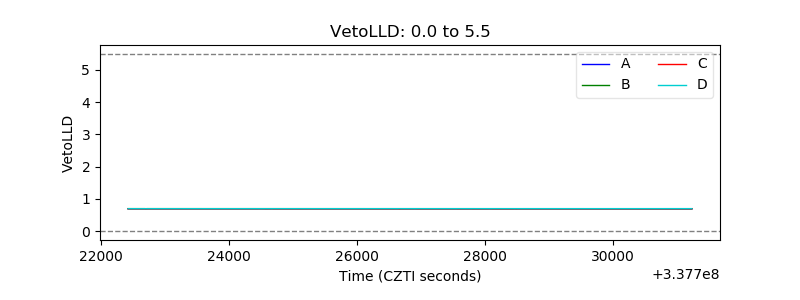 |
| Alpha Counter | 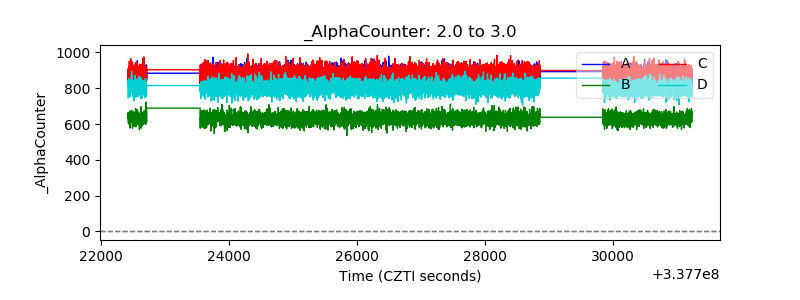 |
| _CPM_Rate | 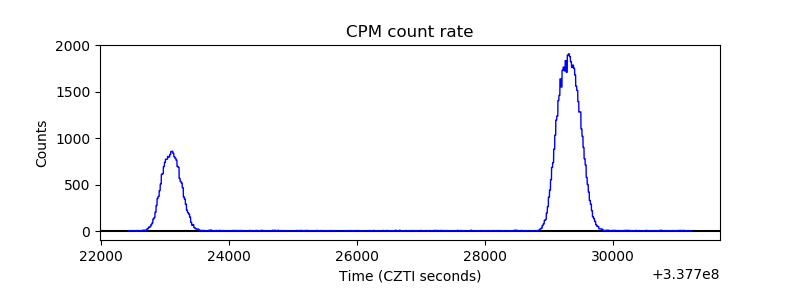 |
| CZT Counter |  |
| +2.5 Volts monitor |  |
| +5 Volts monitor |  |
| _ROLL_ROT | 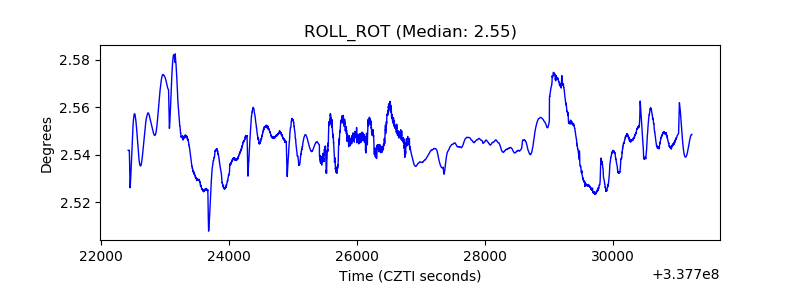 |
| _Roll_DEC |  |
| _Roll_RA |  |
| Veto Counter |  |